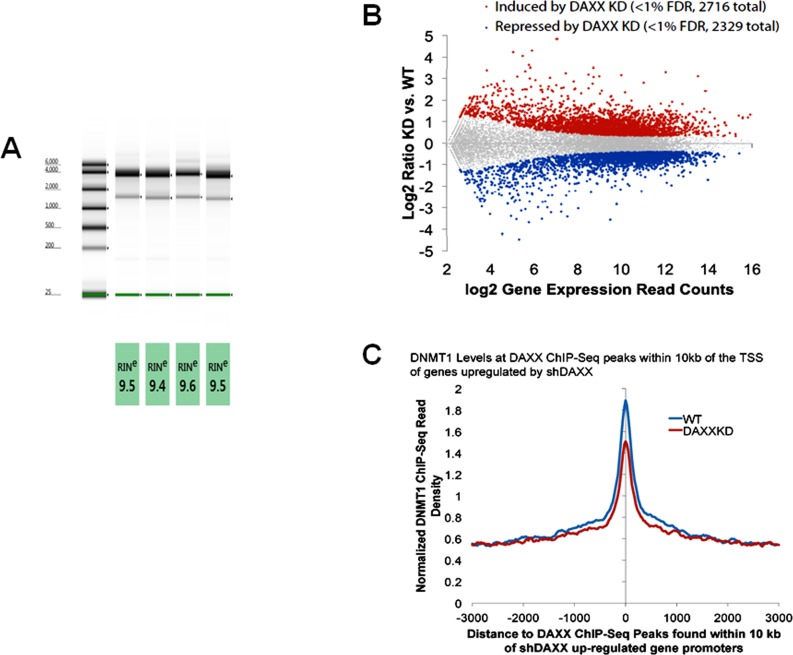
Figure 4. Genes whose expression is increased by DAXX knock down in PC3 cells show low levels of DNMT1 association.
A. Total RNA was isolated from PC3 cells as described under Methods. High quality RNA was obtained, as evidenced by high RINs (RNA Integrity Numbers). The first two lanes represent WT samples, whereas lanes 3 and 4 represent DAXX K/D samples. B. Massively parallel RNA sequencing (RNA-Seq) was used to investigate in an unbiased fashion the expression of different genes, comparing the WT and DAXX K/D expression patterns in PC3 cells, using duplicate samples described in A.. RNA-Seq reads were aligned to the human genome using STAR. Gene expression was determined using HOMER. 2,716 genes were found to be induced and 2,329 repressed by DAXX K/D. Genes induced by DAXX K/D included those involved in autophagy. C. DNMT1 levels at DAXX ChIP-Seq peaks within 10kb of the TSS of genes upregulated by shDAXX are shown. Genes upregulated in DAXX K/D cells have lower DNMT1 levels than those in WT cells, indicating that DNMT1 is employed by DAXX in WT cells to repress these genes.

