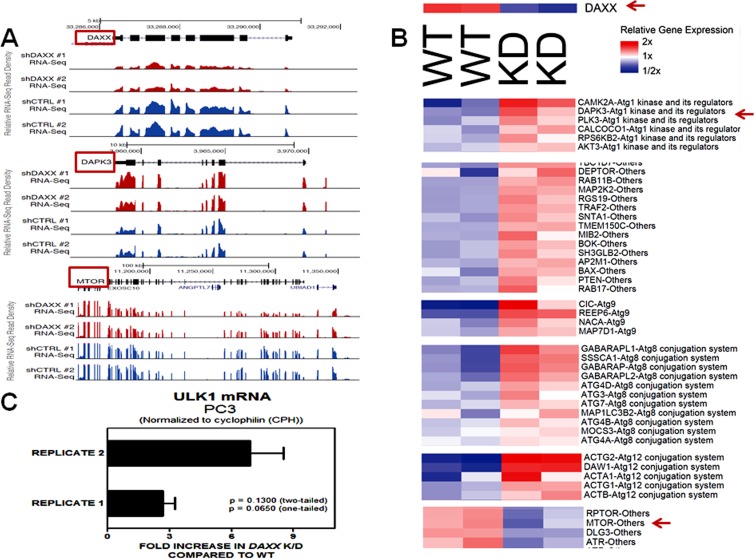
Figure 6. RNA-Seq reveals a connection between DAXX and autophagy regulators.
Genome browser examples A. and a condensed heat map from RNA-Seq experiments B. show an inverse correlation between DAXX and DAPK3 and a linear correlation between DAXX and mTOR. Representative values are plotted in Figure 5. Read densities were visualized by preparing normalized BigWig files using HOMER and uploading them to the UCSC Genome Browser A., as described under Methods. Visualization of gene expression values as heatmaps B. was performed using Java TreeView. Duplicate samples were used per cell line. C. Q-PCR analysis was performed using cDNA samples as described under Materials and Methods to determine ULK1 mRNA levels in WT and DAXX K/D cells, and compare them to RNA-Seq results. DAXX K/D cells show increased levels of ULK1 mRNA compared to WT cells. The variability between replicates was not statistically significant.

