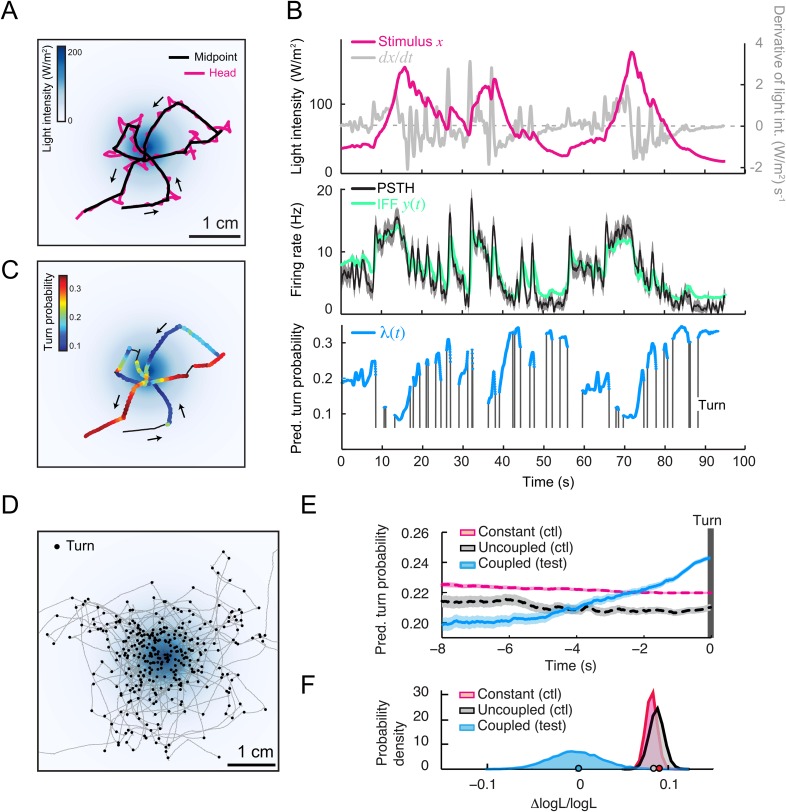
Figure 6. Predictions of the integrated stimulus-to-behavior generalized linear model (GLM) for run-to-turn transitions observed in a virtual olfactory gradient.
(A) Synthetic chemotaxis in a virtual odor gradient produced by light stimulation. The larva experiences a light intensity determined by a predefined stimulus landscape. The landscape displayed in the background of panel A is an exponential gradient centered on a point ‘source’. Larvae responding to this light gradient accumulate at the gradient's peak as observed for odor gradients. Illustrative trajectory of the midpoint (black) and head (magenta). Black arrows indicate the direction of motion. (B) Sensorimotor analysis of a representative trajectory. (Top) Time course of the light intensity associated with the trajectory displayed in panel A. (Middle) PSTH of the OSN activity measured experimentally upon a replay of the intensity time course at the electrophysiology rig (black line). Numerical simulations of the neural activity carried out by the IFF motif (green line) presented in Figure 4B. (Bottom) Turn probability (blue line) predicted from the integrated stimulus-to-behavior GLM presented in Figure 5D (parameter set listed in Table 3). The neural activity simulated in the middle panel is fed into the GLM to predict the turn probability shown in the bottom panel. Behavioral predictions are only shown for the sequences associated with runs. (C) Overlay of the trajectory of the midpoint with the predicted turn probability color-coded in accordance with the color bar on the left. We observe that the turn probability tends to increase (red color range) when the larva is moving away from the gradient's peak, whereas it decreases (blue color range) when the larva is moving toward the peak. (D) Overlay of 10 trajectories recorded in the exponential light gradient shown in panel A. For each trajectory, the position of the midpoint is shown in gray. Turns are indicated as small black circles. (E) Turn-triggered average of the predicted turn probability for the exponential light gradient. A comparison is made between predictions based on the simulated OSN activity driven by the stimulus intensity (test model, blue line), predictions based on the simulated OSN activity driven by the time-reversed stimulus time course (uncoupled control, black line), and predictions based on the assumption that the neural activity stays constant over the course of each trajectory (constant control, magenta line). The parameters of the stimulus-to-behavior GLM are listed in Table 3. We observe that the turn probability steeply increases 4 s before the turn, which coincides with the median duration (3.8 s) of the entire set of runs. Analysis conduced over 750 runs with a duration of minimum 1 s. Shaded areas represent SEM. (F) Log-likelihood of the predictions of the stimulus-to-behavior test GLM compared to the controls. Bootstrap analysis of the difference in log-likelihood (logL) between the test model and the controls normalized by the log-likelihood of the test model (ΔlogL/logLtest). Distribution of the relative difference in logL is shown for the test model against the constant neural activity control (red), and the uncoupled stimulus control (black). The median of the distribution is equal to the value obtained from the original full set of runs; the median of the entire distribution is indicated by a dot in the x-axis. As an internal control, the test model was compared to itself (blue). Out of 10,000 resampled subsets of runs, none of the controls was found to be more likely than the test model (p < 0.0001). The analysis included all observed runs with a duration of minimum 1 s (750 runs originating from 25 trajectories).

