

Abstract
Although UDP-glucuronosyltransferases (UGTs) are important phase II drug-metabolizing enzymes, they are also involved in the metabolism of endogenous compounds. Certain substrates of UGTs, such as serotonin and estradiol, play important roles in the brain. However, the expression of UGTs in the human brain has not been fully clarified. Recently, humanized UGT1 mice (hUGT1 mice) in which the original Ugt1 locus was disrupted and replaced with the human UGT1 locus have been developed. In the present study, the expression pattern of UGT1As in brains from humans and hUGT1 mice was examined. We found that UGT1A1, 1A3, 1A6, and 1A10 were expressed in human brains. The expression pattern of UGT1As in hUGT1 mouse brains was similar to that in human brains. In addition, we examined the expression of UGT1A1 and 1A6 in the cerebellum, olfactory bulbs, midbrain, hippocampus, and cerebral cortex of hUGT1 mice. UGT1A1 in all brain regions and UGT1A6 in the cerebellum and cerebral cortex of 6-month-old hUGT1 mice were expressed at a significantly higher rate than those of 2-week-old hUGT1 mice. A difference in expression levels between brain regions was also observed. Brain microsomes exhibited glucuronidation activities toward estradiol and serotonin, with mean values of 0.13 and 5.17 pmol/min/mg, respectively. In conclusion, UGT1A1 and UGT1A6 might play an important role in function regulation of endogenous compounds in a region- and age-dependent manner. Humanized UGT1 mice might be useful to study the importance of brain UGTs in vivo.
Introduction
UDP-glucuronosyltransferases (UGTs) catalyze glucuronidation of compounds by transferring glucuronic acid from a cosubstrate, UDP-glucuronic acid (UDPGA), to substrates (Dutton, 1980). UGT isoforms have been identified to date belonging to 1A, 2A, 2B, 3A, and 8A subfamilies (Mackenzie et al., 2005). The human UGT1 gene is located on chromosome 2q37 and encodes multiple unique exon 1s and common exons 2–5, producing nine functional UGT1A isoforms: UGT1A1, UGT1A3, UGT1A4, UGT1A5, UGT1A6, UGT1A7, UGT1A8, UGT1A9, and UGT1A10 (Ritter et al., 1992). Each UGT enzyme exhibits substrate specificity and is expressed in a tissue-specific manner (Tukey and Strassburg, 2000). Although UGTs are important phase II drug-metabolizing enzymes (Dutton, 1980), they are also involved in the metabolism of endogenous substances. UGT1As are involved in the metabolism of many endogenous substances such as bilirubin, estradiol, bile acids, thyroid hormone, and serotonin (de Leon, 2003).
Liver is the major organ of glucuronidations, as UGTs are mainly expressed in the liver (Court et al., 2012). However, several UGT isoforms are also expressed in extrahepatic organs such as the intestine, kidney, lung, and skin. Therefore, extrahepatic tissues can also play an important role in glucuronidation of exogenous and endogenous substances. For example, the kidney could substantially contribute to the elimination of propofol, as glucuronidation clearance of propofol in the kidney is relatively comparable to that in the liver (Al-Jahdari et al., 2006). Furthermore, it was recently reported that UGT1A1 expressed in the skin could be involved in glucuronidation of bilirubin and play a protective role against neonatal hyperbilirubinemia (Sumida et al., 2013). It was also recently reported that gastrointestinal UGT1A1 played a significant role in bilirubin metabolism (Aoshima et al., 2014).
In the brain, many endogenous compounds play important roles in the regulation of physiologic function, and are implicated to be a key factor of brain disorders. Some of these endogenous compounds have been identified as substrates for UGTs. For example, serotonin, which is a specific substrate for UGT1A6 (Krishnaswamy et al., 2003), is considered to be involved in the synchronization of locomotion in the cerebellum (Trouillas, 1993), memory information processing in the hippocampus (Sarkisyan and Hedlund, 2009), and mood regulation in the cerebral cortex and hippocampus (Gross et al., 2002). UGTs have been found in the brain. In rat cerebellum and cerebral cortex, mRNA of Ugt1a1, 1a3, 1a5, 1a6, 1a8, 2a1, 2b1, 2b2, 2b3, 2b6, 2b8, and 2b12 was detected (Shelby et al., 2003). Ugt1a1 was more highly expressed in rat cerebellum than the cerebral cortex. King et al. (1999) demonstrated mRNA expressions of UGT1A6 and UGT2B7 in human brain using reverse-transcription polymerase chain reaction (RT-PCR) techniques. The glucuronidation activities of human brain microsomes toward morphine and naloxone, the probe substrates for UGT2B7, and 1-naphthol, which is glucuronidated by multiple UGT isoforms (Uchaipichat et al., 2004), have been reported (Wahlström et al., 1988; Viani et al., 1990). This suggests that functional UGTs were expressed in human brain. However, a complete expression pattern of human UGTs in total brain and in brain regions has not been clarified. In addition, as the number of studies on glucuronidation activity of UGTs in the brain was limited, the expression of functional UGTs in human brain remains to be investigated.
Mice and rats are often used for studies on UGTs in the brain because of the difficulty in obtaining human brains. However, it should be noted that there are species differences in UGT expressions between rodents and humans (Shelby et al., 2003; Buckley and Klaassen, 2007, Nakamura et al., 2008). Recently, humanized UGT1 mice (hUGT1 mice) in which the original Ugt1 locus was disrupted and replaced with the human UGT1 locus have been developed (Fujiwara et al., 2010, 2012). As UGT1A expression patterns in the liver and small intestine of hUGT1 mice were similar to those of humans (Nakamura et al., 2008; Fujiwara et al., 2010), hUGT1 mice have been used to evaluate pharmacological and toxicological species differences in UGTs (Kutsuno et al., 2013, 2014). Therefore, in this study, the expression pattern of UGT1As in brains from humans and hUGT1 mice was examined. The expression of UGT1A1 and UGT1A6 in brain regions, such as the cerebellum, olfactory bulbs, midbrain, hippocampus, and cerebral cortex, of hUGT1 mice was further quantitatively examined. Additionally, we investigated glucuronidation activity toward estradiol and serotonin in brain microsomes of hUGT1 mice to examine whether UGTs in the brain were functional. The inducibility of UGT mRNAs and glucuronidation activities toward estradiol and serotonin in hUGT1 mouse brain were also examined.
Materials and Methods
Chemicals and Reagents.
The 36- to 51- years female human total brain (containing meningioma) RNA was purchased from OriGene (Rockville, MD). UDPGA, alamethicin, estradiol, and estradiol 3-O-glucuronide were purchased from Sigma-Aldrich (St. Louis, MO). Serotonin β-d-glucuronide was purchased from Toronto Research Chemicals (Toronto, ON, Canada). Primers were commercially synthesized at Life Technologies (Carlsbad, CA). KOD-Plus-Neo was purchased from Toyobo Co., Ltd. (Osaka, Japan). 5-Hydroxytryptamine hydrochloride (serotonin) was purchased from Wako Pure Chemical (Osaka, Japan). Human liver microsomes were obtained from BD Gentest (Woburn, MA). Protease inhibitor cocktails were from Roche Diagnostics (Mannheim, Germany). All other chemicals and solvents were of analytical grade or the highest grade commercially available.
Animals and Tissue Collection.
Tg (UGT1A1*28) Ugt1−/− (hUGT1) mice were developed previously in a C57BL/6 background (Fujiwara et al., 2010). All animals received food and water ad libitum, and mouse handling and experimental procedures were conducted in accordance with the animal care protocol approved by Kitasato University. Adult male and female mice were anesthetized by diethyl ether inhalation and sacrificed by decapitation. Brains were removed and rinsed in cold phosphate-buffered saline, and were stored at −80°C. Carbamazepine (CBZ) suspended in 5% dimethylsulfoxide and pregnenolone-16α-carbonitrile (PCN) suspended in canola oil were administered to male hUGT1 mice (16 weeks) for 7 consecutive days (100 mg/kg by mouth for CBZ and 100 mg/kg i.p. for PCN). Brains and livers perfused with ice-cold 1.15% KCl were collected 24 hours after the last administration and were used for the RNA extraction and preparation of microsomes. For RNA extraction of brain regions, young male mice (2 weeks) and adult male mice (6 months) were anesthetized by diethyl ether inhalation and sacrificed by decapitation. After brains were quickly removed and rinsed in phosphate-buffered saline, brain regions (cerebellum, cerebral cortex, midbrain, hippocampus, and olfactory bulb) were dissected on ice immediately and stored at −80°C.
Total RNA and Reverse Transcription.
Total RNA of hUGT1 mouse whole brain and brain regions was extracted with TRIzol reagent (Life Technologies). The cDNA was synthesized from 1 µg of total RNA of human and hUGT1 mouse brain using ReverTra Ace (Toyobo, Osaka, Japan). After the reverse-transcription reaction at 37°C for 15 minutes and at 50°C for 5 minutes, the reaction mixture was incubated at 95°C for 5 minutes for deactivation of the reverse transcriptase. RT mixture of human brain total RNA was diluted 10-fold in Tris-EDTA buffer.
RT-PCR.
A 0.5-µl portion of RT mixture of hUGT1 mouse brain or the diluted cDNA of human brain was added to PCR mixtures (25 μl). After an initial denaturation at 95°C for 2 minutes, the amplification was performed by denaturation at 98°C for 10 seconds, annealing at an appropriate temperature for 30 seconds, and extension at 72°C for 10 seconds for 45 cycles. The sequences and annealing temperature of primers are shown in Table 1. The PCR products (20 µl) were analyzed by electrophoresis with 2% agarose gel and visualized by ethidium bromide staining. Expression of glyceraldehyde 3-phosphate dehydrogenase or cyclophilin (CPH) mRNA was used as an internal control for the cDNA quantity and quality.
TABLE 1.
Sequence of primers used for RT-PCR and quantitative RT-PCR
| Isoforms | Primers | Sequence | Position | Annealing Temperature | References |
|---|---|---|---|---|---|
| °C | |||||
| UGT1A1 | UGT1A1-S | 5′-CCT TGC CTC AGA ATT CCT TC-3′ | 696–715 | 62 | Nakamura et al. (2008) |
| UGT1A-AS | 5′-ATT GAT CCC AAA GAG AAA ACC AC-3′ | 907–929 | Nakamura et al. (2008) | ||
| UGT1A3 | UGT1A3-S | 5′-TGT TGA ACA ATA TGT CTT TGG TCT-3′ | 347–370 | 62 | Nakamura et al. (2008) |
| UGT1A3-AS | 5′-CAC AGG ACT GTC TGA GGG ATT TT-3′ | 985–1007 | — | ||
| UGT1A4 | UGT1A4-S | 5′-CCT GCT GTG TTT TTT TGG AGG T-3′ | 502–523 | 54 | Izukawa et al. (2009) |
| UGT1A-AS | 5′-ATT GAT CCC AAA GAG AAA ACC AC-3′ | 907–929 | Nakamura et al. (2008) | ||
| UGT1A5 | UGT1A5-S | 5′-ACA ATA TGT CTT TGA TCA TA-3′ | 353–372 | 54 | Nakamura et al. (2008) |
| UGT1A5-AS | 5′-AGA AAC AGC ATG GCA AAG-3′ | 667–684 | Nakamura et al. (2008) | ||
| UGT1A6 | UGT1A6-S | 5′-AGA GAA TTT CTG CAG GGG TTT T-3′ | 26–47 | 54 | Nakamura et al. (2008) |
| UGT1A6-AS | 5′-TTG GAT TCT TTC AAA AGC-3′ | 195–212 | Nakamura et al. (2008) | ||
| UGT1A7 | UGT1A7-S | 5′-CCC CTA TTT TTT CAA AAA TGT CTT-3′ | 660–683 | 54 | Izukawa et al. (2009) |
| UGT1A-AS | 5′-ATT GAT CCC AAA GAG AAA ACC AC-3′ | 907–929 | Nakamura et al. (2008) | ||
| UGT1A8 | UGT1A8-S | 5′-GGT CTT CGC CAG GGG AAT AG-3′ | 498–517 | 62 | Nakamura et al. (2008) |
| UGT1A-AS | 5′-ATT GAT CCC AAA GAG AAA ACC AC-3′ | 907–929 | Nakamura et al. (2008) | ||
| UGT1A9 | UGT1A9-S | 5′-GAA CAT TTA TTA TGC CAC CG-3′ | 646–665 | 62 | Nakamura et al. (2008) |
| UGT1A-AS | 5′-ATT GAT CCC AAA GAG AAA ACC AC-3′ | 907–929 | Nakamura et al. (2008) | ||
| UGT1A10 | UGT1A10-S | 5′-CTC TTT CCT ATG TCC CCA ATG A-3′ | 557–578 | 62 | Nakamura et al. (2008) |
| UGT1A-AS | 5′-ATT GAT CCC AAA GAG AAA ACC AC-3′ | 907–929 | Nakamura et al. (2008) | ||
| Cyp2b10 | Cyp2b10-S | 5′-GCA AGC CAT GTT GCT CCT AA-3′ | 1405–1424 | 60 | — |
| Cyp2b10-AS | 5′-CTT GGA GCC CTG GAG ATT TGG-3′ | 1604–1624 | — | ||
| Cyp3a11 | Cyp3a11-S | 5′-CTC AAT GGT GTG TAT ATC CCC-3′ | 1228–1248 | 60 | Fujiwara et al. (2012) |
| Cyp3a11-AS | 5′-CCG ATG TTC TTA GAC ACT GCC-3′ | 1630–1650 | Fujiwara et al. (2012) | ||
| GAPDH | GAPDH-S | 5′-CCA GGG CTG CTT TTA ACT C-3′ | 56–74 | 62 | Nakamura et al. (2008) |
| GAPDH-AS | 5′-GCT CCC CCC TGC AAA TGA-3′ | 330–347 | Nakamura et al. (2008) | ||
| CPH | CPH-S | 5′-CAG ACG CCA CTG TCG CTT T-3′ | 5–23 | 62 | Fujiwara et al. (2012) |
| CPH-AS | 5′-TGT CTT TGG AAC TTT GTC TGC AA-3′ | 115–137 | Fujiwara et al. (2012) |
GAPDH, glyceraldehyde 3-phosphate dehydrogenase.
Quantitative RT-PCR.
Quantitative RT-PCR was performed with THUNDERBIRD SYBR qPCR Mix (Toyobo), and the reactions were run in a CFX96 Real-Time PCR Detection System (Bio-Rad, Hercules, CA). Primer pairs were UGT1A1-sense primer (S) and UGT1A-antisense primer (AS), UGT1A6-S and UGT1A6-AS, Cyp2b10-S and Cyp2b10-AS, Cyp3a11-S and Cyp3a11-AS, and CPH-S and CPH-AS (Table 1). After an initial denaturation at 95°C for 30 seconds, the amplification was performed by denaturation at 95°C for 5 seconds, annealing at an appropriate temperature for 30 seconds, and extension at 72°C for 30 seconds for 45 cycles. UGT mRNA expression levels were normalized with mouse CPH mRNA level.
Preparation of Brain Microsomes.
Brain was homogenized in 3 volumes of homogenization buffer (1.15% KCl/100 mM potassium phosphate buffer, pH 7.4, containing protease inhibitor cocktails). The homogenate was centrifuged at 9000 × g for 15 minutes at 4°C, and the supernatant was collected. The supernatant was centrifuged at 105,000 × g for 60 minutes at 4°C, and the pellet was suspended in a stock buffer (20% glycerol/1.15% KCl/100 mM potassium phosphate buffer, pH 7.4) and used as the microsomal fraction. All of these procedures were performed as quickly as possible. Protein concentrations of microsomal fractions were measured by the Bradford method using bovine serum albumin as a standard (Bradford, 1976).
Enzyme Assays.
Estradiol and serotonin glucuronide formation was determined according to the reported method, with slight modifications (Krishnaswamy et al., 2003; Shibuya et al., 2013). In brief, a typical incubation mixture (200 μl of total volume) contained 100 mM phosphate buffer (pH 7.4), 4 mM MgCl2, 5 mM UDPGA, 50 μg/ml alamethicin, 1.0 mg/ml brain microsomes, and 100 µM estradiol or 10 mM serotonin. The reaction was initiated by the addition of UDPGA after a 3-minute preincubation at 37°C. Incubation was performed for 12 hours for estradiol 3-O-glucuronidation in brain microsomes, 60 minutes for serotonin glucuronidation, and 30 minutes for estradiol 3-O-glucuronidation in liver microsomes. The reaction was terminated by the addition of 200 μl of cold methanol for estradiol 3-O-glucuronidations or acetonitrile for serotonin glucuronidation. After removal of the protein by centrifugation at 12,000g for 5 minutes, a 50-μl portion of the sample was subjected to high-performance liquid chromatography (HPLC).
HPLC Conditions.
Glucuronides were determined by the HPLC system with an LC-10AD pump (Shimadzu, Kyoto, Japan), an FP-2020 fluorescence detector (JASCO, Tokyo Japan), a SIL-10A autosampler (Shimadzu), an SLC-10A system controller (Shimadzu), and a Mightysil RP-18 GP column (4.6 × 150 mm, 5 μm; Kanto Chemical, Tokyo, Japan). The mobile phases were 3% acetonitrile containing 20 mM phosphate potassium buffer (pH 7.4) for the serotonin glucuronide and 10 mM H3PO4-methanol (45:55, v/v) for estradiol 3-O-glucuronide. The flow rate was 1.0 ml/min. Glucuronides were detected with a fluorescence detector at 280-nm excitation and 310-nm emission for the estradiol 3-O-glucuronide and at 225-nm excitation and 330-nm emission for the serotonin glucuronide. Quantifications of estradiol 3-O-glucuronide and serotonin glucuronide were carried out by comparing the HPLC peak area to those of the authentic standards. The retention times of estradiol 3-O-glucuronide and serotonin glucuronide were 6.4 and 3.7 minutes, respectively.
Statistical Analysis.
Statistical differences in UGT1A1 and 1A6 expression levels between corresponding regions of 2-week-old and 6-month-old hUGT1 mouse brains were analyzed by a two-way analysis of variance with post-hoc t test comparisons. Statistical differences in UGT1A1 and UGT1A6 expression levels between brain regions in 2-week-old and 6-month-old hUGT1 mice were analyzed by a two-way analysis of variance with post-hoc Tukey test. P < 0.05 was considered significant.
Results
mRNA Expression of UGT1As in Human Brain and hUGT1 Mouse Brain.
Although it was reported that mRNA of UGT1A6 and UGT2B7 was expressed in human brain (King et al., 1999), expressions of the other UGTs in human brain have not been clarified yet. In this study, expressions of UGT1A in human and hUGT1 mouse brain were determined. In human brain, UGT1A1, UGT1A3, UGT1A6, and UGT1A10 were expressed (Fig. 1A). As UGTs in brains from three different human donors were expressed similarly, large interindividual differences in the expression pattern of UGT1As were not observed. In the hUGT1 mice, UGT1A1, 1A3, 1A6, and 1A10 were expressed in the brain (Fig. 1B), which was in agreement with our previous study (Sakamoto et al., 2015). The expression pattern of UGT1As in the brain was very similar between human and hUGT1 mice (Fig. 1, A and B), indicating that hUGT1 mice might be useful to understand the expression and function of human UGT1As in the brain. As the expression patterns of UGT1As in female and male hUGT1 mouse brains were similar to each other (Fig. 1B), sex differences in expression pattern of UGT1As were not observed.
Fig. 1.

RT-PCR analysis of UGT mRNA in brains of humans and hUGT1 mice. Total RNA samples from three human brains containing meningioma (A) or male and female hUGT1 mouse brains (B) were analyzed by RT-PCR using primer pairs specific for each UGT1A isoform. M, 100 bp DNA ladder marker.
Expression Level of UGT1A1 and UGT1A6 in Brain Regions of hUGT1 Mouse.
The region- and age-dependent differences in the expression of CYP2D6 involved in the metabolism of endogenous compounds have been reported (Miksys et al., 2000). However, the expression of UGTs in human brain regions has not been examined. As UGT1A1, 1A3, 1A6, and 1A10 were expressed in hUGT1 mouse brain (Fig. 1B), we investigated the expression levels of UGT1A1, 1A3, 1A6, and 1A10 in brain regions of young (2 weeks) and adult (6 months) hUGT1 mice. Since threshold cycle values of UGT1A3 and UGT1A10 were high (threshold cycle > 35), we were not able to quantitatively analyze the expression of UGT1A3 and UGT1A10. ERVmch8 (murine leukemia virus type–endogenous retrovirus mapped on chromosome 8), GATA binding protein 3, and serine peptidase inhibitor Kazal type 8 have been known to be highly expressed in the cerebellum, midbrain, and hippocampus, respectively (Nozawa et al., 2009; Lee et al., 2011). It was confirmed that those marker genes were specifically expressed in the respective brain regions in our study (Supplemental Fig. 1).
In this study, relative expression levels were expressed as the ratio relative to the lowest expression sample in 2-week-old and 6-month-old hUGT1 mice (white columns in Figs. 2 and 3). The relative expression of UGT1A1 in 2-week-old hUGT1 mice was between 1.8 and 6.0 in the cerebellum, 1.4 and 15.0 in the midbrain, 1.0 and 5.9 in the olfactory bulb, 2.4 and 8.1 in the hippocampus, and 1.3 and 5.7 in the cerebral cortex, showing a 3.2- to 11.2-fold variability in each region. The expression level of UGT1A1 in the midbrain of 2-week-old hUGT1 mice was statistically higher than that in the cerebellum, olfactory bulb, and cerebral cortex of 2-week-old hUGT1 mice (P < 0.05). The relative expression of UGT1A1 in 6-month-old hUGT1 mice was between 21.0 and 30.6 in the cerebellum, 13.3 and 23.6 in the midbrain, 11.1 and 28.9 in the olfactory bulb, 12.6 and 24.0 in the hippocampus, and 15.2 and 20.1 in the cerebral cortex, showing a 1.3- to 2.6-fold variability in each region. UGT1A1 in the cerebellum, midbrain, olfactory bulb, hippocampus, and cerebral cortex of 6-month-old hUGT1 mice was expressed significantly higher than that of 2-week-old hUGT1 mice (P < 0.05).
Fig. 2.

The expression level of UGT1A1 in hUGT1 mouse brain regions. Total RNA from brains of 2-week-old mice (n = 5) and 6-month-old mice (n = 5) was analyzed by quantitative RT-PCR. Each column is the mean ± S.D. of three independent determinations. Two-way analysis of variance with post-hoc t test and Tukey test was used to determine statistical significance. **P < 0.01, ***P < 0.001 compared with the expression in each region of 2-week-old mice. #P < 0.05, ##P < 0.01 when comparing brain regions between 2-week-old and 6-month-old hUGT1 mice (two-way analysis of variance with post-hoc Tukey test). CB, cerebellum; HC, hippocampus; MB, midbrain; OB, olfactory bulbs; CX, cerebral cortex.
Fig. 3.

The expression level of UGT1A1 in hUGT1 mouse brain regions. Total RNA from brains of 2-week-old hUGT1 mice (n = 5) and 6-month-old hUGT1 mice (n = 5) was analyzed by quantitative RT-PCR. Two-way analysis of variance with post-hoc t test and Tukey test was used to determine statistical significance. *P < 0.05, **P < 0.01 compared with the expression in each region of 2-week-old mice (two-way analysis of variance with post-hoc t test). #P < 0.05, ##P < 0.01 when comparing brain regions between 2-week-old and 6-month-old hUGT1 mice (two-way analysis of variance with post-hoc Tukey test). CB, cerebellum; HC, hippocampus; MB, midbrain; OB, olfactory bulbs; CX, cerebral cortex.
The relative expression of UGT1A6 in 2-week-old hUGT1 mice was between 1.2 and 3.6 in the cerebellum, 1.0 and 4.0 in the midbrain, and 1.3 and 2.3 in the cerebral cortex, showing small variability in each region. The relative expression of UGT1A6 in 2-week-old hUGT1 mice was between 1.1 and 6.9 in the olfactory bulb and 1.0 and 19.2 in the hippocampus, showing greater variability in each region. The relative expression of UGT1A6 in 6-month-old hUGT1 mice was between 2.4 and 4.0 in the hippocampus and 3.0 and 5.2 in the cerebral cortex, showing small variability in each region. The relative expression of UGT1A6 in 6-month-old hUGT1 mice was between 4.3 and 19.3 in the cerebellum, 1.3 and 5.5 in the midbrain, and 2.5 and 10.4 in the olfactory bulb, showing 4-fold variability in each region. The expression level of UGT1A6 in the cerebellum of 6-month-old hUGT1 mice was statistically higher than that in the midbrain, hippocampus, and cerebral cortex of 6-month-old hUGT1 mice (P < 0.05). Although the expression levels of UGT1A6 in the midbrain, olfactory bulb, and hippocampus of 6-month-old hUGT1 mice were similar to those of 2-week-old hUGT1 mice, the expression levels of UGT1A6 in the cerebellum and cerebral cortex of 6-month-old hUGT1 mice were statistically higher than those of 2-week-old hUGT1 mice (P < 0.05).
Effect of CBZ and PCN on mRNA Expression Levels of UGT1A1 and UGT1A6 in the Brain and Liver of hUGT1 Mice.
Whereas CBZ can induce UGTs, CYP2B6, and CYP3A4 in the human liver through constitutive androstane receptor (Hewitt et al., 2007), PCN can induce hepatic Ugts and Cyp3a11 through the pregnane X receptor (PXR) (Buckley and Klaassen, 2007). Since it has not been reported whether UGTs could be induced in brains, we investigated the effect of CBZ and PCN on expression levels of UGT1A1 and UGT1A6 in the brain and liver of hUGT1 mice. CBZ and PCN significantly induced UGT1A1 in the hUGT1 mouse liver (Fig. 4A). In the brain of hUGT1 mice, UGT1A1 was slightly induced by CBZ, but not by PCN (Fig. 4B). UGT1A6 was not significantly induced by CBZ in the liver, whereas it was induced by PCN (Fig. 4C). Although there was a considerable interindividual difference in expression levels of UGT1A6 in brains of hUGT1 mice treated with CBZ, one of the CBZ-treated mice had a significantly higher expression of UGT1A6 in the brain than nontreated hUGT1 mice, although UGT1A6 was not induced in all of the PCN-treated mouse brains (Fig. 4D).
Fig. 4.

The effect of inducers treatment on UGT1A1 expression in brains and livers of hUGT1 mice. Total RNA was isolated from nontreated hUGT1 mice (n = 3) and inducers-treated hUGT1 mice (n = 3). Complementary DNA was synthesized, and then quantitative RT-PCR was carried out for human UGT1A1 in the hUGT1 mouse liver (A) and brain (B) and UGT1A6 in the hUGT1 mouse liver (C) and brain (D). Each column is the mean ± S.D. of three independent determinations.
The relative levels of UGT1A1 and UGT1A6 mRNA expressions in brain regions, total brain, and liver were compared (Supplemental Fig. 2). We found that the expression levels of UGT1A1 and UGT1A6 in the brain were much lower than those in the liver.
CBZ also increased the expressions of Cyp2b10 and 3a11, orthologs of human CYP2B6 and 3A4, in the brain of hUGT1 mice (Fig. 5, A and B). Although PCN induced the expression of Cyp3a11 in the liver, it did not induce the gene in the brain (Fig. 5B).
Fig. 5.

The effect of inducers treatment on Cyp expression in hUGT1 mice. Total RNA was isolated from tissues of nontreated hUGT1 mice (n = 3) and inducers-treated hUGT1 mice (n = 3). Complementary DNA was synthesized, and then quantitative RT-PCR was carried out for mouse Cyp2b10 (A) and Cyp3a11 (B) in the hUGT1 mice. Each column is the mean ± S.D. of three indepedent determinations.
Glucuronidation of Estradiol and Serotonin in hUGT1 Mouse Brain Microsomes and Human Liver Microsomes.
To examine the expression of functional UGTs in hUGT1 mouse brains, glucuronidation activities toward estradiol, which is a probe substrate for UGT1A1, and serotonin, which is a probe substrate for UGT1A6 (Court, 2005), were examined using brain microsomes prepared from hUGT1 mice. Furthermore, the effect of CBZ and PCN on glucuronidation activity toward estradiol and serotonin in hUGT1 mouse brain microsomes was also investigated in this study. Although the activity toward estradiol 3-O-glucuronidation was not detected in more than half of nontreated hUGT1 mouse brain microsomes, a few samples of brain microsomes exhibited activity toward estradiol 3-O-glucuronidation (Fig. 6, left). In contrast, all of the CBZ-treated hUGT1 mice exhibited estradiol 3-O-glucuronidation activity (Fig. 6). The estradiol 3-O-glucuronidation activity in brain microsomes of CBZ-treated hUGT1 mice was higher than that of nontreated hUGT1 mice, with mean values of 0.13 pmol/min/mg for brain microsomes of nontreated hUGT1 mice and 1.52 pmol/min/mg for brain microsomes of CBZ-treated hUGT1 mice (Fig. 6). PCN-treated hUGT1 mice exhibited no estradiol 3-O-glucuronidation activity (Fig. 6).
Fig. 6.
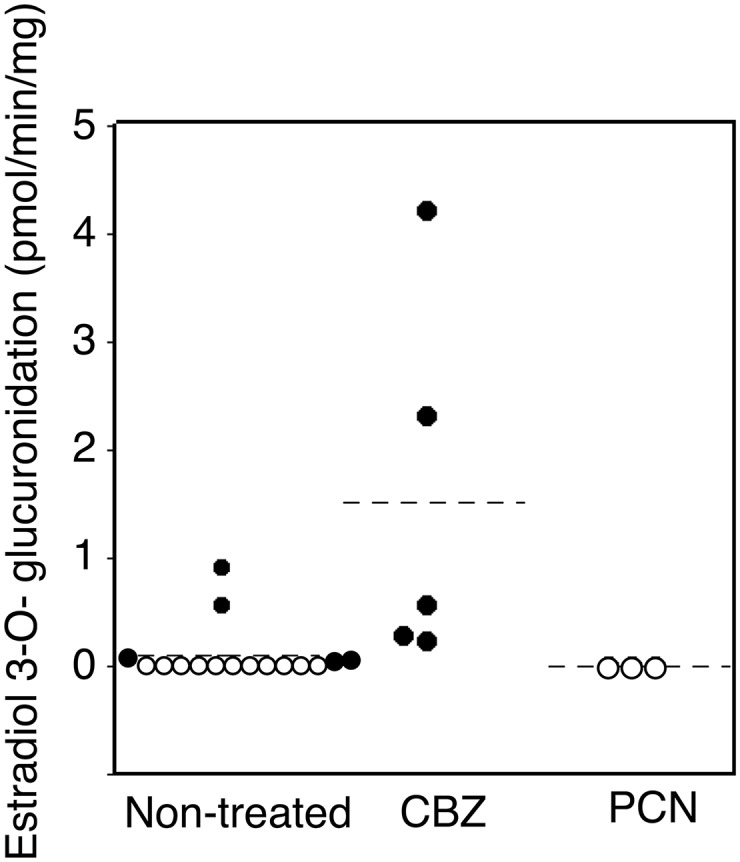
Effects of inducers treatments on UGT1A1 activity in the brain microsomes of hUGT1 mice. Microsomes from nontreated hUGT1 mice (n = 12) and inducers-treated hUGT1 mice (n > 3) were prepared, and estradiol 3-O-glucuronide formation was measured. Open circles indicate the microsome samples that did not exhibit glucuronidation activity toward estradiol. Filled circles indicate the microsome samples that exhibited glucuronidation activity toward estradiol.
Serotonin glucuronidation was detected in all but one of the nontreated hUGT1 mouse brain microsomes (Fig. 7, left). All of the CBZ- and PCN-treated hUGT1 mice exhibited serotonin glucuronidation activity (Fig. 7). The serotonin glucuronidation activities in brain microsomes of hUGT1 mice treated with CBZ and PCN were higher than that of nontreated hUGT1 mice, with 5.17 pmol/min/mg in nontreated hUGT1 mouse brain microsomes, 12.7 pmol/min/mg in brain microsomes of hUGT1 mice treated with PCN, and 31.7 pmol/min/mg in brain microsomes of hUGT1 mice treated with CBZ.
Fig. 7.
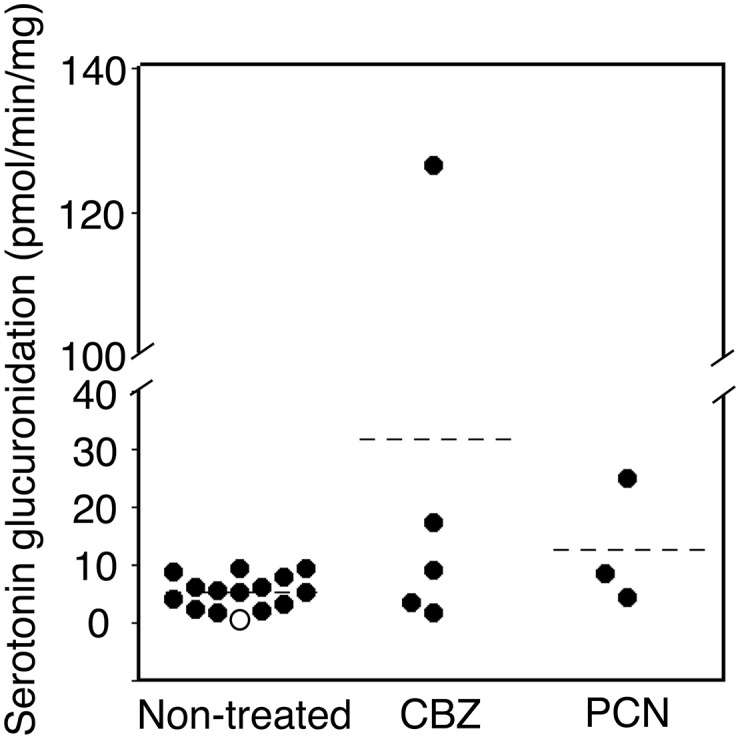
Effects of inducers treatments on UGT1A6 activity in the brain microsomes of hUGT1 mice. Microsomes from nontreated hUGT1 mice (n = 12) and inducers-treated hUGT1 mice (n > 3) were prepared, and serotonin glucuronide formation was measured. Open circle indicates the microsome samples that did not exhibit glucuronidation activity toward serotonin. Filled circles indicate the microsome samples that exhibited glucuronidation activity toward serotonin.
Discussion
CYP2D6, which is expressed in the human brain, can catalyze O-demethylation of 5-methoxytryptamine to generate serotonin (Yu et al., 2003). CYP2D6 has many polymorphisms associated with personality traits and neurologic or psychiatric disorders. A previous study showed that female CYP2D6 ultra-rapid metabolizers were more frequent among patients with eating disorders due to the alteration of brain serotonin concentration (Peñas-Lledó et al., 2012). This study indicated that enzymes capable of catalyzing the generation and elimination of endogenous compounds possibly regulate the local concentration and function of the endogenous compounds in the brain. In the present study, UGT1A1, 1A3, 1A6, and 1A10 were detected in human brain (Fig. 1). The brain microsomes of hUGT1 mice exhibited glucuronidation activities (Figs. 6 and 7), suggesting that the endogenous compounds that are substrates of these UGTs may be glucuronidated in human brain. Dopamine, which is highly glucuronidated by UGT1A10 (Itäaho et al., 2009), and thyroxine, which is highly glucuronidated by UGT1A1, 1A3, 1A8, and 1A10 (Tong et al., 2007), might be glucuronidated by brain UGTs. Moreover, as the region- and age-dependent differences in expression levels of brain UGT1A1 and 1A6 were observed in hUGT1 mice (Figs. 2 and 3), UGTs in the brain may be involved in the regulation of the concentration and functions of endogenous compounds in a region- and age-dependent manner.
PCN significantly induced UGT1A1 and UGT1A6 mRNA in the liver (Fig. 4, A and C). In the brain, however, such induction was not observed (Fig. 4, B and D). The glucuronidation activities of UGT1A1 and UGT1A6 were not induced by the PCN treatment (Figs. 6 and 7), which was in agreement with our quantitative RT-PCR data (Fig. 4). Although PCN induced the expression of Cyp3a11 in the liver, it did not induce the gene in the brain (Fig. 5B). Previously, Lamba et al. (2004) reported that PXR was not expressed in human brain regions such as the cerebral cortex and cerebellum, except for the thalamus. These data indicate that PXR might not be functional in the brain. In contrast, CBZ-treated mice showed slightly higher UGT1A1 and UGT1A6 activities in brain microsomes compared with the control hUGT1 mice (Figs. 6 and 7), although this was not statistically significant. This finding indicates that constitutive androstane receptor activators such as CBZ might increase UGT expressions and activities to affect the function of endogenous compounds in the brain. Developmental disorders have been reported in infants who were born from CBZ-administered mothers (Ornoy and Cohen, 1996). Thyroxine is very important in the development of the brain (Dussault and Ruel, 1987). Administered CBZ could be distributed to the infant’s brain to induce brain UGTs. Therefore, the reported developmental disorders might have been attributed to a reduced brain thyroxine level, which could be caused by induced UGT functions.
A significant interindividual variability was observed in the responsiveness to a CYP3A inducer (Fig. 5B). Previously, liver biopsies were collected from 14 patients before and after rifampicin treatment (600 mg/day for 4 days) (Ged et al., 1989). After the rifampicin treatment, there was an 18-fold difference in the induction of CYP3A4 protein. The extent of increase ranged from 160 to 2900% among these patients, indicating that there could be a significant variability in the responsiveness to CYP3A inducers.
Additional discussion can be found online (Supplemental Discussion; Supplemental Fig. 3; Supplemental Table 1).
In the present study, we demonstrated that UGT1A1, 1A3, 1A6, and 1A10 were expressed in human brains. The expression pattern of UGT1As in human brains was similar to that in hUGT1 mouse brain, indicating that hUGT1 mice might be useful to study the importance of brain UGTs in vivo. The expression levels of UGT1A1 and 1A6 in hUGT1 mouse brains were different in a region- and age-dependent manner. Therefore, UGTs might play an important role in function regulation of endogenous compounds in a region- and age-dependent manner.
Supplementary Material
Abbreviations
- AS
antisense primer
- CBZ
carbamazepine
- CPH
cyclophilin
- HPLC
high-performance liquid chromatography
- hUGT1
humanized UGT1
- PCN
pregnenolone-16α-carbonitrile
- PXR
pregnane X receptor
- UGT
UDP-glucuronosyltransferase
Authorship Contributions
Participated in research design: Kutsuno, Itoh, Tukey, Fujiwara.
Conducted experiments: Kutsuno, Hirashima, Sakamoto, Ushikubo, Fujiwara.
Performed data analysis: Kutsuno, Hirashima, Michimae, Fujiwara.
Wrote or contributed to the writing of the manuscript: Kutsuno, Itoh, Tukey, Fujiwara.
Footnotes
This work was supported by a Grant-in-Aid for Encouragement of Young Scientists B to R.F. [Grant 26870562]. This work was also supported in part by the National Institutes of Health National Institute of Environmental Health Sciences [Grant P42-ES010337] and National Institute of General Medical Sciences [Grant R01-GM100481].
 This article has supplemental material available at dmd.aspetjournals.org.
References
- Al-Jahdari WS, Yamamoto K, Hiraoka H, Nakamura K, Goto F, Horiuchi R. (2006) Prediction of total propofol clearance based on enzyme activities in microsomes from human kidney and liver. Eur J Clin Pharmacol 62:527–533. [DOI] [PubMed] [Google Scholar]
- Aoshima N, Fujie Y, Itoh T, Tukey RH, Fujiwara R. (2014) Glucose induces intestinal human UDP-glucuronosyltransferase (UGT) 1A1 to prevent neonatal hyperbilirubinemia. Sci Rep 4:6343. [DOI] [PMC free article] [PubMed] [Google Scholar]
- Bradford MM. (1976) A rapid and sensitive method for the quantitation of microgram quantities of protein utilizing the principle of protein-dye binding. Anal Biochem 72:248–254. [DOI] [PubMed] [Google Scholar]
- Buckley DB, Klaassen CD. (2007) Tissue- and gender-specific mRNA expression of UDP-glucuronosyltransferases (UGTs) in mice. Drug Metab Dispos 35:121–127. [DOI] [PubMed] [Google Scholar]
- Court MH. (2005) Isoform-selective probe substrates for in vitro studies of human UDP-glucuronosyltransferases. Methods Enzymol 400:104–116. [DOI] [PubMed] [Google Scholar]
- Court MH, Zhang X, Ding X, Yee KK, Hesse LM, Finel M. (2012) Quantitative distribution of mRNAs encoding the 19 human UDP-glucuronosyltransferase enzymes in 26 adult and 3 fetal tissues. Xenobiotica 42:266–277. [DOI] [PubMed] [Google Scholar]
- de Leon J. (2003) Glucuronidation enzymes, genes and psychiatry. Int J Neuropsychopharmacol 6:57–72. [DOI] [PubMed] [Google Scholar]
- Dussault JH, Ruel J. (1987) Thyroid hormones and brain development. Annu Rev Physiol 49:321–334. [DOI] [PubMed] [Google Scholar]
- Dutton GJ. (1980) Acceptor substrates of UDP glucuronosyltransferase and their assay, in Glucuronidation of Drugs and Other Compounds (Dutton GJ. ed) pp 69–78, CRC Press, Boca Raton, FL. [Google Scholar]
- Fujiwara R, Chen S, Karin M, Tukey RH. (2012) Reduced expression of UGT1A1 in intestines of humanized UGT1 mice via inactivation of NF-κB leads to hyperbilirubinemia. Gastroenterology 142:109–118, e2. [DOI] [PMC free article] [PubMed] [Google Scholar]
- Fujiwara R, Nguyen N, Chen S, Tukey RH. (2010) Developmental hyperbilirubinemia and CNS toxicity in mice humanized with the UDP glucuronosyltransferase 1 (UGT1) locus. Proc Natl Acad Sci USA 107:5024–5029. [DOI] [PMC free article] [PubMed] [Google Scholar]
- Ged C, Rouillon JM, Pichard L, Combalbert J, Bressot N, Bories P, Michel H, Beaune P, Maurel P. (1989) The increase in urinary excretion of 6 beta-hydroxycortisol as a marker of human hepatic cytochrome P450IIIA induction. Br J Clin Pharmacol 28:373–387. [DOI] [PMC free article] [PubMed] [Google Scholar]
- Gross C, Zhuang X, Stark K, Ramboz S, Oosting R, Kirby L, Santarelli L, Beck S, Hen R. (2002) Serotonin1A receptor acts during development to establish normal anxiety-like behaviour in the adult. Nature 416:396–400. [DOI] [PubMed] [Google Scholar]
- Hewitt NJ, Lecluyse EL, Ferguson SS. (2007) Induction of hepatic cytochrome P450 enzymes: methods, mechanisms, recommendations, and in vitro-in vivo correlations. Xenobiotica 37:1196–1224. [DOI] [PubMed] [Google Scholar]
- Itäaho K, Court MH, Uutela P, Kostiainen R, Radominska-Pandya A, Finel M. (2009) Dopamine is a low-affinity and high-specificity substrate for the human UDP-glucuronosyltransferase 1A10. Drug Metab Dispos 37:768–775. [DOI] [PMC free article] [PubMed] [Google Scholar]
- Izukawa T, Nakajima M, Fujiwara R, Yamanaka H, Fukami T, Takamiya M, Aoki Y, Ikushiro S, Sakaki T, Yokoi T. (2009) Quantitative analysis of UDP-glucuronosyltransferase (UGT) 1A and UGT2B expression levels in human livers. Drug Metab Dispos 37:1759–1768. [DOI] [PubMed] [Google Scholar]
- King CD, Rios GR, Assouline JA, Tephly TR. (1999) Expression of UDP-glucuronosyltransferases (UGTs) 2B7 and 1A6 in the human brain and identification of 5-hydroxytryptamine as a substrate. Arch Biochem Biophys 365:156–162. [DOI] [PubMed] [Google Scholar]
- Krishnaswamy S, Duan SX, Von Moltke LL, Greenblatt DJ, Court MH. (2003) Validation of serotonin (5-hydroxtryptamine) as an in vitro substrate probe for human UDP-glucuronosyltransferase (UGT) 1A6. Drug Metab Dispos 31:133–139. [DOI] [PubMed] [Google Scholar]
- Kutsuno Y, Itoh T, Tukey RH, Fujiwara R. (2014) Glucuronidation of drugs and drug-induced toxicity in humanized UDP-glucuronosyltransferase 1 mice. Drug Metab Dispos 42:1146–1152. [DOI] [PMC free article] [PubMed] [Google Scholar]
- Kutsuno Y, Sumida K, Itoh T, Tukey RH, Fujiwara R. (2013) Glucuronidation of drugs in humanized UDP-glucuronosyltransferase 1 mice: Similarity with glucuronidation in human liver microsomes. Pharmacol Res Perspect 1:e00002. [DOI] [PMC free article] [PubMed] [Google Scholar]
- Lamba V, Yasuda K, Lamba JK, Assem M, Davila J, Strom S, Schuetz EG. (2004) PXR (NR1I2): splice variants in human tissues, including brain, and identification of neurosteroids and nicotine as PXR activators. Toxicol Appl Pharmacol 199:251–265. [DOI] [PubMed] [Google Scholar]
- Lee KH, Horiuchi M, Itoh T, Greenhalgh DG, Cho K. (2011) Cerebellum-specific and age-dependent expression of an endogenous retrovirus with intact coding potential. Retrovirology 8:82. [DOI] [PMC free article] [PubMed] [Google Scholar]
- Mackenzie PI, Bock KW, Burchell B, Guillemette C, Ikushiro S, Iyanagi T, Miners JO, Owens IS, Nebert DW. (2005) Nomenclature update for the mammalian UDP glycosyltransferase (UGT) gene superfamily. Pharmacogenet Genomics 15:677–685. [DOI] [PubMed] [Google Scholar]
- Miksys S, Rao Y, Sellers EM, Kwan M, Mendis D, Tyndale RF. (2000) Regional and cellular distribution of CYP2D subfamily members in rat brain. Xenobiotica 30:547–564. [DOI] [PubMed] [Google Scholar]
- Nakamura A, Nakajima M, Yamanaka H, Fujiwara R, Yokoi T. (2008) Expression of UGT1A and UGT2B mRNA in human normal tissues and various cell lines. Drug Metab Dispos 36:1461–1464. [DOI] [PubMed] [Google Scholar]
- Nozawa D, Suzuki N, Kobayashi-Osaki M, Pan X, Engel JD, Yamamoto M. (2009) GATA2-dependent and region-specific regulation of Gata2 transcription in the mouse midbrain. Genes Cells 14:569–582. [DOI] [PubMed] [Google Scholar]
- Ornoy A, Cohen E. (1996) Outcome of children born to epileptic mothers treated with carbamazepine during pregnancy. Arch Dis Child 75:517–520. [DOI] [PMC free article] [PubMed] [Google Scholar]
- Peñas-Lledó EM, Dorado P, Agüera Z, Gratacós M, Estivill X, Fernández-Aranda F, Llerena A. (2012) CYP2D6 polymorphism in patients with eating disorders. Pharmacogenomics J 12:173–175. [DOI] [PubMed] [Google Scholar]
- Ritter JK, Chen F, Sheen YY, Tran HM, Kimura S, Yeatman MT, Owens IS. (1992) A novel complex locus UGT1 encodes human bilirubin, phenol, and other UDP-glucuronosyltransferase isozymes with identical carboxyl termini. J Biol Chem 267:3257–3261. [PubMed] [Google Scholar]
- Sarkisyan G, Hedlund PB. (2009) The 5-HT7 receptor is involved in allocentric spatial memory information processing. Behav Brain Res 202:26–31. [DOI] [PMC free article] [PubMed] [Google Scholar]
- Shelby MK, Cherrington NJ, Vansell NR, Klaassen CD. (2003) Tissue mRNA expression of the rat UDP-glucuronosyltransferase gene family. Drug Metab Dispos 31:326–333. [DOI] [PubMed] [Google Scholar]
- Shibuya A, Itoh T, Tukey RH, Fujiwara R. (2013) Impact of fatty acids on human UDP-glucuronosyltransferase 1A1 activity and its expression in neonatal hyperbilirubinemia. Sci Rep 3:2903. [DOI] [PMC free article] [PubMed] [Google Scholar]
- Sakamoto M, Itoh T, Tukey RH, Fujiwara R. (2015) Nicotine regulates the expression of UDP-glucuronosyltransferase (UGT) in humanized UGT1 mouse brain. Drug Metab Pharmacokinet (in press). doi:10.1016/j.dmpk.2015.04.004 [DOI] [PMC free article] [PubMed] [Google Scholar]
- Sumida K, Kawana M, Kouno E, Itoh T, Takano S, Narawa T, Tukey RH, Fujiwara R. (2013) Importance of UDP-glucuronosyltransferase 1A1 expression in skin and its induction by UVB in neonatal hyperbilirubinemia. Mol Pharmacol 84:679–686. [DOI] [PMC free article] [PubMed] [Google Scholar]
- Tong Z, Li H, Goljer I, McConnell O, Chandrasekaran A. (2007) In vitro glucuronidation of thyroxine and triiodothyronine by liver microsomes and recombinant human UDP-glucuronosyltransferases. Drug Metab Dispos 35:2203–2210. [DOI] [PubMed] [Google Scholar]
- Trouillas P. (1993) The cerebellar serotoninergic system and its possible involvement in cerebellar ataxia. Can J Neurol Sci 20 (Suppl 3):S78–S82. [DOI] [PubMed] [Google Scholar]
- Tukey RH, Strassburg CP. (2000) Human UDP-glucuronosyltransferases: metabolism, expression, and disease. Annu Rev Pharmacol Toxicol 40:581–616. [DOI] [PubMed] [Google Scholar]
- Uchaipichat V, Mackenzie PI, Guo XH, Gardner-Stephen D, Galetin A, Houston JB, Miners JO. (2004) Human udp-glucuronosyltransferases: isoform selectivity and kinetics of 4-methylumbelliferone and 1-naphthol glucuronidation, effects of organic solvents, and inhibition by diclofenac and probenecid. Drug Metab Dispos 32:413–423. [DOI] [PubMed] [Google Scholar]
- Viani A, Temellini A, Tusini G, Pacifici GM. (1990) Human brain sulphotransferase and glucuronyltransferase. Hum Exp Toxicol 9:65–69. [DOI] [PubMed] [Google Scholar]
- Wahlström A, Winblad B, Bixo M, Rane A. (1988) Human brain metabolism of morphine and naloxone. Pain 35:121–127. [DOI] [PubMed] [Google Scholar]
- Yu AM, Idle JR, Byrd LG, Krausz KW, Küpfer A, Gonzalez FJ. (2003) Regeneration of serotonin from 5-methoxytryptamine by polymorphic human CYP2D6. Pharmacogenetics 13:173–181. [DOI] [PubMed] [Google Scholar]
Associated Data
This section collects any data citations, data availability statements, or supplementary materials included in this article.