

Abstract
Metformin, the most widely prescribed antidiabetic drug, requires transporters to enter tissues involved in its pharmacologic action, including liver, kidney, and peripheral tissues. Organic cation transporter 3 (OCT3, SLC22A3), expressed ubiquitously, transports metformin, but its in vivo role in metformin response is not known. Using Oct3 knockout mice, the role of the transporter in metformin pharmacokinetics and pharmacodynamics was determined. After an intravenous dose of metformin, a 2-fold decrease in the apparent volume of distribution and clearance was observed in knockout compared with wild-type mice (P < 0.001), indicating an important role of OCT3 in tissue distribution and elimination of the drug. After oral doses, a significantly lower bioavailability was observed in knockout compared with wild-type mice (0.27 versus 0.58, P < 0.001). Importantly, metformin’s effect on the plasma glucose concentration-time curve was reduced in knockout compared with wild-type mice (12 versus 30% reduction, respectively, P < 0.05) along with its accumulation in skeletal muscle and adipose tissue (P < 0.05). Furthermore, the effect of metformin on phosphorylation of AMP activated protein kinase, and expression of glucose transporter type 4 was absent in the adipose tissue of Oct3−/− mice. Additional analysis revealed that an OCT3 3′ untranslated region variant was associated with reduced activity in luciferase assays and reduced response to metformin in 57 healthy volunteers. These findings suggest that OCT3 plays an important role in the absorption and elimination of metformin and that the transporter is a critical determinant of metformin bioavailability, clearance, and pharmacologic action.
Introduction
In 2012, approximately 20 million people in the United States had been diagnosed with type 2 diabetes mellitus, resulting in a substantial toll on health in the country (Centers for Disease Control and Prevention, 2014). Among the array of pharmacological agents aimed at the treatment of type 2 diabetes, the biguanide metformin is recommended for first-line oral therapy and is particularly beneficial for overweight diabetic patients (Boyle et al., 2010). Although metformin has been used for decades, its mechanism of action is not completely understood. However, the drug clearly reduces the rate of ATP synthesis and results in higher AMP/ATP ratios (Pernicova and Korbonits, 2014). One of the outcomes from the altered energy status of the cell is activation of AMP-activated protein kinase, AMPK. At least in part due to activation of AMPK, metformin decreases glucose output by the liver, which is widely considered to be the primary site of metformin action. In addition, the drug enhances glucose utilization in peripheral tissues, particularly skeletal muscle and adipose tissues (Kirpichnikov et al., 2002). These changes ultimately contribute to the therapeutic effect of metformin: improved insulin sensitivity and glycemic control.
Because of its low hydrophobicity, metformin requires membrane transporters to cross biologic membranes and enter and exit from cells. Previously, studies from our laboratory and others have shown that organic cation transporters 1 and 2, OCT1 (SLC22A1) and OCT2 (SLC22A2), transport metformin in the liver and kidney, respectively (Jonker et al., 2001, 2003; Wang et al., 2002; Chen et al., 2014). For example, in Oct1 knockout mice, the accumulation of metformin is significantly reduced in the liver compared with wild-type mice (Shu et al., 2007). Furthermore, healthy volunteers with reduced function variants of OCT1 exhibit reduced pharmacologic response to metformin compared to those with reference OCT1 (Shu et al., 2007). On the other hand, significantly altered systemic exposure and renal clearance were observed in healthy volunteers with genetic variants of OCT2 (Song et al., 2008; Chen et al., 2009). OCT2-mediated drug-drug interactions have also been described (Somogyi and Muirhead, 1987; Somogyi et al., 1987), although recent studies suggest that transporters in the multidrug and toxin extrusion protein family, MATE (SLC47A), play more important roles in these interactions. Because of their interactions with many drugs, OCT1 and OCT2 along with MATEs have been included in drug-drug interaction guidances from regulatory authorities in Europe and the U.S.
In contrast to our knowledge of OCT1 and OCT2, much less is known about the third member of the SLC22 family, OCT3. The transporter exhibits overlapping substrate specificity with OCT1 and OCT2 (Koepsell et al., 2003) and in particular is an excellent transporter for metformin. However, unlike OCT1 and OCT2, OCT3 is expressed ubiquitously in most tissues. Originally thought to be a major component of the extraneuronal monoamine transporter system, scavenging neurotransmitters that escaped reuptake in the central nervous system, OCT3 has been shown to play an important role in the homeostasis and neuropharmacology of monoamines (Zwart et al., 2001; Wultsch et al., 2009; Zhu et al., 2010; Horton et al., 2013). Although OCT3 is widely expressed in many tissues and has been shown to be the most highly expressed organic cation transporter in skeletal muscle and adipose tissue (Bleasby et al., 2006), little is known about its biologic or pharmacologic roles in peripheral tissues. A recent study shows that OCT3 is important in the salivary accumulation of metformin, suggesting that it plays a role in the taste-altering effects of the drug (Lee et al., 2014). In this study, we hypothesized that OCT3 plays a critical role in the pharmacologic response to the drug.
By using knockout mice, the role of OCT3 in the pharmacokinetics and pharmacodynamics of metformin was determined. In particular, the pharmacokinetic profiles and tissue accumulation of metformin were compared between wild-type and Oct3 knockout mice after intravenous and oral doses. The glucose lowering effect of metformin after an oral glucose tolerance test was investigated in the mice, and the role of OCT3 in metformin action in adipose tissues was further examined. Finally, the effect of OCT3 genetic polymorphisms on the pharmacologic effects of metformin was assessed in healthy volunteers.
Materials and Methods
Animals and Materials.
Oct3 knockout mice were generated as previously described in C57BL/6J background (Vialou et al., 2008), and wild-type mice were obtained from Jackson Laboratories (Bar Harbor, ME). Animal studies described here were conducted in male Oct3 knockout and wild-type mice (12–16 weeks old) and were reviewed and approved by University of California San Francisco Institutional Animal Care and Use Committee. Metformin and glucose were purchased from Sigma-Aldrich (St. Louis, MO). Cell culture media were purchased from Life Technologies (Carlsbad, CA). All other chemicals were commercially available.
Uptake Study.
The stably overexpressing human or mouse OCT3 (pcDNA5/FRT vector) cell lines were generated from HEK FlpIn-293 cells (Life Technologies) according to the manufacturer’s protocol. The cells were maintained in Dulbecco’s modified Eagle’s medium supplemented with 75 μg/ml of hygromycin B, penicillin (100 U/ml), streptomycin (100 mg/ml), and 10% fetal bovine serum. For the uptake studies, cells were cultured on poly-d-lysine–coated 24-well plates to 95% confluence. The cells were washed once with warm Hank’s balanced salt solution (HBSS) and then incubated in the uptake buffer with various concentration of unlabeled metformin and [14C]metformin (American Radiolabeled Chemicals, St. Louis, MO) in HBSS. The uptake was performed at 37°C for 3 minutes, then the cells were washed three times with ice-cold HBSS. The cells were lysed with lysis buffer containing 0.1 N NaOH and 0.1% SDS, and the radioactivity in the lysate was determined by liquid scintillation counting. The Km and Vmax were calculated by fitting the data to Michaelis-Menten equations using GraphPad Prism software (La Jolla, CA).
Real-Time Reverse Transcription Polymerase Chain Reaction Analysis of mRNA Level in Tissues.
Total RNA from various C57BL/6J mouse tissues was isolated using RNeasy Mini kit (Qiagen, Valencia, CA) according to the manufacturer’s protocol. Two micrograms of total RNA from each sample were reverse transcribed into cDNA using SuperScript VILO cDNA Synthesis kit (Life Technologies) according to the manufacturer’s protocol. Quantitative real-time polymerase chain reaction was carried out in 384-well reaction plates using 2X Taqman Fast Universal Master Mix (Applied Biosystems, Foster City, CA), 20X Taqman specific gene expression probes, and 10 ng of the cDNA template. The reactions were carried out on an Applied Biosystems 7500 Fast Real-Time Polymerase Chain Reaction System (Applied Biosystems). The relative expression level of each mRNA transcript was calculated by the comparative method (ΔΔCt method) normalized to the housekeeping gene glyceraldhyde-3-phosphate dehydrogenase (Gapdh).
Pharmacokinetic Study and Tissue Distribution of Metformin.
Mice were fasted for 16 hours and then given a dose of 50 mg/kg metformin in saline with 0.2 μCi/g of [14C]metformin via oral gavage or tail vein injection. Blood samples were collected at specific time points by tail bleeding into heparinized microhematocrit capillary tubes (Fisher Scientific, Waltham, MA). The capillary tubes were centrifuged to obtain the plasma portion. Mice were killed at the end of the study, and tissues were collected immediately. All tissues were weighed and homogenized in Solvable (PerkinElmer, Waltham, MA) overnight. The amount of metformin in tissue homogenates and plasma was measured by liquid scintillation counting. The pharmacokinetic parameters (Table 1) were obtained by fitting the raw data using a noncompartmental model with WinNonlin (Pharsight, Princeton, NJ).
TABLE 1.
Pharmacokinetic parameters of metformin in Oct3 knockout and wild-type mice
Oral bioavailability was obtained by dividing AUCoral by AUCIV. Each value represents the mean ± S.D. for four mice.
| Wild Type | Oct3 Knockout | |
|---|---|---|
| Intravenous Parameter | ||
| C0 (μg/ml) | 70.9 ± 11.7 | 148 ± 18.7** |
| AUC (min⋅μg/ml) | 2500 ± 257 | 5340 ± 775* |
| V (ml/kg) | 1480 ± 218 | 550 ± 60.3* |
| CL(ml/min per kg) | 18.6 ± 1.80 | 8.96 ± 0.85*** |
| Oral Parameter | ||
| Cmax (μg/ml) | 9.70 ± 0.77 | 11.2 ± 0.39 |
| AUC (min⋅μg/ml) | 1460 ± 184 | 1480 ± 44.5 |
| V/F (ml/kg) | 4240 ± 698 | 3670 ± 293 |
| CL/F (ml/min per kg) | 27.4 ± 2.25 | 28.0 ± 0.45 |
| F (AUC Oral/AUC IV) | 0.58 ± 0.09 | 0.27 ± 0.04 |
P < 0.05, **P < 0.01, ***P < 0.001, significantly different from wild-type mice.
Oral Glucose Tolerance Test.
Age-matched Oct3 knockout and wild-type mice were fasted overnight for 16 hours and then given saline via oral gavage followed by an oral dose of glucose (3 g/kg) 15 minutes later. Blood samples were collected at specific time points by tail bleeding, and blood glucose levels were measured with FreeStyle Lite glucometer (Abbott, Abbott Park, IL). Three days after the saline treatment, mice were fasted again for 16 hours and then given an oral dose of metformin (150 mg/kg) followed by an oral dose of glucose (3 g/kg) 15 minutes later. Blood samples and blood glucose levels were collected as described.
Western Blotting and Analysis.
Age-matched Oct3 knockout and wild-type mice (N = 3) were treated with metformin (100 mg/kg) or saline via intraperitoneal injection for 5 days. On day 5, mice were killed, and epididymal adipose tissues were collected. The tissues were lysed and homogenized with a tissue homogenizer in Cellytic MT buffer with complete mini protease inhibitor and PhosSTOP phosphatase inhibitor following the manufacturer’s protocol (Sigma-Aldrich; Roche Diagnostic, Indianapolis, IN). The tissue lysates from each group were combined and stored at −80°C. The proteins were separated on 4–20% SDS PAGE gels and transferred to PVDF membrane (Bio-Rad, Hercules, CA). The membranes were blocked overnight at 4°C with Tris-buffered saline containing 0.05% Tween 20 and 5% nonfat milk. Immunoblotting was performed following standard procedure, and signals were detected by ECL chemiluminescence reagent (GE healthcare, Piscataway, NJ). All antibodies used were purchased from Cell Signaling Technologies at manufacturer’s recommendation for dilution and incubation time (Danvers, MA). Quantification analysis was conducted with the ImageJ program (http://imagej.nih.gov/ij/) following the software manual.
Luciferase Reporter Assay.
The complete 3′ untranslated region (UTR) sequence of OCT3 was cloned into the multiple cloning site downstream of the firefly luciferase gene in the pmirGLO vector (Promega, Madison, WI). Single nucleotide polymorphisms were introduced into the reference sequence using site-directed mutagenesis with QuikChange kit (Stratagene, La Jolla, CA). HCT-116 and HepG2 cells were double transfected with pmirGLO containing OCT3 3′UTR sequence and pGL4.73 containing the Renilla luciferase gene using Lipofectamine 2000 (Life Technologies). After a 24-hour incubation period, luminescence from firefly and Renilla luciferase were measured according to manufacturer’s protocol (Promega) as previously described (Choi et al., 2011).
Association Analysis of 3′UTR Variant in OCT3 with Metformin Response.
Previously, we described the healthy human cohort that was used to determine the effects of functional variants on metformin disposition and response (Stocker et al., 2013). Using the same cohort, which has been genotyped using Illumina OmniExpress1.0 as described in our previous study (Goswami et al., 2014), we evaluated the effect of a functional OCT3 variant, rs2076828, on metformin disposition and response in healthy volunteers. Using the pharmacokinetic and pharmacodynamic parameters that have been ascertained previously, we determined the association of rs2076828 with (1) metformin plasma AUC (area under the curve), (2) metformin renal clearance, (3) metformin secretory clearance, and (4) metformin effects on oral glucose tolerance test as quantified by changes in area under the curve of plasma glucose between 0 and 2 hours after oral glucose administration. We used linear regression analysis to test the effect of the variant with each of the parameters above assuming an additive genetic effect.
Statistical Analysis.
Unless otherwise stated, statistical analysis was performed by Student’s t test to identify significant differences between various treatment groups. All experiments were conducted in several groups of knockout and wild-type mice with about 2 to 4 mice per strain in each treatment group. Experimental conditions such as dose or timing of sample collection were optimized in initial experiments. In experiments shown in the figures, we used age-matched knockout and wild-type mice with 4 mice per treatment group. The results of these experiments were confirmed in initial or subsequent studies in additional mice. Mean values are specified in the figure and table legends along with standard deviation.
Results
Murine OCT3 Transports Metformin and Is Expressed in Tissues Implicated in Metformin Action.
A previous study has shown that human OCT3 transports metformin and its missense variants affect metformin uptake in vitro (Chen et al., 2010). To understand whether murine OCT3 (mOCT3) plays a role in metformin pharmacokinetics and pharmacodynamics in vivo, we first determined the kinetics of metformin uptake by mOCT3 and the tissue distribution of Oct3 in mice. In cells stably transfected with Oct3 (HEK-mOCT3), the initial rate of metformin uptake increased with concentration and was saturable (Fig. 1A). Compared with kinetics of uptake in HEK cells overexpressing human OCT3, the kinetics of metformin uptake in HEK-mOCT3 exhibited a lower Km and a significantly higher Vmax (1.1 ± 0.1 versus 1.5 ± 0.2 mM and 67.0 ± 3.5 versus 10.7 ± 0.6 nmol/min per milligrams of protein; P < 0.01, respectively. Supplemental Fig. 1; Table 2). The kinetic parameters in mOCT3 cell lines are comparable to values obtained by Lee et al. (2014).
Fig. 1.

Characterization of the kinetics and tissue levels of mouse OCT3. (A) Overexpressing mouse OCT3 increases metformin uptake in HEK cells. Metformin uptake studies were conducted in HEK cells overexpressing mouse OCT3 (▪) or empty vector (⬤). Cells were incubated with increasing concentrations of metformin for 3 minutes. The uptake kinetic parameters (see Results) were calculated using the difference in accumulation between OCT3-overexpressing and empty vector cells. (B) Oct3 mRNA expression pattern was assessed in C57/B6J mice. The relative mRNA levels of Oct3 were determined by real-time polymerase chain reaction. The mRNA levels of Oct1, Oct2, and Oct3 were determined in the liver (C), kidney (D), skeletal muscle (E), and adipose tissue (F). Data represent mean ± S.D., n = 3 mice per group.
TABLE 2.
Kinetic parameter of metformin uptake in HEK293 cells expressing mouse and human OCT3
Km and Vmax values were determined from nonlinear regression fit of data from Fig. 1 and Supplemental Fig. 1. Data represent mean ± S.D., n = 3 replicates per data point.
| hOCT3 | mOCT3 | |
|---|---|---|
| Km (mM) | 1.5 ± 0.2 | 1.1 ± 0.1 |
| Vmax (nmol/mg protein per minute) | 10.7 ± 0.6 | 66.9 ± 3.5 |
To assess the expression pattern of Oct3 in C57BL/6 mice, the mRNA levels of Oct3 in tissues were determined by quantitative real-time PCR. As shown in Fig. 1B, Oct3 mRNA was detected in all tissues tested and at significantly higher levels in lung and adipose tissue compared with other tissues. Further analyses were performed in important tissues for metformin response, including the liver, kidney, skeletal muscle, and adipose tissue to compare the mRNA levels of Oct1, Oct2, and Oct3 (Fig. 1, C–F). In the skeletal muscle and the adipose tissue, Oct3 mRNA transcript levels were the highest among the three organic cation transporters. However, the mRNA levels of Oct3 were lower than the levels of Oct1 in the liver and both Oct1 and Oct2 in the kidney.
Metformin Pharmacokinetics and Tissue Accumulation Are Altered in Oct3 Knockout Mice.
The pharmacokinetics of metformin in wild-type and Oct3 knockout mice were evaluated after an intravenous bolus dose of 50 mg/kg via tail vein injection (Fig. 2A, Table 1). The plasma concentrations of metformin were significantly higher in knockout mice at five time points up to 60 minutes after dosing. The systemic exposure, AUC, was 2.1-fold higher in knockout mice compared with wild-type mice (5340 ± 775 min⋅μg⋅ml−1 in knockout mice versus 2500 ± 257 min⋅μg⋅ml−1 in wild-type mice, P < 0.001). Consistent with the significantly greater exposure, the systemic clearance of metformin was significantly lower in Oct3 knockout mice in comparison with their wild-type counterparts (8.96 ± 0.85 ml⋅min−1⋅kg−1 in knockout mice versus 18.6 ± 1.80 ml⋅min−1⋅kg−1 in wild-type mice, P < 0.001). In addition, Oct3 deletion modulated the distribution of metformin. In particular, the apparent volume of distribution (V) of metformin was substantially reduced in Oct3 knockout mice (550 ± 60.3 ml⋅kg−1 in knockout mice versus 1480 ± 218 ml⋅kg−1 in wild-type mice, P < 0.001). Consistent with its reduced volume of distribution, metformin tissue-to-plasma ratios (2 hours after intravenous dosing) were significantly lower in the liver and adipose tissue in knockout mice (Fig. 2B). However, the ratio was similar in the skeletal muscle between wild-type and knockout mice. Unexpectedly, Oct3 deletion resulted in a significantly higher tissue-to-plasma ratio of metformin in the kidney.
Fig. 2.

Oct3 deletion resulted in altered pharmacokinetics and tissue accumulation of metformin in mice. (A) The plasma metformin concentration-time profiles in wild-type (WT) and knockout (KO) mice after an intravenous dose (50 mg/kg metformin containing 0.2 mCi/kg [14C]metformin via tail vein). Significantly higher plasma concentrations were observed in knockout mice at 5, 10, 15, 30, 60 minutes after injection. (B–E) Tissue distribution of metformin in wild-type and knockout mice. Two hours after dosing, mice were killed and tissues were collected. Radioactivity in tissue homogenates were determined and converted to mass amounts. Tissue accumulation was significantly reduced in liver and adipose tissue of knockout mice. Metformin accumulation was higher in kidney of knockout mice. Data represent mean ± S.D., n = 4 mice per data points, *P < 0.05 wild-type versus knockout mice.
The pharmacokinetics of metformin after oral dosing was also studied in wild-type and Oct3 knockout mice (Fig. 3A; Table 1). After a bolus dose of 50 mg/kg of metformin via oral gavage, the plasma concentrations were not significantly different between wild-type and knockout mice when followed for 4 hours after dosing, although a trend for a higher Cmax was observed in the knockout mice. Oral exposure was not significantly different between wild-type and knockout mice. Interestingly, oral bioavailability calculated from the intravenous and oral AUC showed a 2.2-fold decrease in the knockout mice (0.27 ± 0.04 in knockout mice versus 0.58 ± 0.09 in wild-type mice, P < 0.001), suggesting that Oct3 contributes to metformin absorption. Tissue-to-plasma ratios were determined 4 hours after oral administration. The ratios in knockout mice were significantly lower in the liver, kidney, adipose tissue, and skeletal muscle (Fig. 3, B–F).
Fig. 3.

Oct3 deletion resulted in altered tissue accumulation of metformin after an oral dose. (A) The plasma metformin concentration-time profiles in wild-type (WT) and knockout (KO) mice after an oral dose (50 mg/kg metformin containing 0.2 mCi/kg [14C]metformin via oral gavage). Radioactivity in the plasma is determined and converted to mass amounts. (B–E) Tissue distribution of metformin in wild-type and knockout mice. Four hours after administration, mice were killed and tissues were collected. Radioactivity in tissue homogenates was determined and converted to mass amounts. Metformin accumulation was significantly reduced in liver, kidney, skeletal muscle, and adipose tissue of Oct3 knockout mice. Data represent mean ± S.D., n = 4 mice per data point, *P < 0.05, **P < 0.01, wild-type versus knockout mice.
The Effect of Metformin on Oral Glucose Tolerance Is Reduced in Oct3 Knockout Mice.
The glucose lowering effect of metformin after an oral glucose tolerance test was determined in wild-type and knockout mice. In wild-type mice, the effect of metformin was apparent, i.e., the drug significantly reduced blood glucose levels at various times (i.e., at 15, 30, 60, 90, and 120 minutes) after oral glucose administration (Fig. 4B). In contrast, although slight decreases in blood glucose levels were observed in knockout mice after metformin administration, the blood glucose levels were not significantly reduced at any of the time points tested (Fig. 4A). Oct3 deletion had no effect on baseline glucose tolerance because the blood glucose AUCs in saline treated groups were comparable between wild-type and knockout mice. On average, metformin significantly decreased glucose AUC in wild-type mice by 30% (18,600 ± 2080 mg⋅min⋅dl−1 in metformin-treated mice versus 26,000 ± 1450 mg⋅min⋅dl−1 in saline treated mice, P < 0.01). Although it did not reach significance, metformin on average decreased glucose AUC in knockout mice by 12%.
Fig. 4.

Oct3 deletion resulted in reduced pharmacologic effects of metformin. The blood glucose concentration-time profiles of knockout (KO) mice treated with metformin or saline (A) and wild-type (WT) mice treated with metformin or saline (B). Mice were given metformin (150 mg/kg) or saline orally followed by glucose (3 g/kg) orally after 15 minutes. Data represent mean ± S.D., n = 4 mice per data point, *P < 0.05 metformin-treated group versus saline treated group. (B–E) Tissue distribution of metformin in wild-type and knockout mice. Thirty minutes after metformin (150 mg/kg, p.o.), mice were killed and tissues were collected. Radioactivity in tissue homogenates were determined and converted to mass amounts. Data represent mean ± S.D., n = 4 mice per data point, *P < 0.05, **P < 0.01, wild-type versus knockout mice. (G) Representative Western blots of adipose tissues from knockout and wild-type mice treated with 100 mg/kg, i.p, metformin or saline for 5 days.
To investigate the mechanisms by which Oct3 deletion modulated the effect of metformin on oral glucose tolerance, tissue accumulation of metformin was determined 30 minutes after oral administration of metformin (150 mg/kg). Oct3 deletion clearly resulted in lower liver-to-plasma ratios of metformin at later times after both intravenous (Fig. 2B) and oral (Fig. 3B) doses. However at 30 minutes after a high oral dose of the drug (150 mg/kg), differences in hepatic uptake between wild-type and knockout mice were not apparent (Fig. 4C), possibly reflecting a lower contribution of the transporter to the hepatic uptake of metformin at these higher concentrations. On the other hand, tissue accumulation of metformin was significantly decreased in skeletal muscle and adipose tissue (Fig. 4, E and F). The effect was most prominent in the adipose tissue, where the absolute exposure was decreased by 3.2-fold. Decreased accumulation of metformin in the kidney was also observed at 30 minutes in knockout mice; however, it did not reach statistical significance (Fig. 4D). No significant differences were found in the intestinal accumulation of metformin between Oct3 knockout and wild-type mice (data not shown).
We performed further experimentation to understand the impact of reduced metformin accumulation in the adipose tissue on pharmacologic action. Wild-type and knockout mice were treated with intraperitoneal doses of metformin (100 mg/kg) for 5 days. On day 5, adipose tissues were collected, and selected proteins level and phosphorylation status were analyzed with Western blot (Fig. 4G). The phosphorylated AMPK/total AMPK ratios were significantly higher (1.6 times, P < 0.05) in wild-type mice treated with metformin compared with wild-type mice treated with saline, consistent with metformin’s known effects on AMPK (Supplemental Fig. 2A). The pAMPK/AMPK ratios were higher (1.2 times) in knockout mice treated with metformin compared with knockout mice treated with saline. However, the difference did not reach statistical significance. No difference was observed in total AMPK level among all groups of mice. The data shown in Supplemental Fig. 2A represent the mean ± S.D. of image analysis of Western blots performed in protein extracted from adipose tissue of three different mice in which metformin was dosed. Although attempts to measure GLUT4 levels on the plasma membrane were not successful, possibly due to the high fat content of adipocyte, the level of total GLUT4, a glucose transporter, was significantly increased (1.3 times, P < 0.05) in wild-type mice treated with metformin compared with wild-type mice treated with saline (Supplemental Fig. 2B). The total GLUT4 level was not significantly increased in the knockout mice treated with metformin. These data suggest that mOCT3 modulates the pharmacologic action of metformin on AMPK and GLUT4 in adipose tissue, and are consistent with the observed effects of metformin on oral glucose tolerance in wild-type and Oct3 knockout mice.
The OCT3 3′UTR Variant (C>G) in Healthy Human Volunteers Is Linked to Changes in Metformin Pharmacodynamics.
Luciferase assays were used to determine the effect of human genetic variants in the 3′UTR region of OCT3. The entire length of the 3′UTR region of OCT3 was cloned into a luciferase reporter vector. Single nucleotide polymorphisms (SNPs) were introduced into vectors, and vectors were then used to transfect human colorectal carcinoma cell line, HCT-116, human hepatocellular carcinoma cell line, HepG2, human prostate cancer cell line, DU145, and human lung carcinoma cell line, A549. Luciferase activity was used as a surrogate for gene expression level. Of 11 SNPs tested (data not shown), rs2076828 had an effect on luciferase activity, where the minor allele, G, exhibited significantly lower activity compared with the reference allele in HCT-116, DU145 cell lines (P < 0.01; Fig. 5A) and A549 cell line (P < 0.05). A similar trend was observed in HepG2 cell line, but the activity differences between the minor and major alleles did not reach statistical significance. The effect of the SNP on OCT3 expression level was confirmed in expression quantitative trait loci analysis from previously published data (Grundberg et al., 2012), where the mRNA level of OCT3 was significantly lower in adipose tissues of subjects with the minor allele (P < 0.01; Fig. 5B).
Fig. 5.
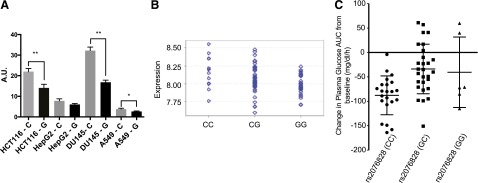
Functional characteristics of an OCT3 3′UTR variant (rs2076828) and its association with metformin pharmacologic response in healthy volunteers. The OCT3 3′UTR variant (C>G) in healthy human volunteers is associated with changes in metformin pharmacodynamics. (A) Luciferase reporter assay of rs2076828. Luciferase activity was significantly lower in HCT-116, DU145, and A549 cell lines transfected with a reporter construct containing the minor allele (G) compared with the reference allele (C). Data represent mean ± S.D., n = 3 replicates per cell line, *P < 0.05 and **P < 0.01. (B) E-QTL analysis of rs2076828 in healthy human cohorts revealed lower mRNA level of OCT3 in adipose tissues of subjects with the minor allele (G), P < 0.01. (C) The change in glucose exposure after an oral glucose tolerance test (AUC) after metformin treatment in healthy volunteers. Change in glucose AUC was calculated as glucose AUC after metformin dosing minus glucose AUC before metformin dosing. Healthy volunteers with the minor allele had lower response to metformin (P < 0.05). The dot plot displays the mean ± S.D.
We then analyzed the impact of rs2076828 on metformin pharmacokinetics and pharmacodynamics using previously published data from a healthy human cohort (N = 57) (Stocker et al., 2013). The variant had no significant effect on metformin pharmacokinetic parameters, even after adjusting for creatinine clearance, age, and gender (data not shown). However, analysis of pharmacodynamic data showed that the variant was associated with reduced response to metformin during oral glucose tolerance test in the healthy volunteers (Fig. 5C). The healthy volunteers with the minor G allele had significantly smaller changes in their glucose AUC (mean ± S.D.; CC, −88 ± 40 mg/dl per hour; CG, −34 ± 51 mg/dl per hour; GG, −41 ± 72 mg/dl per hour; one-way analysis of variance P < 0.001). We also noted that volunteers with the minor allele had significantly lower glucose AUC even before metformin dosing (mean ± S.D.; CC, 376 ± 62 mg/dl per hour; CG, 348 ± 55 mg/dl per hour; GG, 330 ± 41 mg/dl per hour; P < 0.05), suggesting an effect of OCT3 on baseline oral glucose tolerance. However, after adjusting for the difference in glucose AUC before metformin dosing, the linear regression analysis showed that the variant remained significantly associated with metformin response (P < 0.05).
Discussion
The major findings of this study are that mOCT3 modulates the pharmacokinetics and pharmacologic effects of metformin. In particular, Oct3 deletion in mice affected metformin absorption and clearance as well as its accumulation in tissues, notably skeletal muscle and adipose tissue. The decreased accumulation of metformin in these tissues may have accounted for the strikingly reduced effects of metformin on blood glucose levels after an oral glucose challenge in Oct3 knockout mice compared with wild-type mice. Consistent with our studies in mice, our analysis also showed that a reduced function genetic polymorphism in the 3′UTR of OCT3 was associated with decreased response to metformin in healthy volunteers. To the best of our knowledge, this is the first study that demonstrates a critical role of OCT3 in the bioavailability (F), clearance (CL), and pharmacodynamics of metformin.
Unlike many hydrophilic compounds that distribute primarily into body water spaces (Rowland and Tozer, 1995), the volume of distribution of metformin reported in the literature is large and variable (63–276L), consistent with extensive tissue accumulation (Graham et al., 2011). Because of its hydrophilicity, metformin requires transporters to cross plasma membranes and enter body tissues. Transporters implicated in metformin tissue distribution include OCT1, which is expressed primarily in the liver and OCT2, expressed largely in the kidney (Jonker et al., 2001, 2003). In addition, knockout mouse studies indicate that MATE1 plays an important role in renal and hepatic distribution of the drug (Tsuda et al., 2009). A recent study showing that OCT3 is involved in the salivary gland accumulation of metformin suggests that the transporter plays a role in the taste-altering effects of the drug (Lee et al., 2014).
In this study, we reaffirm the hypothesis that OCT3 is an important metformin transporter in vivo. The wide tissue distribution of OCT3 in mice (see Fig. 1B) including adipose tissue and skeletal muscle suggests a mechanism for tissue uptake of metformin. Indeed, after intravenous administration of the drug, Oct3 knockout mice exhibited a 2-fold reduction in V (Table 1), suggesting a lower overall tissue accumulation of metformin. The reduced tissue accumulation of metformin in the knockout mice was confirmed in the liver and adipose tissue collected 2 hours after intravenous administration (Fig. 2, B–D). In addition to its effect on metformin tissue distribution, Oct3 deletion also resulted in a notable reduction in metformin clearance (Table 1). Interestingly, there was a significant increase in the renal accumulation of metformin in the Oct3 knockout mice after the intravenous metformin dose (Fig. 2C). These data are similar to data obtained for metformin in Mate1 knockout mice; that is, there is increased renal accumulation of metformin in the kidney of the Mate1 knockout mice (Tsuda et al., 2009). Our parallel results suggest that similar to mouse MATE1, mOCT3 may act as an efflux transporter for the drug in the kidney.
In contrast to the striking differences in the pharmacokinetics of metformin after intravenous administration of the drug, no significant differences in AUC, CL/F, and V/F between knockout and wild-type mice were observed after oral administration (Table 1). Because AUC is determined by both oral bioavailability and systemic clearance, the data may be explained by an effect of Oct3 on both bioavailability and clearance. That is, Oct3 deletion results in a reduced clearance of metformin, as noted after intravenous doses (Table 1), and a reduced bioavailability of the drug. In particular, a mean oral bioavailability of 0.58 was estimated for the wild-type mice, a value that closely matches data from a previously published study (Higgins et al., 2012). In contrast, a mean oral bioavailability of 0.27 was estimated in knockout mice, suggesting that mOCT3 plays an important role in the absorption of metformin. In fact, OCT3 has been localized to the brush border membrane of the small intestine (Müller et al., 2005), consistent with a role in metformin absorption. The dual effects of Oct3 deletion on both bioavailability and clearance resulted in no apparent effect of gene deletion on AUC of metformin after oral administration of the drug.
Although no differences in the systemic plasma levels of metformin were observed after the oral dose, tissue levels of metformin were significantly lower in liver, kidney, adipose tissue, and muscle of the knockout mice in comparison with the wild-type mice (Fig. 3). Interestingly, in contrast to the higher kidney levels of metformin observed after the intravenous dose, renal accumulation of metformin was significantly lower in the Oct3 knockout mice in comparison with the wild-type mice after the oral dose. These differences may reflect kinetic differences, because tissue levels, which were measured at 4 hours after the oral dose, were substantially lower than those measured at 2 hours after the intravenous dose. Thus at low metformin levels, OCT3 may contribute primarily to renal uptake, whereas at high metformin levels, OCT3 may contribute to metformin efflux in the kidney.
Recently, Lee et al. (2014) published a study examining OCT3 tissue distribution in mice and the effect of Oct3 deletion in metformin pharmacokinetics and tissue distribution. Similar to our study, Lee et al. (2014) observed no statistically significant differences in metformin AUC, CL/F, and V/F between wild-type and knockout mice after oral administration. Although Lee et al. (2014) reported significant higher Cmax in knockout mice, the difference between knockout and wild-type mice did not reach statistical significance in our study potentially because different doses were used. Lee et al. (2014) administered 15 mg/kg, whereas we administered 50 mg/kg of metformin. Because of major differences in the experimental design, it is difficult to directly compare tissue distribution patterns of metformin between our study and that of Lee et al. (2014). In general, the skeletal muscle levels of metformin were significantly reduced in the Oct3 knockout mice in both studies. However, liver and kidney levels were reduced in our study but not in the study of Lee et al. (2014), possibly reflecting differences in the dose of metformin and the timing of tissue collection.
Several studies have used knockout mice to determine the role of membrane transporters in metformin disposition. However, few have used knockout mice to evaluate the impact of transporters on the therapeutic action of metformin. Shu et al. (2007) reported lowered fasting plasma glucose levels in wild-type but not Oct1 knockout mice after metformin treatment and suggested that reduced hepatic accumulation of metformin due to Oct1 deletion resulted in reduced effects on gluconeogenesis in the liver. In our study, metformin treatment significantly reduced blood glucose AUC after an oral glucose tolerance test in wild-type but not Oct3 knockout mice (Figs. 4, A and B), suggesting an important role for Oct3 in the glucose lowering effect of metformin. These differences could not be explained by differences in systemic plasma levels, because those were virtually identical in the knockout and wild-type mice (Fig. 3A). However, the differences could be explained by substantial differences in metformin levels in peripheral tissues that are sites of glucose uptake and utilization (adipose tissue and skeletal muscle) between wild-type and knockout mice (Fig. 4, E and F). Correspondingly, phosphorylated AMPK and expression levels of the insulin-sensitive glucose transporter, GLUT4, increased in response to metformin in wild-type mice, but with barely detectable increases in knockout mice (Fig. 4G). Taken together, our data suggest that OCT3 plays a major role in the uptake of metformin into adipose tissue, thereby modulating the therapeutic effect of metformin.
Based on our finding that mOCT3 played a role in metformin disposition and response, we hypothesized that functional genetic polymorphisms of SLC22A3 (OCT3) affect metformin disposition and response. We selected an OCT3 3′UTR variant for the association study because it exhibited reduced function in in vitro luciferase assays and was associated with expression level differences in OCT3 in expression quantitative trait loci analysis of adipose tissue (Grundberg et al., 2012). We observed that the minor allele G was associated with reduced response to metformin in healthy volunteers (Fig. 5C), consistent with lower OCT3 mRNA levels observed previously in adipose tissue (Grundberg et al., 2012) and lower luciferase activity in cell lines (Fig. 5A). The fact that we did not observe a significant effect of this 3′UTR variant on metformin disposition after oral doses is also consistent with our in vivo studies in the mice suggesting no effect of Oct3 deletion on the overall drug levels of metformin after oral administration. Collectively, the data in healthy volunteers support the findings in mice and indicate that OCT3 is an important determinant of metformin response. Similar to OCT1, OCT2, and MATEs (Jonker and Schinkel, 2004; Koepsell, 2004; Becker et al., 2009), our results suggest that OCT3 is an important site for drug-drug interactions and that future studies examining OCT3-mediated drug interactions with metformin should be performed.
In conclusion, this study demonstrates that murine OCT3 plays a critical role in the clearance and bioavailability of metformin as well as its accumulation in various tissues, notably skeletal muscle and adipose tissue. The transporter has route-dependent effects on the systemic plasma levels of metformin because of dual effects on the bioavailability and clearance of the drug. Importantly, our study shows that OCT3 plays a major role in the pharmacologic response to metformin in both mice and humans.
Supplementary Material
Acknowledgments
The authors thank Dr. Michiaki Kubo and his group at RIKEN Center for Integrative Medical Sciences (Yokohama, Japan).
Abbreviations
- AMPK
AMP activated protein kinase
- AUC
area under the concentration-time curve
- CL
clearance
- F
bioavailability
- HBSS
Hank’s balanced salt solution
- MATE
multidrug and toxin extrusion
- OCT
organic cation transporter
- SNP
single nucleotide polymorphism
- UTR
untranslated region
- V
apparent volume of distribution
Authorship Contributions
Participated in research design: E. C. Chen, L. Chen, Giacomini.
Conducted experiments: E. C. Chen, Liang, Stocker, Geier.
Performed data analysis: E. C. Chen, Liang, Yee, Giacomini.
Wrote or contributed to the writing of the manuscript: E. C. Chen, Liang, Yee, Geier, Giacomini.
Footnotes
>This work was supported by the National Institutes of Health National Institute of General Medical Sciences [Grant U19-GM61390] and the Burroughs Wellcome Fund Innovation in Regulatory Science Awards [Grant BWF ID 1012485]; E. C. Chen and X. Liang are supported in part by the National Institutes of Health Training Grant [Grant T32-GM007175]. The genotyping using the Illumina HumanOmniExpress array is supported by the National Institutes of Health Pharmacogenomics Research Network–RIKEN Global Alliance.
 This article has supplemental material available at molpharm.aspetjournals.org.
References
- Becker ML, Visser LE, van Schaik RHN, Hofman A, Uitterlinden AG, Stricker BHC. (2009) Genetic variation in the multidrug and toxin extrusion 1 transporter protein influences the glucose-lowering effect of metformin in patients with diabetes: a preliminary study. Diabetes 58:745–749. [DOI] [PMC free article] [PubMed] [Google Scholar]
- Bleasby K, Castle JC, Roberts CJ, Cheng C, Bailey WJ, Sina JF, Kulkarni AV, Hafey MJ, Evers R, Johnson JM, et al. (2006) Expression profiles of 50 xenobiotic transporter genes in humans and pre-clinical species: a resource for investigations into drug disposition. Xenobiotica 36:963–988. [DOI] [PubMed] [Google Scholar]
- Boyle JG, Salt IP, McKay GA. (2010) Metformin action on AMP-activated protein kinase: a translational research approach to understanding a potential new therapeutic target. Diabet Med 27:1097–1106. [DOI] [PubMed] [Google Scholar]
- Centers for Disease Control and Prevention (2014) National Diabetes Statistics Report: Estimates of Diabetes and Its Burden in the United States, 2014, US Department of Health and Human Services, Atlanta, GA. [Google Scholar]
- Chen L, Pawlikowski B, Schlessinger A, More SS, Stryke D, Johns SJ, Portman MA, Chen E, Ferrin TE, Sali A, et al. (2010) Role of organic cation transporter 3 (SLC22A3) and its missense variants in the pharmacologic action of metformin. Pharmacogenet Genomics 20:687–699. [DOI] [PMC free article] [PubMed] [Google Scholar]
- Chen L, Shu Y, Liang X, Chen EC, Yee SW, Zur AA, Li S, Xu L, Keshari KR, Lin MJ, et al. (2014) OCT1 is a high-capacity thiamine transporter that regulates hepatic steatosis and is a target of metformin. Proc Natl Acad Sci USA 111:9983–9988. [DOI] [PMC free article] [PubMed] [Google Scholar]
- Chen Y, Li S, Brown C, Cheatham S, Castro RA, Leabman MK, Urban TJ, Chen L, Yee SW, Choi JH, et al. (2009) Effect of genetic variation in the organic cation transporter 2 on the renal elimination of metformin. Pharmacogenet Genomics 19:497–504. [DOI] [PMC free article] [PubMed] [Google Scholar]
- Choi JH, Yee SW, Ramirez AH, Morrissey KM, Jang GH, Joski PJ, Mefford JA, Hesselson SE, Schlessinger A, Jenkins G, et al. (2011) A common 5′-UTR variant in MATE2-K is associated with poor response to metformin. Clin Pharmacol Ther 90:674–684. [DOI] [PMC free article] [PubMed] [Google Scholar]
- Goswami S, Yee SW, Stocker S, Mosley JD, Kubo M, Castro R, Mefford JA, Wen C, Liang X, Witte J, et al. (2014) Genetic variants in transcription factors are associated with the pharmacokinetics and pharmacodynamics of metformin. Clin Pharmacol Ther 96:370–379. [DOI] [PMC free article] [PubMed] [Google Scholar]
- Graham GG, Punt J, Arora M, Day RO, Doogue MP, Duong JK, Furlong TJ, Greenfield JR, Greenup LC, Kirkpatrick CM, et al. (2011) Clinical pharmacokinetics of metformin. Clin Pharmacokinet 50:81–98. [DOI] [PubMed] [Google Scholar]
- Grundberg E, Small KS, Hedman ÅK, Nica AC, Buil A, Keildson S, Bell JT, Yang T-P, Meduri E, Barrett A, et al. Multiple Tissue Human Expression Resource (MuTHER) Consortium (2012) Mapping cis- and trans-regulatory effects across multiple tissues in twins. Nat Genet 44:1084–1089. [DOI] [PMC free article] [PubMed] [Google Scholar]
- Higgins JW, Bedwell DW, Zamek-Gliszczynski MJ. (2012) Ablation of both organic cation transporter (OCT)1 and OCT2 alters metformin pharmacokinetics but has no effect on tissue drug exposure and pharmacodynamics. Drug Metab Dispos 40:1170–1177. [DOI] [PubMed] [Google Scholar]
- Horton RE, Apple DM, Owens WA, Baganz NL, Cano S, Mitchell NC, Vitela M, Gould GG, Koek W, Daws LC. (2013) Decynium-22 enhances SSRI-induced antidepressant-like effects in mice: uncovering novel targets to treat depression. J Neurosci 33:10534–10543. [DOI] [PMC free article] [PubMed] [Google Scholar]
- Jonker JW, Schinkel AH. (2004) Pharmacological and physiological functions of the polyspecific organic cation transporters: OCT1, 2, and 3 (SLC22A1-3). J Pharmacol Exp Ther 308:2–9. [DOI] [PubMed] [Google Scholar]
- Jonker JW, Wagenaar E, Mol CA, Buitelaar M, Koepsell H, Smit JW, Schinkel AH. (2001) Reduced hepatic uptake and intestinal excretion of organic cations in mice with a targeted disruption of the organic cation transporter 1 (Oct1 [Slc22a1]) gene. Mol Cell Biol 21:5471–5477. [DOI] [PMC free article] [PubMed] [Google Scholar]
- Jonker JW, Wagenaar E, Van Eijl S, Schinkel AH. (2003) Deficiency in the organic cation transporters 1 and 2 (Oct1/Oct2 [Slc22a1/Slc22a2]) in mice abolishes renal secretion of organic cations. Mol Cell Biol 23:7902–7908. [DOI] [PMC free article] [PubMed] [Google Scholar]
- Kirpichnikov D, McFarlane SI, Sowers JR. (2002) Metformin: an update. Ann Intern Med 137:25–33. [DOI] [PubMed] [Google Scholar]
- Koepsell H. (2004) Polyspecific organic cation transporters: their functions and interactions with drugs. Trends Pharmacol Sci 25:375–381. [DOI] [PubMed] [Google Scholar]
- Koepsell H, Schmitt BM, Gorboulev V. (2003) Organic cation transporters. Rev Physiol Biochem Pharmacol 150:36–90. [DOI] [PubMed] [Google Scholar]
- Lee N, Duan H, Hebert MF, Liang CJ, Rice KM, Wang J. (2014) Taste of a pill: organic cation transporter-3 (OCT3) mediates metformin accumulation and secretion in salivary glands. J Biol Chem 289:27055–27064. [DOI] [PMC free article] [PubMed] [Google Scholar]
- Müller J, Lips KS, Metzner L, Neubert RHH, Koepsell H, Brandsch M. (2005) Drug specificity and intestinal membrane localization of human organic cation transporters (OCT). Biochem Pharmacol 70:1851–1860. [DOI] [PubMed] [Google Scholar]
- Pernicova I, Korbonits M. (2014) Metformin—mode of action and clinical implications for diabetes and cancer. Nat Rev Endocrinol 10:143–156. [DOI] [PubMed] [Google Scholar]
- Rowland M, Tozer TN. (1995) Clinical Pharmacokinetics and Pharmacodynamics Concepts and Applications, 4th ed Wolters Kluwer Health/Lippincott William & Wilkins, Philadelphia, PA. [Google Scholar]
- Shu Y, Sheardown SA, Brown C, Owen RP, Zhang S, Castro RA, Ianculescu AG, Yue L, Lo JC, Burchard EG, et al. (2007) Effect of genetic variation in the organic cation transporter 1 (OCT1) on metformin action. J Clin Invest 117:1422–1431. [DOI] [PMC free article] [PubMed] [Google Scholar]
- Somogyi A, Muirhead M. (1987) Pharmacokinetic interactions of cimetidine 1987. Clin Pharmacokinet 12:321–366. [DOI] [PubMed] [Google Scholar]
- Somogyi A, Stockley C, Keal J, Rolan P, Bochner F. (1987) Reduction of metformin renal tubular secretion by cimetidine in man. Br J Clin Pharmacol 23:545–551. [DOI] [PMC free article] [PubMed] [Google Scholar]
- Song IS, Shin HJ, Shim EJ, Jung IS, Kim WY, Shon JH, Shin JG. (2008) Genetic variants of the organic cation transporter 2 influence the disposition of metformin. Clin Pharmacol Ther 84:559–562. [DOI] [PubMed] [Google Scholar]
- Stocker SL, Morrissey KM, Yee SW, Castro RA, Xu L, Dahlin A, Ramirez AH, Roden DM, Wilke RA, McCarty CA, et al. (2013) The effect of novel promoter variants in MATE1 and MATE2 on the pharmacokinetics and pharmacodynamics of metformin. Clin Pharmacol Ther 93:186–194. [DOI] [PMC free article] [PubMed] [Google Scholar]
- Tsuda M, Terada T, Mizuno T, Katsura T, Shimakura J, Inui K. (2009) Targeted disruption of the multidrug and toxin extrusion 1 (mate1) gene in mice reduces renal secretion of metformin. Mol Pharmacol 75:1280–1286. [DOI] [PubMed] [Google Scholar]
- Vialou V, Balasse L, Callebert J, Launay J-M, Giros B, Gautron S. (2008) Altered aminergic neurotransmission in the brain of organic cation transporter 3-deficient mice. J Neurochem 106:1471–1482. [DOI] [PubMed] [Google Scholar]
- Wang DS, Jonker JW, Kato Y, Kusuhara H, Schinkel AH, Sugiyama Y. (2002) Involvement of organic cation transporter 1 in hepatic and intestinal distribution of metformin. J Pharmacol Exp Ther 302:510–515. [DOI] [PubMed] [Google Scholar]
- Wultsch T, Grimberg G, Schmitt A, Painsipp E, Wetzstein H, Breitenkamp AFS, Gründemann D, Schömig E, Lesch K-P, Gerlach M, et al. (2009) Decreased anxiety in mice lacking the organic cation transporter 3. J Neural Transm 116:689–697. [DOI] [PubMed] [Google Scholar]
- Zhu H-J, Appel DI, Gründemann D, Markowitz JS. (2010) Interaction of organic cation transporter 3 (SLC22A3) and amphetamine. J Neurochem 114:142–149. [DOI] [PMC free article] [PubMed] [Google Scholar]
- Zwart R, Verhaagh S, Buitelaar M, Popp-Snijders C, Barlow DP. (2001) Impaired activity of the extraneuronal monoamine transporter system known as uptake-2 in Orct3/Slc22a3-deficient mice. Mol Cell Biol 21:4188–4196 Am Soc Microbiol. [DOI] [PMC free article] [PubMed] [Google Scholar]
Associated Data
This section collects any data citations, data availability statements, or supplementary materials included in this article.