

Abstract
Daily administration (q24h) of raltegravir has been shown to be as efficacious as twice-daily administration (q12h) in the hollow-fiber infection model (HFIM) system. However, q24h regimens were not noninferior to q12h dosing in a clinical trial. We hypothesized that between-patient variability in raltegravir pharmacokinetics (PK) was responsible for the discordance in conclusions between the in vitro and in vivo studies. Hollow-fiber cartridges were inoculated with HIV-infected H9 cells and uninfected CEM-SS cells. Four cartridges received the total daily exposure (800 mg) q24h and four received half the daily exposure (400 mg) q12h. PK profiles with half-lives of 8, 4, 3, and 2 h were simulated for each dosing interval. Cell-to-cell viral spread was assessed by flow cytometry. Viral inhibition was similar between q24h and q12h dosing at the 8- and 4-h half-lives. The q24h dosing was not as efficacious as the q12h dosing when faster half-lives were simulated; a lack of viral suppression was observed at days 3 and 4 for the 2- and 3-h half-lives, respectively. The discrepancy in conclusions between the in vitro HFIM system studies and clinical trials is likely due to the large interindividual variation in raltegravir PK.
INTRODUCTION
Raltegravir is an HIV-1 integrase inhibitor that is used in combination with other antiretroviral agents to treat patients with HIV-1 infections. Raltegravir-based combination chemotherapeutic regimens have been shown to be well tolerated and highly efficacious in both treatment-naive (1–5) and treatment-experienced (6–8) patient populations compared to other combination regimens. Raltegravir is currently administered as a 400-mg twice-daily (BID) dose. A once-daily (QD) raltegravir regimen would be preferable in a clinical setting, since the convenience of a QD regimen would likely improve patient adherence.
Previous work done by others has shown that, once bound, raltegravir remains in the active site of the HIV-1 integrase protein for a long time, demonstrating dissociative half-lives ranging from 7.3 to 8.8 h (9, 10). The long occupancy time of raltegravir in the binding pocket of viral integrase suggests that once-daily dosing (800 mg QD) may be as efficacious as the current regimen of 400 mg BID. Moreover, data generated using an in vitro pharmacodynamic (PD) hollow-fiber infection model (HFIM) system supported this speculation (11). Given the strong in vitro support of once-daily dosing, Merck conducted a phase 3 noninferiority trial to compare the efficacy of raltegravir administered as 800 mg QD to the standard dosage regimen of 400 mg BID. The findings of this clinical study showed that both regimens yielded high response rates in vivo, but once-daily dosing did not achieve the −10% noninferiority margin and was deemed not noninferior to the twice-daily regimen (12). Our objectives for this study were to explain the discordance in conclusions between the in vitro experiments and human clinical studies for raltegravir and to identify the pharmacokinetic-pharmacodynamic (PK-PD) determinants for raltegravir that allow for once-daily dosing.
(Parts of this work were presented in a preconference workshop at the 53rd Interscience Conference on Antimicrobial Agents and Chemotherapy, Denver, CO, 2013.)
MATERIALS AND METHODS
Cells and viruses.
Human T lymphoblast CEM-SS and H9 cell lines were acquired from the NIH AIDS Research and Reference Reagent Program, Division of AIDS, NIAID, NIH. Cell lines were maintained in cell growth medium (RPMI 1640 medium; HyClone, Logan, UT) supplemented with 10% fetal bovine serum (HyClone), 2.0 mM l-glutamine, and 1% penicillin-streptomycin solution (HyClone).
Proviral DNA for the HIV-1 IIIB strain was provided by Merck, Inc. (West Point, PA). Viral stocks were prepared as previously described (13). Briefly, human kidney 293T cells (ATCC, Manassas, VA) were transfected with the IIIB proviral DNA and incubated for 3 days at 37°C in 5% CO2. Cell supernatants were collected, centrifuged at 4,000 × g for 10 min to remove cell debris, aliquoted, and frozen at −80°C.
Compound.
Raltegravir was provided by Merck, Inc. Drug stocks of 10 mg/ml were prepared in sterile double-distilled water, sterilized through a 0.2-μm filter, aliquoted, and stored at −80°C.
Flow cytometry assay of HIV-infected cells.
Cells were fixed and permeabilized using the IntraPrep permeabilization reagent kit (Beckman Coulter, Miami, FL). A fluorescein isothiocyanate (FITC)-labeled monoclonal antibody to the HIV-1 p24 core antigen (KC-57 monoclonal antibody; Beckman Coulter) was added to the permeabilized cells and allowed to incubate at room temperature for 15 min in the dark. Unbound antibody was removed by centrifugation at 400 × g, and the percentage of FITC-positive cells was ascertained using the Cytomics FC 500 flow cytometry system (Beckman Coulter).
Dose-ranging studies in the HFIM system.
The HFIM system has been extensively described elsewhere (14–16). For these studies, H9 cells were infected with the IIIB strain of HIV-1 by incubating viral stocks with H9 cells for 1 week. Briefly, H9 cells were infected by mixing 106 cells with a 1:2 dilution of the virus stock in cell growth medium. Cell infections were carried out in a volume of 0.5 ml for 2 h at 37°C with 5% CO2. After 2 h of incubation, cells were washed with cell growth medium, resuspended in 10 ml of complete medium, and placed into a T-25 flask. T-25 flasks were incubated at 37°C with 5% CO2 for 3 days. After the third day, the cells were diluted into new T-25 flasks at a 1:10 ratio to maintain active cell growth. After 7 days in tissue culture, the cells were inoculated into the HFIM system. At the time of inoculation, the H9 cells were ∼50% infected. A total of 106 H9 cells infected with IIIB virus were mixed with 108 uninfected CEM-SS cells and inoculated into the extracapillary space (ECS) of six polysulfone hollow-fiber cartridges (FiberCell Systems, Frederick, MD). Raltegravir was administered into five hollow-fiber cartridges as a continuous infusion at concentrations ranging from 1.5 to 24 ng/ml. One cartridge did not receive the drug and served as a no-treatment control. The ECS of each cartridge was sampled daily from both the left and right ports for 6 days. The percentage of HIV antigen-positive cells was determined by flow cytometry analysis. The effective 50% and 90% concentration (EC50 and EC90) values for raltegravir against the IIIB strain of HIV were calculated by fitting a four-parameter inhibitory sigmoid Emax model to the flow cytometry data generated from the dose-ranging study on day 4 (the day of peak viral infection in the no-treatment control experimental arm) using S-Adapt (version 1.56) software. Two independent dose-ranging studies were performed.
Dose fractionation studies.
Dose fractionation studies were performed as previously described (17, 18). Briefly, 106 H9 cells infected with IIIB were mixed with 108 uninfected CEM-SS cells and inoculated into the ECS of nine polysulfone hollow-fiber cartridges. The protein binding of raltegravir to human plasma proteins is ∼83% (19). In the HFIM system, only free-drug concentrations are simulated. Thus, raltegravir was delivered into eight of the hollow-fiber cartridges via programmable syringe pumps over a 1-h infusion to achieve a free-drug area under the concentration–time curve from 0 to 24 h (AUC0-24) that is associated with the mean free-drug clinical exposure of raltegravir (AUC0-24 = 1.98 mg · h/liter). Four cartridges received the total AUC0-24 exposure once daily (q24h), and four cartridges received half the daily AUC0-24 exposure twice daily (q12h). One cartridge did not receive drug and served as a no-treatment control. Raltegravir was removed from the HFIM system at rates to mimic half-lives of 8, 4, 3, and 2 h for each dosing interval. The PK-PD parameters for all experimental arms are shown in Table 1. Hollow-fiber cartridges were sampled daily from the left and right sampling ports for 7 days, and the percentage of p24 antigen-positive cells was determined by flow cytometry. Three independent dose fractionation studies were conducted.
TABLE 1.
PK parameters from dose fractionation studies in the HFIM system
| Simulated half-life (h) | Dosing interval | PK parameters at steady state |
|||
|---|---|---|---|---|---|
| AUC0-24a (mg · h/liter) | Cmax (mg/liter) | Trough (mg/liter) | T>EC90 (%)b,c | ||
| 8 | q24 | 1.967 | 0.187 | 0.025 | 100.0 |
| q12 | 1.930 | 0.124 | 0.049 | 100.0 | |
| 4 | q24 | 0.984 | 0.159 | 0.003 | 56.9 |
| q12 | 0.965 | 0.088 | 0.014 | 85.4 | |
| 3 | q24 | 0.738 | 0.153 | 0.001 | 42.8 |
| q12 | 0.724 | 0.080 | 0.007 | 61.8 | |
| 2 | q24 | 0.492 | 0.144 | 0.000 | 29.1 |
| q12 | 0.482 | 0.072 | 0.002 | 40.6 | |
Free drug AUC0-24.
T>EC90 for 24 h.
EC90 value for raltegravir against the IIIB strain of HIV was 0.018 mg/liter.
Pharmacokinetic analysis.
Medium from the central reservoir of each hollow-fiber system was sampled at various time points post-drug infusion during the first 48 h of the study. Samples were diluted with water and analyzed by high-pressure liquid chromatography (HPLC)-tandem mass spectrometry (LC-MS/MS; ABSciex, Foster City, CA) for raltegravir concentrations. The HPLC conditions were as follows: the column used was a Phenomenex Kinetex C18-XB (50 by 2.1 mm, 2.6-μm particle size), with a guard column; the mobile phases A and B were 2 mM ammonium acetate with 0.1% formic acid in water and 0.1% formic acid in methanol, respectively, and run in isocratic mode at 73% buffer B with a flow rate of 0.300 ml/min. Raltegravir concentrations were measured using MS/MS transition m/z 445 → m/z 109. The analysis run time was 3.00 min, and the target concentration range was 0.500 to 200 ng/ml (r2 = 0.998). Quality control samples (1, 10, and 100 ng/ml) had coefficients of variation (CVs) ranging from 5.5% to 11.1% and accuracy (percent recovery) values between 99.8% and 110.6%. All measured raltegravir concentrations from studies performed in the HFIM system were within 10% of the targeted values (data not shown), indicating that the desired PK profiles were achieved in the system.
Statistical analysis and simulation.
Area under the percentage of HIV antigen-positive cells–time curves (AUC%HIV+ cells) for the left and right hollow-fiber ports were calculated using Prism software version 6.01 (GraphPad Software, Inc., La Jolla, CA). An unpaired t test with Welch's correction (GraphPad Prism) was used to identify significant differences between AUC%HIV+ cells values. For PK-PD analyses of data generated from dose fractionation studies, the AUC%HIV+ cells for each regimen was graphed against Cmax/EC90, AUC/EC90, trough/EC90, and the percentage of time above EC90 (%T>EC90). An inhibitory sigmoid Emax model was fitted to the trough/EC90 and %T>EC90 data using GraphPad Prism software. PK simulations were conducted using a 5,000-subject Monte Carlo simulation with Adapt V software.
RESULTS
Susceptibility of IIIB HIV-1 to raltegravir in the HFIM system.
Dose-ranging studies were performed in the HFIM system to evaluate the antiviral activity of raltegravir against the IIIB strain of HIV. The IIIB virus spread efficiently from cell to cell in the HFIM system (Fig. 1). The percentage of HIV-infected cells rose steadily in the no-treatment control arm through day 4, peaking at 52.8%, and then sharply declined. This decline in the percentage of HIV-infected cells was due to the killing of infected cells by the virus and the lack of fresh target cells in the system to propagate the infection. Similar kinetics of spread were observed in the experimental arms receiving raltegravir therapy. Raltegravir inhibited cell-to-cell viral spread in a dose-dependent manner for up to 4 days. The highest concentration evaluated in this study (24 ng/ml) delayed viral spread but was unable to completely suppress it, as HIV-positive cell populations peaked at 23.7% on day 6. EC50 and EC90 values were calculated for raltegravir on day 4, the day of near-peak viral infection in the no-treatment control arm. The EC50 for raltegravir against the IIIB strain of HIV in the HFIM system was 7.43 ng/ml (95% confidence interval [CI], 6.756 to 8.098 ng/ml), and the EC90 value was 17.54 ng/ml (95% CI, 15.95 to 19.12 ng/ml). The EC50 and EC90 values were corrected for protein binding and were similar to values reported by others (20–22).
FIG 1.
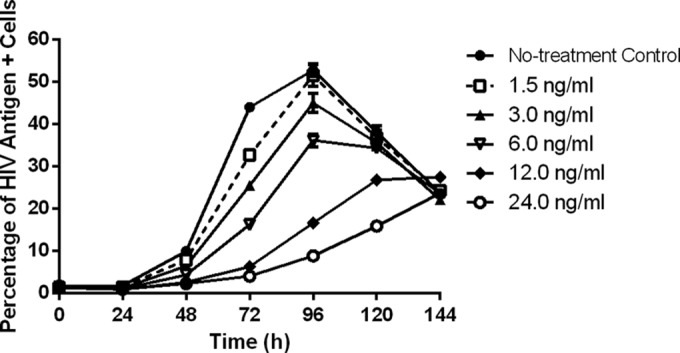
Dose-ranging studies with raltegravir against the IIIB strain of HIV-1 in the HFIM system. Raltegravir was administered into hollow-fiber cartridges as a continuous infusion at concentrations ranging from 0 to 24 ng/ml. Hollow-fiber cartridges were sampled from the left and right ports every 24 h for 144 h. Flow cytometry was performed daily on cells harvested from the HFIM system as described in Materials and Methods to determine the inhibitory effect of raltegravir on the cell-to-cell spread of HIV IIIB. Symbols, mean of two independent samples from the HFIM system; error bars = 1 SD. The data in the figure are representative of two independent dose-ranging experiments.
The influence of PK variability on the efficacy of the raltegravir dosing interval.
Dose fractionation studies were conducted in the HFIM system to identify the PD index that was best linked with viral suppression when various half-lives were simulated for raltegravir. All dosage regimens suppressed the cell-to-cell spread of HIV relative to the no-treatment control (Fig. 2A and B). Raltegravir administered q24h inhibited viral spread in a half-life–dependent manner, where the 8-h half-life provided the greatest viral inhibition and the 2-h half-life suppressed viral spread the least (Fig. 2A). In contrast, all q12h dosage regimens provided similar levels of viral suppression, with the exception of the 2-h half-life, which had higher percentages of HIV antigen-positive cells compared to the other regimens beginning at 120 h (Fig. 2B). AUC%HIV+ cells values were calculated for all therapeutic arms evaluated in the dose fractionation study (Table 2), and these values signified the degree of viral suppression for each dosage regimen relative to the no-treatment control. For the q24h dosing interval, the AUC%HIV+ cells values increased steadily as the raltegravir half-life changed from 4 h to 3 h to 2 h (Fig. 3A). The observed increase in AUC%HIV+ cells values was substantial between the 2- and 4-h half-lives, as the 2-h half-life yielded an AUC%HIV+ cells value that was ∼77% greater than that reported for the 4-h half-life. In contrast, the differences between AUC%HIV+ cells values for the 4- and 8-h half-lives were less dramatic at ∼26% (Fig. 3A). For the q12h dosing interval, AUC%HIV+ cells values were less variable with change in half-life (Fig. 3B), as maximal viral suppression was achieved at a 3-h half-life. Additionally, AUC%HIV+ cells values between the 2- and 8-h half-lives were only 38% different for the q12h regimen compared to the 122% difference in those values for the q24h regimen (Table 2).
FIG 2.
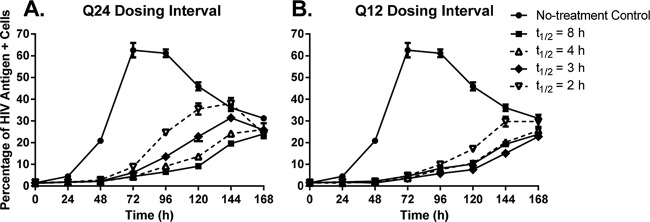
Dose fractionation studies with raltegravir against the IIIB strain of HIV-1 in the HFIM system. The free AUC0-24 exposure associated with the clinical dose of raltegravir was administered into hollow-fiber cartridges as a 1-h infusion at dosing intervals of q24h (A) or q12h (B) and washed out at specific rates to simulate half-lives of 8, 4, 3, and 2 h, as described in Materials and Methods. Hollow-fiber cartridges were sampled every 24 h for 168 h. Two independent samples were harvested from each cartridge via the left and right ports, and cells in the sample were evaluated for the HIV p24 antigen by flow cytometry. Symbols, mean of the two independent samples; error bars = 1 SD. The data in the figure are representative of three independent dose fractionation experiments.
TABLE 2.
Area under the percentage of HIV antigen-positive cells–time (from 0 to 168 h) curve for each dosage regimen evaluated in dose fractionation studies
| Simulated half-life of raltegravir (h) | AUC%HIV+ cells (% HIV antigen+ cells · h)a |
P value (q24 vs q12) | |
|---|---|---|---|
| q24 dosing interval | q12 dosing interval | ||
| 8 | 1,348 ± 61.5 | 1,413 ± 87.7 | 0.487 |
| 4 | 1,692 ± 119.5 | 1,409 ± 79.9 | 0.126 |
| 3 | 2,199 ± 108.2 | 1,139 ± 52.3 | 0.019 |
| 2 | 2,988 ± 169.7 | 1,944 ± 113.1 | 0.027 |
AUC%HIV+ cells values were generated from the flow cytometry data. They were calculated independently for samples harvested from the left and right sampling ports of each hollow-fiber cartridge. The means ± SD for the two AUC%HIV+ cells values are shown. The AUC%HIV+ cells value for the no-treatment control arm was 5,935 ± 196.6% HIV antigen+ cells · h.
FIG 3.

AUC%HIV+ cells as a function of the simulated half-life for raltegravir in the HFIM system. Raltegravir was administered into hollow-fiber cartridges as a 1-h infusion at dosing intervals of q24h (A) and q12h (B), and half-lives of 8, 4, 3, and 2 h were simulated for raltegravir in the HFIM system. Hollow-fiber cartridges were sampled every 24 h for 168 h. Two independent samples were harvested from each cartridge via the left and right ports, and cells in the sample were evaluated for the HIV p24 antigen by flow cytometry. AUC%HIV+ cells values were quantified by calculating the area under the percentage of HIV antigen-positive cells–time curve (Fig. 2) for each dosage regimen from the dose fractionation studies. The data in the figure are representative of three independent dose fractionation experiments.
We also compared the antiviral activities of the q24h and q12h dosing intervals for each half-life that was simulated for raltegravir in this study. The q24h and q12h dosage regimens achieved similar levels of viral suppression when half-lives of 8 and 4 h were simulated (Fig. 4A and B). The AUC%HIV+ cells values were not statistically significantly different between the q24h and q12h dosing intervals for the 8-h (P = 0.487) or 4-h (P = 0.126) half-life (Table 2). In contrast, the q12h dosing interval yielded the greatest inhibition of viral spread compared to the q24h dosing interval for the 3- and 2-h half-lives (Fig. 4C and D). Differences in the percentage of HIV-positive cells between the q24h and q12h regimens were first observed at 96 h for the 3-h half-life and at 72 h for the 2-h half-life. The AUC%HIV+ cells values between the q24h and q12h dosing intervals were significantly different for the 3-h half-life (P = 0.019, AUC%HIV+ cells values between q24h and q12h regimens) and the 2-h half-life (P = 0.027, AUC%HIV+ cells values between q24h and q12h regimens) (Table 2). These data show that q24h dosing for raltegravir is effective at half-lives of 8 and 4 h but not at half-lives of 3 and 2 h, which require q12h dosing for maximal antiviral activity.
FIG 4.

The effect of half-life on the efficacy of raltegravir dosing intervals. Raltegravir was administered into hollow-fiber cartridges as a 1-h infusion at dosing intervals of q24h and q12h. Half-lives of 8 h, 4 h, 3 h, and 2 h were simulated for raltegravir in the HFIM system. Hollow-fiber cartridges were sampled every 24 h for 168 h. Two independent samples were harvested from each cartridge via the left and right ports, and cells in the sample were evaluated for the HIV p24 antigen by flow cytometry. Symbols, mean of the two independent samples; error bars = 1 SD. The data in the figure are representative of three independent dose fractionation experiments.
PK-PD analysis of dose fractionation studies.
We graphed the AUC%HIV+ cells values calculated for each experimental arm in the dose fractionation studies against the PD indices Cmax (maximum concentration of drug in serum)/EC90, AUC/EC90, trough/EC90, and T>EC90. There was no observable correlation between Cmax/EC90 and raltegravir antiviral activity (Fig. 5A). The AUC/EC90 graph showed that the discordance in activity became greater as half-life became shorter, despite similar AUC/EC90 values between q24h and q12h dosing intervals for each half-life (Fig. 5B). An inhibitory sigmoid Emax model was not fitted to these data due to the clear separation between the q24h and q12h dosing intervals at the shorter half-lives, as two models would be more appropriate to fit the q24h and q12h dosing intervals individually. In contrast, there was a clear association between raltegravir antiviral activity and the PD indices trough/EC90 and %T>EC90 (Fig. 5C and D). It should be noted that T>EC90 and trough/EC90 map 1:1 until 100% T>EC90 is achieved. Trough/EC90 is not bound from above. sigmoid Emax models were fitted to these data, and the model fits are represented in the figures by a solid black line (Fig. 5C and D). The model fit the data well, yielding r2 values of 0.931 for trough/EC90 and 0.933 for %T>EC90. These data imply that raltegravir trough concentrations must be ≥3 ng/ml (adjusted for protein binding; equivalent to a total drug concentration of 17.65 ng/ml) or concentrations must be above the EC90 for at least 57% of a 24-h period in order for a dosage regimen to be therapeutically successful. In Fig. 5D, the lines connect the effects achieved by q12h versus q24h dosing for different half-lives.
FIG 5.

PK-PD analysis of raltegravir dose fractionation experiments. AUC%HIV+ cells values were calculated for each experimental arm evaluated in the dose fractionation studies. AUC%HIV+ cells were graphed against the PD indices of Cmax/EC90 (A), AUC/EC90 (B), trough/EC90 (C), and %T>EC90 (D). Each data point represents the mean AUC%HIV+ cells value calculated from samples harvested from the left and right sampling ports. Red symbols, no-treatment control; black symbols, q24h dosing interval; blue symbols, q12h dosing interval. A sigmoid Emax model was fitted to the data illustrated in the trough/EC90 and %T>EC90 graph, and the model fit is designated by the black curve. Blue lines connect the q24h and q12h dosing intervals for each half-life.
DISCUSSION
The main objective of this investigation was to explain the discordance in conclusions between experiments conducted in an in vitro setting and the clinical trial. Results from previous in vitro studies indicated that once-daily dosing was as efficacious as twice-daily dosing for raltegravir against HIV-1 in the HFIM system when a half-life of 9 h was simulated (11). However, these results were not validated in a human clinical trial. Although QD and BID dosing both yielded overall high response rates (83.2% for QD and 88.9% for BID) in a phase 3 noninferiority study conducted by Merck, the QD regimen failed to meet the −10% noninferiority margin (difference, −5.7%; 95% CI, −10.7 to −0.8) (12). The failure of the 800-mg QD dosage arm was attributed to lower trough values for raltegravir in these patients (23). Previous studies demonstrated that human PK profiles for raltegravir are characterized by a high degree of variability (19, 24, 25). To that end, we hypothesized that the success or failure of QD dosing for raltegravir is largely dependent on the PK profiles for the drug in patients.
Interpatient variability for raltegravir PK can be attributed to a variety of factors, including variations in absorption rate, bioavailability, volume of distribution, and clearance. For this study, we chose to simulate interpatient PK variability in the HFIM system by altering clearance (and thus half-life) for raltegravir. Results from the dose fractionation studies showed that raltegravir antiviral activity was similar between q24h and q12h dosing intervals when PK profiles with longer half-lives (smaller clearance values) were simulated, but more frequent dosing (shorter dosing intervals) was required to provide maximal viral suppression for PK profiles with shorter half-lives/larger clearance. These findings are similar to those reported for our previous work with the influenza antiviral zanamivir, in which we showed that the PD index linked to antiviral effect can change as a function of the PK parameters (e.g., shorter half-life/larger clearance driving a switch from AUC/EC90 to T>EC90) (26). PK-PD analyses revealed that trough/EC90 and %T>EC90 values correlated with antiviral efficacy. This finding was not surprising, since these two PD indices map one to one until 100% T>EC90 is achieved. Since maximal activity for raltegravir in this study was achieved at 57% T>EC90, it is not possible to definitively distinguish between trough/EC90 and %T>EC90 as the PD index linked with maximal virological response.
In order to determine the percentage of the population for which QD dosing would be efficacious, we ran a 5,000-patient simulation to estimate the proportion of patients that would exhibit raltegravir half-lives of <4 h, assuming a mean terminal half-life of 11 h and an interpatient CV of 61% for half-life (Matthew Rizk, Merck Research Laboratory, personal communication). Our simulations revealed that 93.4% of the population would exhibit half-lives that were ≥4 h, and 6.6% were <4 h. These data show that 6.6% of the total patient population is at risk of not achieving near-maximal viral suppression, suggesting that the daily raltegravir regimen is at a higher risk for failure in these patients. Interestingly, the difference in efficacy between the QD and BID raltegravir regimens in the phase 3 clinical trial was ∼6% (12), strikingly similar to our estimation of 6.6% for individuals who are predicted to exhibit shorter raltegravir half-lives (<4 h). Thus, our finding that failure of daily therapy was linked to the variability of raltegravir PK (i.e., shorter half-life/higher clearance) is a plausible explanation for the initial discordance in conclusions between the in vitro HFIM system studies and the human clinical trial.
A second factor needing consideration for the difference in conclusions between the in vitro and clinical trial lies with the endpoint used to describe therapeutic success. In the phase 3 trial, the endpoint was defined as achieving plasma HIV RNA levels that were <50 copies/ml. Patients with HIV RNA levels of >50 copies/ml after 48 weeks of therapy were classified as having virologic failure (12). Use of these criteria results in a purely dichotomous outcome, treatment is either successful or not successful. Patients might achieve a burden of 60 copies/ml and still be considered a failure. It is clear that the lower the viral burden, the less likely the emergence of viral resistance. However, it is reasonable that a rational index of viral effect for a regimen would be the absolute fall in viral burden from baseline.
The trial noted in a subgroup analysis that daily raltegravir also was not as efficacious in patients with a higher baseline viral burden (>100,000 copies/ml) (12). This is understandable. If the patient had a higher baseline viral burden and a shorter half-life, the near maximal viral effect achieved in this subgroup would have a lower likelihood of reaching the goal of <50 copies/ml and would be considered a virological failure.
A major benefit to the HFIM system is that PK parameters can be carefully controlled in an in vitro setting. The studies performed in this investigation showed that raltegravir concentrations must remain above the EC90 value for at least 57% of the time for a 24-h period or that free-drug trough concentrations must be >3 ng/ml in order to achieve maximal viral suppression. Raltegravir regimens with PK profiles in the HFIM system that did not achieve this standard, including the 3-h half-life q24 and the 2-h half-life q24 and q12 regimens, ultimately drove significantly less antiviral effect (Fig. 2 and 4). Considering only the %T>EC90 breakpoint for therapeutic success (T>EC90 of 57%), this value is reasonable when considering the long occupancy time of raltegravir in the integrase binding pocket. Raltegravir displays a dissociative half-life of ∼8 h (9, 10). These experiments were conducted under static conditions, meaning that raltegravir was allowed to bind to the viral integrase for a specified period before all traces of the drug were washed away. Following drug removal, the dissociation of raltegravir from the integrase was measured (9, 10). In the HFIM system, drug concentrations are not static, resulting in an always present but declining concentration of raltegravir throughout a 24-h period, with the rate of decline dependent on the half-life. This continuing but declining drug pressure impedes the dissociation of raltegravir from the integrase binding pocket, thereby elongating the dissociation half-life. In our study, regimens that yielded maximal viral suppression had raltegravir concentrations that were above the EC90 for ∼14 h (equivalent to 57% T>EC90 for a 24-h period). The constant drug pressure in the HFIM system likely produces a dissociation half-life that is >8 h, resulting in near-complete binding to the integrase active site for the entire 24-h period. Dosage regimens that do not achieve the 57% T>EC90 parameter allow for raltegravir dissociation from the viral integrase sometime during the 24-h period. Once the drug is unbound from the integrase, the virus can replicate freely and spread from cell to cell. For monitoring purposes, a therapeutic target would be to achieve free-drug trough/EC90 values approximating 0.5, as maximal antiviral effect was achieved when free-drug trough/EC90 values were at or above this level (Fig. 5C).
In summary, these studies suggest that patient PK profiles for raltegravir are likely to play a major role in the success or failure of QD regimens. Our findings indicate that the PD indices T>EC90 (percent of 24 h) and trough/EC90 are associated with optimal therapeutic outcomes for raltegravir when clearance variability is evaluated in vitro.
ACKNOWLEDGMENT
This work was supported by a grant from Merck Research Laboratories.
REFERENCES
- 1.Lennox JL, DeJesus E, Lazzarin A, Pollard RB, Madruga JV, Berger DS, Zhao J, Xu X, Williams-Diaz A, Rodgers AJ, Barnard RJ, Miller MD, DiNubile MJ, Nguyen BY, Leavitt R, Sklar P. 2009. Safety and efficacy of raltegravir-based versus efavirenz-based combination therapy in treatment-naive patients with HIV-1 infection: a multicentre, double-blind randomised controlled trial. Lancet 374:796–806. doi: 10.1016/S0140-6736(09)60918-1. [DOI] [PubMed] [Google Scholar]
- 2.Markowitz M, Morales-Ramirez JO, Nguyen BY, Kovacs CM, Steigbigel RT, Cooper DA, Liporace R, Schwartz R, Isaacs R, Gilde LR, Wenning L, Zhao J, Teppler H. 2006. Antiretroviral activity, pharmacokinetics, and tolerability of MK-0518, a novel inhibitor of HIV-1 integrase, dosed as monotherapy for 10 days in treatment-naive HIV-1-infected individuals. J Acquir Immune Defic Syndr 43:509–515. doi: 10.1097/QAI.0b013e31802b4956. [DOI] [PubMed] [Google Scholar]
- 3.Markowitz M, Nguyen BY, Gotuzzo E, Mendo F, Ratanasuwan W, Kovacs C, Prada G, Morales-Ramirez JO, Crumpacker CS, Isaacs RD, Gilde LR, Wan H, Miller MD, Wenning LA, Teppler H. 2007. Rapid and durable antiretroviral effect of the HIV-1 integrase inhibitor raltegravir as part of combination therapy in treatment-naive patients with HIV-1 infection: results of a 48-week controlled study. J Acquir Immune Defic Syndr 46:125–133. doi: 10.1097/QAI.0b013e318157131c. [DOI] [PubMed] [Google Scholar]
- 4.Markowitz M, Nguyen BY, Gotuzzo E, Mendo F, Ratanasuwan W, Kovacs C, Prada G, Morales-Ramirez JO, Crumpacker CS, Isaacs RD, Campbell H, Strohmaier KM, Wan H, Danovich RM, Teppler H. 2009. Sustained antiretroviral effect of raltegravir after 96 weeks of combination therapy in treatment-naive patients with HIV-1 infection. J Acquir Immune Defic Syndr 52:350–356. doi: 10.1097/QAI.0b013e3181b064b0. [DOI] [PubMed] [Google Scholar]
- 5.Rockstroh JK, Lennox JL, DeJesus E, Saag MS, Lazzarin A, Wan H, Walker ML, Xu X, Zhao J, Teppler H, DiNubile MJ, Rodgers AJ, Nguyen BY, Leavitt R, Sklar P. 2011. Long-term treatment with raltegravir or efavirenz combined with tenofovir/emtricitabine for treatment-naive human immunodeficiency virus-1-infected patients: 156-week results from STARTMRK. Clin Infect Dis 53:807–816. doi: 10.1093/cid/cir510. [DOI] [PubMed] [Google Scholar]
- 6.DeJesus E, Berger D, Markowitz M, Cohen C, Hawkins T, Ruane P, Elion R, Farthing C, Zhong L, Cheng AK, McColl D, Kearney BP. 2006. Antiviral activity, pharmacokinetics, and dose response of the HIV-1 integrase inhibitor GS-9137 (JTK-303) in treatment-naive and treatment-experienced patients. J Acquir Immune Defic Syndr 43:1–5. doi: 10.1097/01.qai.0000233308.82860.2f. [DOI] [PubMed] [Google Scholar]
- 7.Grinsztejn B, Nguyen BY, Katlama C, Gatell JM, Lazzarin A, Vittecoq D, Gonzalez CJ, Chen J, Harvey CM, Isaacs RD. 2007. Safety and efficacy of the HIV-1 integrase inhibitor raltegravir (MK-0518) in treatment-experienced patients with multidrug-resistant virus: a phase II randomised controlled trial. Lancet 369:1261–1269. doi: 10.1016/S0140-6736(07)60597-2. [DOI] [PubMed] [Google Scholar]
- 8.Steigbigel RT, Cooper DA, Teppler H, Eron JJ, Gatell JM, Kumar PN, Rockstroh JK, Schechter M, Katlama C, Markowitz M, Yeni P, Loutfy MR, Lazzarin A, Lennox JL, Clotet B, Zhao J, Wan H, Rhodes RR, Strohmaier KM, Barnard RJ, Isaacs RD, Nguyen BY. 2010. Long-term efficacy and safety of raltegravir combined with optimized background therapy in treatment-experienced patients with drug-resistant HIV infection: week 96 results of the BENCHMRK 1 and 2 phase III trials. Clin Infect Dis 50:605–612. doi: 10.1086/650002. [DOI] [PMC free article] [PubMed] [Google Scholar]
- 9.Grobler JA, Mckenna P, Ly S, Stillmock K, Bahnck C, Danovich RM, Dornadula G, Hazuda DJ, Miller MD. 2009. Functionally irreversible inhibition of integration by slowly dissociating strand transfer inhibitors, abstr O-10. Abstr 10th Int Workshop Clin Pharmacol HIV Ther, Amsterdam, Netherlands, 15 to 17 April 2009. [Google Scholar]
- 10.Hightower KE, Wang R, Deanda F, Johns BA, Weaver K, Shen Y, Tomberlin GH, Carter HL III, Broderick T, Sigethy S, Seki T, Kobayashi M, Underwood MR. 2011. Dolutegravir (S/GSK1349572) exhibits significantly slower dissociation than raltegravir and elvitegravir from wild-type and integrase inhibitor-resistant HIV-1 integrase-DNA complexes. Antimicrob Agents Chemother 55:4552–4559. doi: 10.1128/AAC.00157-11. [DOI] [PMC free article] [PubMed] [Google Scholar]
- 11.Weng Q, Kulawy R, McSharry JJ, Drusano GL. 2009. Dose range and dose fractionation studies for raltegravir pharmacodynamics in an in vitro hollow fiber infection model system, abstr O-9. Abstr 10th Int Workshop Clin Pharmacol HIV Ther, Amsterdam, Netherlands, 15 to 17 April 2009. [Google Scholar]
- 12.Eron JJ Jr, Rockstroh JK, Reynes J, Andrade-Villanueva J, Ramalho-Madruga JV, Bekker LG, Young B, Katlama C, Gatell-Artigas JM, Arribas JR, Nelson M, Campbell H, Zhao J, Rodgers AJ, Rizk ML, Wenning L, Miller MD, Hazuda D, DiNubile MJ, Leavitt R, Isaacs R, Robertson MN, Sklar P, Nguyen BY. 2011. Raltegravir once daily or twice daily in previously untreated patients with HIV-1: a randomised, active-controlled, phase 3 non-inferiority trial. Lancet Infect Dis 11:907–915. doi: 10.1016/S1473-3099(11)70196-7. [DOI] [PubMed] [Google Scholar]
- 13.Witmer M, Danovich R. 2009. Selection and analysis of HIV-1 integrase strand transfer inhibitor resistant mutant viruses. Methods 47:277–282. doi: 10.1016/j.ymeth.2009.02.025. [DOI] [PubMed] [Google Scholar]
- 14.Brown AN, McSharry JJ, Weng Q, Driebe EM, Engelthaler DM, Sheff K, Keim PS, Nguyen J, Drusano GL. 2010. In vitro system for modeling influenza A virus resistance under drug pressure. Antimicrob Agents Chemother 54:3442–3450. doi: 10.1128/AAC.01385-09. [DOI] [PMC free article] [PubMed] [Google Scholar]
- 15.McSharry JJ, Deziel MR, Zager K, Weng Q, Drusano GL. 2009. Pharmacodynamics of cidofovir for vaccinia virus infection in an in vitro hollow-fiber infection model system. Antimicrob Agents Chemother 53:129–135. doi: 10.1128/AAC.00708-08. [DOI] [PMC free article] [PubMed] [Google Scholar]
- 16.McSharry JJ, Weng Q, Brown A, Kulawy R, Drusano GL. 2009. Prediction of the pharmacodynamically linked variable of oseltamivir carboxylate for influenza A virus using an in vitro hollow-fiber infection model system. Antimicrob Agents Chemother 53:2375–2381. doi: 10.1128/AAC.00167-09. [DOI] [PMC free article] [PubMed] [Google Scholar]
- 17.Drusano GL, Bilello PA, Symonds WT, Stein DS, McDowell J, Bye A, Bilello JA. 2002. Pharmacodynamics of abacavir in an in vitro hollow-fiber model system. Antimicrob Agents Chemother 46:464–470. doi: 10.1128/AAC.46.2.464-470.2002. [DOI] [PMC free article] [PubMed] [Google Scholar]
- 18.Drusano GL, Bilello JA, Preston SL, O'Mara E, Kaul S, Schnittman S, Echols R. 2001. Hollow-fiber unit evaluation of a new human immunodeficiency virus type 1 protease inhibitor, BMS-232632, for determination of the linked pharmacodynamic variable. J Infect Dis 183:1126–1129. doi: 10.1086/319281. [DOI] [PubMed] [Google Scholar]
- 19.Iwamoto M, Wenning LA, Petry AS, Laethem M, De SM, Kost JT, Merschman SA, Strohmaier KM, Ramael S, Lasseter KC, Stone JA, Gottesdiener KM, Wagner JA. 2008. Safety, tolerability, and pharmacokinetics of raltegravir after single and multiple doses in healthy subjects. Clin Pharmacol Ther 83:293–299. doi: 10.1038/sj.clpt.6100281. [DOI] [PubMed] [Google Scholar]
- 20.Temesgen Z, Siraj DS. 2008. Raltegravir: first in class HIV integrase inhibitor. Ther Clin Risk Manag 4:493–500. doi: 10.2147/TCRM.S2268. [DOI] [PMC free article] [PubMed] [Google Scholar]
- 21.Metifiot M, Johnson B, Smith S, Zhao XZ, Marchand C, Burke T, Hughes S, Pommier Y. 2011. MK-0536 inhibits HIV-1 integrases resistant to raltegravir. Antimicrob Agents Chemother 55:5127–5133. doi: 10.1128/AAC.05288-11. [DOI] [PMC free article] [PubMed] [Google Scholar]
- 22.Croxtall JD, Lyseng-Williamson KA, Perry CM. 2008. Raltegravir. Drugs 68:131–138. doi: 10.2165/00003495-200868010-00009. [DOI] [PubMed] [Google Scholar]
- 23.Rizk ML, Hang Y, Luo WL, Su J, Zhao J, Campbell H, Nguyen BY, Sklar P, Eron JJ Jr, Wenning L. 2012. Pharmacokinetics and pharmacodynamics of once-daily versus twice-daily raltegravir in treatment-naive HIV-infected patients. Antimicrob Agents Chemother 56:3101–3106. doi: 10.1128/AAC.06417-11. [DOI] [PMC free article] [PubMed] [Google Scholar]
- 24.Cattaneo D, Gervasoni C, Meraviglia P, Landonio S, Fucile S, Cozzi V, Baldelli S, Pellegrini M, Galli M, Clementi E. 2012. Inter- and intra-patient variability of raltegravir pharmacokinetics in HIV-1-infected subjects. J Antimicrob Chemother 67:460–464. doi: 10.1093/jac/dkr498. [DOI] [PubMed] [Google Scholar]
- 25.Brainard DM, Friedman EJ, Jin B, Breidinger SA, Tillan MD, Wenning LA, Stone JA, Chodakewitz JA, Wagner JA, Iwamoto M. 2011. Effect of low-, moderate-, and high-fat meals on raltegravir pharmacokinetics. J Clin Pharmacol 51:422–427. doi: 10.1177/0091270010367652. [DOI] [PubMed] [Google Scholar]
- 26.Brown AN, Bulitta JB, McSharry JJ, Weng Q, Adams JR, Kulawy R, Drusano GL. 2011. Effect of half-life on the pharmacodynamic index of zanamivir against influenza virus delineated by a mathematical model. Antimicrob Agents Chemother 55:1747–1753. doi: 10.1128/AAC.01629-10. [DOI] [PMC free article] [PubMed] [Google Scholar]