

Abstract
Candida infections are a leading cause of infectious disease-related death in children supported by extracorporeal membrane oxygenation (ECMO). The ECMO circuit can alter drug pharmacokinetics (PK); thus, standard fluconazole dosing may result in suboptimal drug exposures. The objective of our study was to determine the PK of fluconazole in children on ECMO. Forty children with 367 PK samples were included in the analysis. The PK data were analyzed using nonlinear mixed-effect modeling (NONMEM). A one-compartment model best described the data. Weight was included in the base model for clearance (CL) and volume of distribution (V). The final model included the effect of serum creatinine (SCR) level on CL and the effect of ECMO on V as follows: CL (in liters per hour) = 0.019 × weight × (SCR/0.4)−0.29 × exp(ηCL) and V (in liters) = 0.93 × weight × 1.4ECMO × exp(ηV). The fluconazole V was increased in children supported by ECMO. Consequently, children on ECMO require a higher fluconazole loading dose for prophylaxis (12 mg/kg of body weight) and treatment (35 mg/kg) paired with standard maintenance doses to achieve exposures similar to those of children not on ECMO.
INTRODUCTION
Extracorporeal membrane oxygenation (ECMO) is life-saving in children with refractory cardiorespiratory failure. ECMO is a cardiopulmonary bypass device that provides complete respiratory and cardiac support. Mechanically, blood is drained from the venous system, pumped through an artificial lung membrane in which oxygen is added and carbon dioxide is removed, and then returned to either venous or arterial circulation. ECMO has been used successfully to support children with multiple disease processes, including meconium aspiration syndrome, fulminant myocarditis, and sepsis (1). Despite these successes, children supported by ECMO are at high risk for ECMO-related complications, especially nosocomial infections (2).
Invasive candidiasis is common and fatal in children on ECMO. In this population, Candida species are the most common infectious organism (2). The incidence of infection varies by center, and rates as high as 10% have been reported (2, 3). Candida infections cause substantial morbidity and mortality (3) and are difficult to eradicate due to the ability of the organism to adhere to indwelling catheters. For this reason, routine management of candidiasis consists not only of the use of antifungal agents but also the removal of catheters (4). Catheter removal for children on ECMO is often impossible, because the ECMO cannulas connect the child to the ECMO circuit. Therefore, therapy on ECMO relies on either the prevention of invasive candidiasis or optimal therapeutic dosing in children with infection.
Optimal dosing for prevention or treatment of candidiasis in children on ECMO can differ greatly from that with other populations due to the pharmacokinetic (PK) changes induced by the ECMO circuit. PK changes attributed to ECMO support include increased volume of distribution (V) and decreased clearance (CL), but these vary by drug and are not consistently predicted using drug physicochemical properties (5–8). This study describes the population PK of fluconazole in children supported by ECMO and provides rational dosing recommendations for the prevention and treatment of invasive candidiasis in this vulnerable population.
MATERIALS AND METHODS
Study design.
Fluconazole samples were obtained from three prospective trials. Study 1 was a single-center open-label PK study of fluconazole in children on ECMO (n = 20) (9), study 2 was a single-center PK study of a fluconazole loading dose in critically ill children (n = 12) (10), and study 3 was a multicenter PK study of fluconazole in infants (n = 8) (11). The study designs are described in detail elsewhere (9–11). In brief, study 1 included critically ill children <18 years of age supported by ECMO who received intravenous (i.v.) fluconazole (25 mg/kg of body weight once weekly for prophylaxis or standard-of-care dosing for presumed fungal infection) for the prevention or treatment of fungal infection. Study 2 included critically ill infants <1 year of age, one of whom was supported by ECMO, who received a fluconazole loading dose (25 mg/kg i.v. once), followed by daily maintenance therapy (12 mg/kg i.v.). Study 3 enrolled infants from 23 to 42 weeks gestational age at birth who were <120 days of age and receiving i.v. fluconazole for the prevention or treatment of candidiasis. We included only the children from study 3 who were ≥36 weeks gestation to limit the PK variability introduced by prematurity. These trials were approved by the respective institutional review boards, and written informed consent was obtained from the legal guardian of each child.
The following clinical variables were collected for all studies: postnatal age (PNA), weight, race, sex, presence of ECMO support, use of hemofiltration or dialysis, and serum creatinine (SCR) levels. Serum albumin, aspartate aminotransferase (AST), and serum alanine aminotransferase (ALT) data were collected for studies 1 and 2. PNA and weight were calculated on the day of the first dose of study drug, and those values were imputed forward. For children with multiple measurements of SCR, albumin, AST, or ALT, values were allowed to change with time. For children without albumin, AST, or ALT measurements during the study period, the values were set to the population medians (2.7 g/dl, 35 U/liter, and 19 U/liter, respectively). A comparison of the covariate values between children on ECMO and those not on ECMO was done using the Wilcoxon rank sum test in Stata 12 (StataCorp, College Station, TX).
PK sample collection.
Children in study 1 had up to 12 plasma samples (200 μl each) collected around doses 1 and 2. The sampling windows at each dose included 0 to 4 h prior to the start of infusion and serial samples after the end of the infusion at 15 min (±15 min), 3 h (±1 h), 9 h (±3 h), 23 h (±1 h), and 47 h (±1 h). Children in study 2 had 6 to 8 plasma samples (200 μl each) after the loading dose at the following time points after the end of the infusion: 15 min (±15 min), 3 h (±1 h), 9 h (±3 h), and 21 h (±3 h), and multidose sampling occurred after doses 3 and 5 (0 to 4 h before dose and 2 to 6 h after dose). Infants enrolled in study 3 were sampled preinfusion, at the end of infusion, and 1 h, 7 h (±1 h) or 11 h (±1 h), 24 h, and 48 h postinfusion. Samples were collected in BD EDTA Microtainers and taken from a different site than the site used for fluconazole administration. The samples were processed immediately or placed on ice until processing. Plasma was separated via centrifugation (at 3,000 × g and 4°C for 10 min), manually aspirated, and transferred to polypropylene tubes. The plasma samples were frozen at −80°C until analysis. To supplement these PK samples, plasma from leftover clinical samples collected per standard of care (EDTA Microtainers) was collected up to 72 h after sample collection. Fluconazole scavenge samples have been shown to be stable for up to 72 h (11).
Analytic procedures.
Plasma fluconazole concentrations were determined using a validated liquid chromatography-tandem mass spectrometry assay (12). The lower limit of quantification was 0.01 mg/liter; intraday and interday precision rates ranged from 2.84% to 10.8% and 5.27% to 11.5%, respectively, within the concentration range of the standard curve (0.01 to 10 mg/liter).
Population PK analysis.
PK data were analyzed with a nonlinear mixed-effect modeling approach using NONMEM version 7.2 (Icon Development Solutions, Ellicott City, MD) in conjunction with Perl speaks NONMEM version 3.6.2 (13). Run management was performed using Piraña version 2.8.0 (14). Model analysis was summarized with Stata 12 (StataCorp, College Station, TX). A first-order conditional estimate with interaction was used for all models. One- and two-compartment PK structural models were evaluated. Interindividual random effects were evaluated on CL and V, and both diagonal and block Omega matrices for covariance were explored. An exponential model for interindividual variance was used. The eta shrinkage was assessed to determine if the PK data set was informative to adequately estimate interindividual variability in PK parameter estimates. Proportional and additive-plus-proportional error models of residual variability were assessed. Body weight was incorporated into the base model before the evaluation of other covariates due to multicolinearity with other clinical covariates. Both linear and allometric scaling of weight was assessed for clearance. For volume and intercompartmental clearance parameters, size-based scaling was incorporated using a linear relationship with body weight. The impact of physiologically plausible covariates was evaluated if a relationship was suggested by visual inspection of scatter and box plots (for continuous and categorical variables, respectively) of individual Bayesian estimates of CL and V obtained from the base model against covariates. The following covariates were evaluated: ECMO support, volume of blood required to prime the ECMO circuit, ratio of blood prime volume to the estimated native blood volume of the child, hemofiltration, use of continuous venovenous hemodialysis (CVVHD), SCR, albumin, AST, and ALT levels, PNA, sex, and race. All continuous variables were centered using the median value. Covariate testing was performed via standard stepwise forward addition, backward elimination methods. Covariates were included in the multivariable analysis if the decrease in the objective function value relative to the base model was ≥3.84 (P < 0.05). Covariates were retained in the final model if their removal from the multivariable model caused an increase in the objective function value of ≥6.635 (P < 0.01). Empirical Bayesian estimates of individual PK parameters were generated from the final model using the post hoc subroutine.
Model evaluation.
Models were evaluated based on the successful minimization, goodness-of-fit plots, objective function values, plausibility of parameter estimates, and precision of parameter estimates. The precision of the final model was evaluated through bootstrapping with 1,000 replicate data sets to generate median and 95% confidence intervals for the PK parameter estimates. In addition, a visual predictive check was used to evaluate model predictability by simulating 1,000 data sets based on the final parameter estimates and their associated variances. The dosing and covariate values used to generate the predictions in the standardized visual predictive check were the same as those used in the study population. The simulated results were compared with the results observed in the study, and the number of observed concentrations outside the 90% prediction interval was quantified.
Assessment of dose-exposure relationship.
Fluconazole exhibits time-dependent fungistatic activity with a prolonged postantibiotic effect, and efficacy is most closely associated with an area under the concentration-time curve (AUC) to MIC ratio (AUC/MIC) of ≥50 (15–17). For treatment, we chose to target a minimum AUC for the first 24 h (AUC24) of 400 mg · h/liter in 90% of the children. The AUC24 of 400 mg · h/liter achieves the target AUC/MIC ratio, assuming an MIC of 8 mg/liter, the Clinical and Laboratory Standards Institute (CLSI) sensitivity breakpoint for all Candida species (18). There are no established pharmacodynamic targets for prophylaxis, so we chose an AUC24 of 200 mg · h/liter in 90% of the simulated children to match the exposure seen in adults on 200 to 400 mg daily for prophylaxis (19–21). For prophylaxis, it is important to minimize the development of Candida resistance. The risk of developing resistance increases when fluconazole concentrations are below the MIC for >50% of the dosing interval (22). Therefore, for prophylaxis, we also evaluated as a secondary endpoint the percentage of the dosing interval that concentrations were above the MIC (%TMIC).
Monte Carlo simulations using parameter estimates from the final model were used to explore dose-exposure relationships using these targets. We explored a variety of dosing regimens based on current Infectious Diseases Society of America (IDSA) guidelines (19) and our previous work describing fluconazole exposure in children on ECMO (9). We simulated 100 PK profiles for each child in the data set based on the parameter estimates and the variability derived from the final model to measure target attainment rates in the first 24 h and at steady state. We stratified children by the presence or absence of ECMO support. Using parameter estimates from the final model, we calculated the maximum (Cmax) and minimum (Cmin) fluconazole concentrations for each of 14 simulated dosing intervals using the equation for an intermittent infusion. We then used the Cmax and Cmin values to calculate the AUC for each dosing interval using the linear-up log-down trapezoidal approach.
RESULTS
Study infants and PK specimens.
PK samples were collected from 40 children who received intravenous (i.v.) fluconazole. The median age of the children was 22 days (range, 1 day, 17 years) (Table 1). While some children were born prematurely, the median postmenstrual age for children <1 year of age was 41 weeks (range, 35, 76 weeks). Data from 360 plasma PK samples with a median of 8 samples per child (range, 1, 22 samples) were included in the population PK analysis. Fifty-five (15%) of the PK samples were scavenge samples (study 1, n = 32; study 2, n = 6; study 3, n = 17). Twenty-one (53%) children were supported by ECMO. Five of the children on ECMO had concomitant hemofiltration during PK sample collection, and two of those children subsequently required CVVHD. The median number of SCR samples collected during the study period per child was 10 (range, 1, 23 samples). All children had an SCR sample at time of first dose. The median SCR level at the time of first dose was 0.4 mg/dl (range, 0.1, 1.3 mg/dl), and the maximum SCR level during the PK sampling period was 0.6 mg/dl (range, 0.1, 3.2 mg/dl). The initial SCR level was not significantly different between children on ECMO and those not on ECMO (0.5 versus 0.3 mg/dl, respectively; P = 0.13). However, children on ECMO had a higher maximum SCR level than that of children not on ECMO (0.7 versus 0.5 mg/dl, respectively; P = 0.03). Albumin and AST/ALT lab values were available for all children on ECMO but only for half of those not on ECMO. The median albumin levels were low, at 2.7, whereas the AST/ALT levels were within normal limits (Table 1). No children developed culture-confirmed invasive candidiasis while on the study.
TABLE 1.
Clinical data for study subjectsa
| Characteristic | All subjects | Subjects on ECMO support | Subjects not on ECMO |
|---|---|---|---|
| n (%) | 40 (100) | 21 (53) | 19 (47) |
| Body wt (kg) | 3.4 (1.9, 77) | 4.2 (2.0, 77) | 3.2 (1.9, 8.0) |
| Postnatal age (days) | 22 (1, 6,498) | 113 (1, 6,498) | 13 (1, 262) |
| Gestational age (wk)b | 38 (24, 41) | 38 (30, 41) | 37 (24, 40) |
| Postmenstrual age (wk) | 41 (35, 76) | 42 (36, 63) | 39 (35, 76) |
| Female | 14 (35) | 7 (33) | 7 (37) |
| Race | |||
| White | 17 (43) | 9 (43) | 8 (42) |
| African-American | 18 (45) | 10 (48) | 8 (42) |
| Other | 5 (12) | 2 (9) | 3 (16) |
| Indication | |||
| Prophylaxis | 23 (57) | 17 (81) | 6 (32) |
| Treatment | 17 (43) | 4 (19) | 13 (68) |
| First dose (mg/kg) | 25 (2.7, 26.5) | 25.0 (10.4, 25.7) | 17.4 (2.7, 26.5) |
| PK sample collection period (days)c | 5.5 (2.0, 34.0) | 8.8 (2.1, 21.3) | 4.2 (2.0, 34.0) |
| No. of PK samples per child | 8 (1, 22) | 11 (5, 22) | 8 (1, 14) |
| Serum creatinine level (mg/dl) | |||
| Initiald | 0.4 (0.1, 1.3) | 0.5 (0.1, 1.2) | 0.3 (0.1, 1.3) |
| Maximum | 0.6 (0.1, 3.2) | 0.7 (0.3, 3.2) | 0.5 (0.1, 1.3) |
| Albumin level (g/dl) | 2.7 (1.1, 4.0) | 2.8 (2.0, 4.0) | 2.7 (1.1, 3.1) |
| Aspartate aminotransferase level (U/liter) | 35 (15, 673) | 39 (23, 673) | 35 (15, 159) |
| Alanine aminotransferase level (U/liter) | 19 (8, 127) | 16 (8, 127) | 19 (8, 126) |
Values are median (range) for continuous variables and no. (%) for categorical variables.
Gestational age is reported only for infants <1 year of age (n = 33).
Sample collection period is the time between first dose of study drug and collection of last PK sample.
Initial serum creatinine collected within 24 h of first dose.
Population PK model development.
A summary of the model building process is shown in Table 2. Based on goodness-of-fit criteria, a one-compartment model best described the data. Weight was included in the base model for CL and V. CL and V were not correlated, and use of a covariance term between CL and V did not improve the model fit. The eta shrinkage of the base model was low for both CL (4.6%) and V (7.0%), allowing us to reliably estimate interindividual variability for both parameters. Similarly, the eps shrinkage was low, at 9.6%, suggesting that our model was not overparameterized. Residual variability was best described by a proportional error model. While a proportional-plus-additive error model resulted in a significant drop in the objective function, we were unable to precisely estimate the additive error component. Because goodness-of-fit plots and estimates were virtually identical between the two error models, we used the proportional error model in the final model. Allometric scaling of weight (3/4 power) on CL did not improve model fit and increased the objective function value by 9.7 points. Similarly, the use of a sigmoidal maximum effect (Emax) maturation relationship between postmenstrual age and CL resulted in an increase in the objective function value by 4.8 points. Consequently, weight was scaled to the power of 1 for both CL and V. The residual unexplained interindividual variability in CL was visually associated with SCR level, hemofiltration, CVVHD, and albumin level, while ECMO support, hemofiltration, and CVVHD were associated with interindividual variability in V. During the univariable analysis, SCR level and hemofiltration on CL and ECMO and hemofiltration on V resulted in a significant drop in the objective function and were included in the multivariable analysis. Neither ECMO prime volume nor the ratio of prime volume to native blood volume improved the model fit on V better than presence of ECMO support. Because these covariates are colinear with ECMO, we included only the effect of ECMO on V in the multivariable analysis. In the multivariable analysis, during the forward addition step, the addition of SCR and hemofiltration to CL and ECMO support and hemofiltration to V resulted in a significant drop in the objective function. However, during backward elimination, hemofiltration on CL and V did not improve the model goodness of fit, nor did it significantly decrease the objective function value. The final model included the effect of SCR on CL and ECMO on V. CL (in liters per hour) was calculated as 0.019 × weight × (SCR/0.5)−0.29 × exp(ηCL), and V (in liters) was calculated as 0.93 × weight × 1.4ECMO × exp(ηV). ηCL and ηV refer to the interindividual variability on CL and V, respectively. ECMO is equal to 1 if ECMO is present and 0 if ECMO is not present.
TABLE 2.
Population PK model developmenta
| Model description | Population modelb | OFVc | ΔOFV |
|---|---|---|---|
| Base model and univariable analysisd | |||
| Volume of distribution (liters) | V = θV × wt | 1,022.74 | |
| ECMO | V = θV × wt × 1.41ECMO(= 1 or 0) | 1,008.22 | −14.52 |
| Hemofiltration | V = θV × wt × 1.54HMFLTR(= 1 or 0) | 1,012.13 | −10.61 |
| Clearance (liters/h) | CL = θCL × wt | 1,022.74 | |
| Creatinine | CL = θCL × wt × (creatinine/0.4)−0.29 | 950.84 | −71.91 |
| Hemofiltration | CL = θCL × wt × 0.66HMFLTR | 1,019.18 | −3.56 |
| Multivariable analysis | |||
| CL = f(SCR), V = f(ECMO)e | V = θV × wt × 1.39ECMO | 936.95 | −13.89f |
| CL = θCL × wt × (creatinine/0.4)−0.29 | |||
| CL = f(SCR), V = f(ECMO,HMFLTR) | V = θV × wt × 1.30ECMO × 1.34HMFLTR | 930.70 | −6.25g |
| CL = θCL × wt × (creatinine/0.4)−0.29 | |||
| CL = f(SCR, HMFLTR), V = f(ECMO, HMFLTR) | V = θV × wt × 1.30ECMO × 1.34HMFLTR | 930.33 | −0.37g |
| CL = θCL × wt × (creatinine/0.4)−0.29 × 0.90HMFLTR | |||
| Final model | |||
| V = f(ECMO) | V = θV × wt × 1.39ECMO | ||
| CL = f(SCR) | CL = θCL × wt × (creatinine/0.4)−0.29 | 936.95 | −13.89f |
All coefficients in the models are estimated parameters from the respective model.
V, volume of distribution; wt, weight; HMFLTR, hemofiltration; CL, clearance.
OFV, objective function value.
Only models of covariates that significantly improved the OFV are shown in the univariable analysis. For a full list of covariates tested, see Materials and Methods.
SCR, serum creatinine.
ΔOFV calculated relative to CL∼creatinine model (950.84).
ΔOFV calculated relative to preceding model.
Model evaluation and validation.
The final model had good precision, as evidenced by the % relative standard errors around the parameter point estimates for fixed effects (5.6 to 9.9%) and random effects (13.1 to 28.6%) and by 95% confidence intervals generated by bootstrapping (n = 1,000 simulated trials, 999 successful runs) (Table 3). Goodness-of-fit diagnostic plots for the final model are shown in Fig. 1. The visual predictive check demonstrated a good fit between observed and predicted fluconazole concentrations (Fig. 2). Only 4% (13/360) of the observed concentrations were outside the 90% prediction interval, with 10 observations greater than the prediction interval and 3 observations below. Of the 3 subjects with observed data greater than the prediction interval, one had the highest dose in the cohort (27 mg/kg load, followed by 12 mg/kg daily), and the other two received a high loading dose (25 mg/kg and 23 mg/kg, respectively, followed by 12 mg/kg daily) in the context of mild to moderate renal dysfunction. The subject with 3 observations below the prediction interval received the lowest dose of the cohort. None of these children were on ECMO, and all were <2 years of age.
TABLE 3.
Final population PK model parameter estimates
| Parameter | Point estimate | % RSEa | Bootstrap CIb |
||
|---|---|---|---|---|---|
| 2.5% | Median | 97.5% | |||
| Fixed effects | |||||
| V (liters/kg) | 0.93 | 5.8 | 0.83 | 0.93 | 1.06 |
| CL (liters/h/kg) | 0.019 | 5.6 | 0.017 | 0.019 | 0.021 |
| Coefficient for ECMO on V | 1.39 | 7.8 | 1.17 | 1.39 | 1.63 |
| Exponent for creatinine on CL | −0.29 | 9.9 | −0.41 | −0.29 | −0.24 |
| Random effects | |||||
| V interindividual variability (CV [%])c | 22.2 | 28.6 | 14.7 | 21.5 | 27.7 |
| CL interindividual variability (CV [%]) | 33.2 | 21.3 | 25.0 | 32.6 | 39.2 |
| Residual proportional error (CV [%]) | 15.3 | 13.1 | 13.0 | 15.2 | 16.9 |
RSE, residual standard error.
CI, confidence interval.
CV, coefficient of variation.
FIG 1.

Final population PK model diagnostic plots: observed versus population prediction (A) and individual prediction (B) and weighted residuals versus population predictions (C) and time (D). (A and B) Line of identity is included as a reference. For conditional weighted residuals (CWRES), a line at y = 0 is included as a reference.
FIG 2.
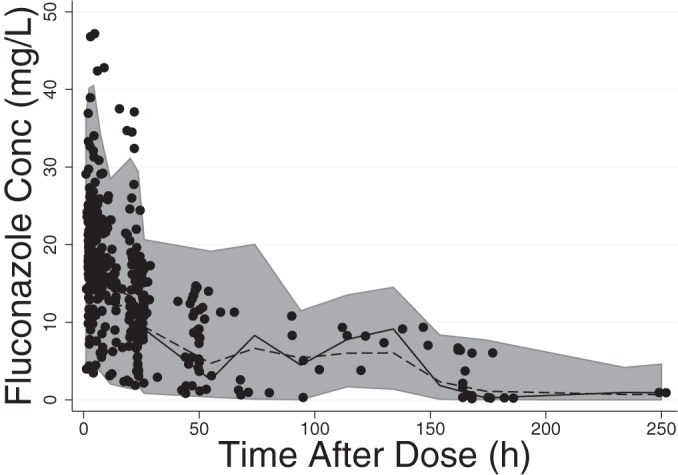
Visual predictive check. The shaded area represents the 95% prediction interval. The circles are observed data. The solid line represents the median of the observed data and the dashed line the median of the predicted data. Conc, concentration.
Empirical Bayesian estimates of CL and V.
The median (range) empirical Bayesian estimates for CL and V in children not on ECMO were 0.018 liters/h/kg (0.008, 0.042 liters/h/kg) and 0.93 liters/kg (0.55, 1.37 liters/kg), respectively (Table 4). Children on ECMO had ∼45% higher V (median, 1.35 liters/kg; range, 0.81, 1.81 liters/kg) but similar CL (median, 0.018 liters/h/kg; range, 0.011, 0.043 liters/h/kg) compared to those of children not on ECMO. We saw a trend toward decreased impact of ECMO support on V with increased age, likely reflecting the changing relationship of ECMO prime volume (250 to 400 ml) to the native blood volume of the child (∼250 to 5,000 ml, depending on age).
TABLE 4.
Bayesian estimates of V and CL overall and by age group based on ECMO supporta
| V or CL by time | ECMO | No ECMO |
|---|---|---|
| V (liters/kg) | ||
| 0–30 days | 1.5 (1.3, 1.8) | 0.96 (0.55, 1.4) |
| 31 days–2 yr | 1.2 (0.91, 1.6) | 0.83 (0.72, 1.0) |
| >2–17 yr | 1.1 (0.81, 1.5) | |
| All | 1.3 (0.81, 1.8) | 0.93 (0.55, 1.4) |
| CL (liters/h/kg) | ||
| 0–30 days | 0.018 (0.013, 0.043) | 0.018 (0.008, 0.042) |
| 31 days–2 yr | 0.022 (0.011, 0.039) | 0.017 (0.008, 0.029) |
| >2–17 yr | 0.014 (0.013, 0.029) | |
| All | 0.018 (0.011, 0.043) | 0.018 (0.008, 0.042) |
Values are median (range).
Dose-exposure relationship.
Monte Carlo simulations showed that children both supported and not supported by ECMO who received the IDSA-recommended treatment dose of 12 mg/kg daily (19) achieved the therapeutic target of an AUC24 of 400 mg · h/liter in 90% of the simulated children (Table 5). However, the time to reach therapeutic concentrations varied markedly based on the loading dose. No children on ECMO receiving 12 mg/kg as the initial dose achieved the target of an AUC24 >400 mg · h/liter in the first 24 h, and it took 10 days before 90% of the simulated children had an AUC24 of ≥400 mg · h/liter. A loading dose of 25 mg/kg achieved the therapeutic target within 24 h in 77.1% of the simulated children not on ECMO, but only 34.0% of the children on ECMO reached the therapeutic target in the first 24 h with this loading dose. A loading dose of 35 mg/kg was required to achieve an AUC24 of >400 mg · h/liter in 87.7% of the children on ECMO in the first 24 h, and 90% of the children achieved the target by day 2. Providing either a 40-mg/kg loading dose or 25 mg/kg every 12 h in the first day of therapy achieved an AUC24 of >400 mg · h/liter in 95.4% and 90.8% of the children, respectively, in the first 24 h. However, the maximum simulated concentrations after the 40-mg/kg loading dose and the second 25-mg/kg dose were considerably higher (62.1 and 68.0 mg/liter, respectively) than that after a single loading dose of 35 mg/kg (54.6 mg/liter), raising concerns of toxicity (Table 5 and Fig. 3).
TABLE 5.
Exposure in children on ECMO after different simulated dosing regimens
| Indication | Loading dose (mg/kg) | Maintenance dose (mg/kg) | Dosing interval (h) | % children for whom PD target was achieved in first 24 ha | Time to therapeutic exposure (days)a |
|---|---|---|---|---|---|
| Treatment | 12 | q24 | 0 | 10 | |
| 25 | 12 | q24 | 34.0 | 8 | |
| 35 | 12 | q24 | 87.7 | 2 | |
| 40 | 12 | q24 | 95.4 | 1 | |
| 25 q12h | 12 | q24 | 90.8 | 1 | |
| Prophylaxis | 6 | q24 | 0 | 7 | |
| 12 | 6 | q24 | 27.8 | 5 | |
| 12 | q72 | 27.8 | —b | ||
| 25 | q168 | 99.9 | — |
PD, pharmacodynamics. The PD target for treatment/therapeutic exposure is an AUC24 of >400 mg · h/liter in 90% of the simulated children. The PD target for prophylaxis is an AUC24 of >200 mg · h/liter in 90% of the simulated children.
—, for q72h and q168h dosing, we set the target as an AUC24 of >200 mg · h/liter in 90% of the simulated children for each 24-h period during the dosing interval. Using this approach, 90% of the simulated children never maintained an AUC24 of >200 mg · h/liter for each 24-h period.
FIG 3.

Simulated fluconazole plasma concentrations and exposure. (A and B) Treatment doses. (C to F) Prophylactic doses. (A) Simulated fluconazole plasma concentrations in children on ECMO (35 mg/kg load) compared to children not on ECMO (25 mg/kg load). Both cohorts received 12 mg/kg daily as maintenance. (B) Simulated fluconazole exposure in children on ECMO after different loading doses. The lines for individual dosing regimens represent the 10th percentile of exposure (i.e., 90% of simulated children above the line). The horizontal dashed line represents the target AUC for therapy. (C and D) Simulated fluconazole plasma concentrations (C) and exposure (D) in children on ECMO receiving 12 mg/kg load and then 6 mg/kg daily. (E and F) Simulated fluconazole plasma concentrations (E) and exposure (F) in children on ECMO receiving 25 mg/kg once weekly. The solid line is the median, and the shaded regions represent the 90% prediction interval. The dashed lines represent an MIC of 4 mg/liter (C and E) and the target AUC for prophylaxis (D and F). The AUC is calculated for a 24-h period for all panels.
For prophylaxis, children on ECMO who received 6 mg/kg daily per current IDSA guidelines did not achieve therapeutic exposure (AUC24, 200 mg · h/liter in 90% of the children) until day 7 of therapy (Table 5). If children on ECMO receive a prophylactic loading dose of 12 mg/kg, followed by 6 mg/kg daily, most (68.9%) children will reach an AUC24 of >200 mg · h/liter by day 2, and 90.0% of the children will achieve the therapeutic AUC24 by day 5 of therapy. We also simulated exposure using the prophylactic dose evaluated in the ECMO fluconazole study (25 mg/kg, once weekly) and found that this dosing regimen achieved the target exposure during the first 2 days of the dosing interval, but on days 3 to 7, only 65.9%, 33.8%, 14.5%, 5.8%, and 2.2% of the children, respectively, achieved an AUC24 of >200 mg · h/liter. We simulated 12 mg/kg every 72 h and found that even after 4 doses (12 days), there were zero days when 90% of the children on ECMO had an AUC24 of >200 mg · h/liter.
Because of the wide range of ages and weights among the study subjects, the same treatment and prophylaxis simulations were performed in children <2 years of age (data not shown). The results from these simulations were within 5% of the results above.
DISCUSSION
Current treatment recommendations for invasive candidiasis are inadequate for treatment in children supported by ECMO. For the treatment of invasive candidiasis, we chose to target exposures observed in critically ill adults taking 800 mg of fluconazole per day. A dose of 12 mg/kg per day achieved therapeutic exposure in children on ECMO, but it took 10 days to reach those concentrations. In a critically ill child, this delay is unacceptable. Loading doses are routinely used in adults, and in a prior analysis of one of the trials included in the current study, a fluconazole loading dose of 25 mg/kg appeared safe and achieved pharmacodynamic targets in 90% of a small cohort of children (10). Because of the increased V observed in children on ECMO, a higher loading dose (35 mg/kg) was required to achieve comparable exposure. Clinicians must balance the risk of subtherapeutic exposure against the risk of toxicity. In adults, a dose of 1,600 mg per day and serum concentrations of <80 mg/liter were well tolerated (23). The simulated 90th percentile concentration following a loading dose of 35 mg/kg was 34.2 mg/liter, and after maintenance therapy with 12 mg/kg, it was 51.8 mg/liter at steady state. While loading doses of 40 mg/kg and 25 mg/kg every 12 h (q12) in the first 24 h also achieved therapeutic exposure in children on ECMO, the simulated 90th percentile concentration was closer to 80 mg/liter, leading us to choose 35 mg/kg as the optimum loading dose. The safety of this loading dose should be prospectively evaluated in children.
Because invasive candidiasis is so difficult to treat in children on ECMO, this population might benefit from antifungal prophylaxis. Pharmacodynamic targets are not well defined for prophylaxis, but IDSA guidelines recommend 200 to 400 mg per day in immunocompromised and critically ill adults, equating to an AUC24 of 200 to 400 mg · h/liter. In addition to achieving appropriate prophylactic exposure, consideration must be given to limiting the development of resistance to fluconazole. In vitro studies suggest that maintaining plasma concentrations above the MIC for 50% of the dosing interval limits resistance, but it is unclear if the length of the dosing interval impacts this assumption. The ECMO fluconazole prophylaxis study included in this population analysis evaluated a dose of 25 mg/kg given once weekly. While almost all of these children maintained a fluconazole concentration above an MIC of 4 mg/liter for 50% of the dosing interval, many were below the MIC for the remainder of the dosing interval (3.5 days). Considering the uncertainty regarding how long fluconazole concentrations can remain below the MIC before the risk of resistance increases, we also simulated multiple daily regimens. Given the devastating results of invasive candidiasis in children on ECMO and the safety profile of fluconazole, we recommend routine fluconazole prophylaxis of 12 mg/kg on day 1 and 6 mg/kg/day while on ECMO in centers with a high incidence of Candida infection. SCR levels should be monitored closely during fluconazole administration, given the propensity of children on ECMO to develop renal dysfunction.
The difference in fluconazole exposure in children on ECMO compared to those not on ECMO is related to the increased V seen in children on ECMO. Increased V is expected due to the large volume of exogenous blood required to prime the circuit and the physiology associated with critical illness (e.g., inflammation). Our data suggest that as children age, the impact of ECMO support on V decreases, likely reflecting the volume of the ECMO prime in relation to the native blood volume of the child. For a 3-kg infant, the circuit prime volume (250 to 400 ml) might exceed their native blood volume (∼250 ml), while in a 70-kg adolescent, the prime volume is ∼8% of the child's blood volume (∼5 liters). Our data are limited by the fact that only five of the 40 children were ≥2 years of age, and all of these were on ECMO. Empirical Bayesian estimates of V in these five children (median, 1.1 liters/kg [range, 0.8, 1.5 liters/kg]) were slightly higher than estimates of V reported in children age 2 to 12 years (0.95 liters/kg) (24) and critically ill adults (0.6 to 0.7 liters/kg) (21). Given the severity of illness seen in our children and the contribution of the ECMO prime, our estimates are reasonable. However, because very few children in this study were >2 years, we recommend caution in extrapolating our results to this older population. Further study of the impact of ECMO on fluconazole V is warranted in children >2 years of age. ECMO also can increase V through adsorption of drug by the ECMO circuit; this is well described for other drugs (8, 25). However, a previous analysis evaluating fluconazole extraction by the ECMO circuit showed that fluconazole undergoes minimal adsorption by the circuit and is unlikely to contribute to increased V (9).
In our model, CL decreased with increasing SCR level. This relationship also was expected, as fluconazole is primarily excreted by the kidneys. Renal insufficiency is common in children supported by ECMO (1), but ECMO support itself was not significantly associated with changes in CL. When combined with the observation that neither CL nor SCR was significantly different between children on ECMO and those not on ECMO, these results suggest that dosing modifications in children with renal insufficiency should adhere to label guidelines, regardless of ECMO support. The possible exception to this conclusion is when ECMO is combined with hemofiltration or CVVHD. Studies in adults show that fluconazole CL increases in the presence of hemofiltration and CVVHD (26–29). Only 5 children received hemofiltration, and two received CVVHD, limiting our ability to draw conclusions about their impact on CL. We recommend caution in extrapolating our results to children on concomitant ECMO and hemofiltration or CVVHD.
Conclusion.
Fluconazole V is increased in children supported by ECMO. As a result, children on ECMO who develop invasive candidiasis require a fluconazole loading dose of 35 mg/kg, followed by a daily maintenance dose of 12 mg/kg to achieve exposures similar to those in children not on ECMO who are loaded with 25 mg/kg and maintained on 12 mg/kg daily. Children on ECMO may benefit from antifungal prophylaxis, and in this population, a loading dose of 12 mg/kg followed by 6 mg/kg daily is reasonable based on adult exposures after 200 to 400 mg per day. Children >2 years of age are underrepresented in this study, and the results of the present study should be extrapolated to this population with caution. In addition, these results are based on simulated clinical trials. Confirmatory prospective trials of fluconazole exposure, safety, and efficacy at these doses in this population are needed.
ACKNOWLEDGMENTS
This work was supported by the Pediatric Critical Care Scientist Development Program (grant 5K12HD047349), the Eunice Kennedy Shriver National Institute of Child Health and Human Development (grants 1K23HD075891 and 2K24HD058735), the Duke-University of North Carolina Collaborative T32 Fellowship (grant 1T32GM086330), and the Thrasher Research Fund.
We thank the members of the NICHD Pediatric Pharmacology Research Unit who contributed the data from study 3. We also thank the staff and research team in the pediatric critical care units at Duke University for their support of this study.
Kevin M. Watt receives support from NIGMS (grant 1T32GM086330-01A1), the Thrasher Research Fund (www.thrasherresearch.org), and the Pediatric Critical Care and Trauma Scientist Development Program (grant 5K12HD047349-10) for his work in pediatric clinical pharmacology. Daniel K. Benjamin, Jr receives support from the U.S. Government for his work in pediatric and neonatal clinical pharmacology(grants 1R01HD057956-05 and 1K24HD058735-05 and NICHD contract HHSN2752010000031) and the nonprofit organization Thrasher Research Fund for his work in neonatal candidiasis; he also receives research support from industry for neonatal and pediatric drug development (www.dcri.duke.edu/research/coi.jsp). Edmund Capparelli receives salary support from the U.S. Government (grant U54 HD071600-01) and research support from Trius, Cerexa Pharmaceuticals, Abbott, and Theravance. Michael Cohen-Wolkowiez receives support for research from the NIH (grant 1R01-HD076676-01A1), the National Center for Advancing Translational Sciences of the NIH (grant UL1TR001117), the National Institute of Allergy and Infectious Disease (grants HHSN272201500006I and HHSN272201300017I), the National Institute for Child Health and Human Development of the NIH (grant HHSN275201000003I), the U.S. Food and Drug Administration (grant 1U01FD004858-01), the Biomedical Advanced Research and Development Authority (BARDA) (grant HHSO100201300009C), the nonprofit organization Thrasher Research Fund (www.thrasherresearch.org), and from industry (CardioDx and Durata Therapeutics) for drug development in adults and children (www.dcri.duke.edu/research/coi.jsp). Daniel Gonzalez, Kim L. R. Brouwer, Kelly C. Wade, and Jeffrey Barrett have no conflicts of interest related to this study.
REFERENCES
- 1.ELSO. 2013. ECLS registry report: international summary. Extracorporeal Life Support Organization, Ann Arbor, MI. [Google Scholar]
- 2.Bizzarro MJ, Conrad SA, Kaufman DA, Rycus P, Extracorporeal Life Support Organization Task Force on Infections, Extracorporeal Membrane Oxygenation. 2010. Infections acquired during extracorporeal membrane oxygenation in neonates, children, and adults. Pediatr Crit Care Med 12:277–281. doi: 10.1097/PCC.0b013e3181e28894. [DOI] [PubMed] [Google Scholar]
- 3.Gardner AH, Prodhan P, Stovall SH, Gossett JM, Stern JE, Wilson CD, Fiser RT. 2011. Fungal infections and antifungal prophylaxis in pediatric cardiac extracorporeal life support. J Thorac Cardiovasc Surg 143:689–695. doi: 10.1016/j.jtcvs.2011.12.001. [DOI] [PubMed] [Google Scholar]
- 4.Eppes SC, Troutman JL, Gutman LT. 1989. Outcome of treatment of candidemia in children whose central catheters were removed or retained. Pediatr Infect Dis J 8:99–104. [PubMed] [Google Scholar]
- 5.Bhatt-Mehta V, Johnson CE, Schumacher RE. 1992. Gentamicin pharmacokinetics in term neonates receiving extracorporeal membrane oxygenation. Pharmacotherapy 12:28–32. [PubMed] [Google Scholar]
- 6.Mulla H, McCormack P, Lawson G, Firmin RK, Upton DR. 2003. Pharmacokinetics of midazolam in neonates undergoing extracorporeal membrane oxygenation. Anesthesiology 99:275–282. doi: 10.1097/00000542-200308000-00008. [DOI] [PubMed] [Google Scholar]
- 7.Veinstein A, Debouverie O, Gregoire N, Goudet V, Adier C, Robert R, Couet W. 2011. Lack of effect of extracorporeal membrane oxygenation on tigecycline pharmacokinetics. J Antimicrob Chemother 67:1047–1048. doi: 10.1093/jac/dkr550. [DOI] [PubMed] [Google Scholar]
- 8.Wildschut ED, Ahsman MJ, Allegaert K, Mathot RA, Tibboel D. 2010. Determinants of drug absorption in different ECMO circuits. Intensive Care Med 36:2109–2116. doi: 10.1007/s00134-010-2041-z. [DOI] [PMC free article] [PubMed] [Google Scholar]
- 9.Watt KM, Benjamin DK Jr, Cheifetz IM, Moorthy G, Wade KC, Smith PB, Brouwer KL, Capparelli EV, Cohen-Wolkowiez M. 2012. Pharmacokinetics and safety of fluconazole in young infants supported with extracorporeal membrane oxygenation. Pediatr Infect Dis J 31:1042–1047. doi: 10.1097/INF.0b013e31285d3091. [DOI] [PMC free article] [PubMed] [Google Scholar]
- 10.Piper L, Smith PB, Hornik CP, Cheifetz IM, Barrett JS, Moorthy G, Hope WW, Wade KC, Cohen-Wolkowiez M, Benjamin DK Jr. 2011. Fluconazole loading dose pharmacokinetics and safety in infants. Pediatr Infect Dis J 30:375–378. doi: 10.1097/INF.0b013e318202cbb3. [DOI] [PMC free article] [PubMed] [Google Scholar]
- 11.Wade KC, Wu D, Kaufman DA, Ward RM, Benjamin DK Jr, Sullivan JE, Ramey N, Jayaraman B, Hoppu K, Adamson PC, Gastonguay MR, Barrett JS, NICHD Pediatric Pharmacology Research Unit Network . 2008. Population pharmacokinetics of fluconazole in young infants. Antimicrob Agents Chemother 52:4043–4049. doi: 10.1128/AAC.00569-08. [DOI] [PMC free article] [PubMed] [Google Scholar]
- 12.Wu D, Wade KC, Paul DJ, Barrett JS. 2009. A rapid and sensitive LC-MS/MS method for determination of fluconazole in human plasma and its application in infants with Candida infections. Ther Drug Monit 31:703–709. doi: 10.1097/FTD.0b013e3181b20b40. [DOI] [PubMed] [Google Scholar]
- 13.Lindbom L, Pihlgren P, Jonsson EN. 2005. PsN-Toolkit—a collection of computer intensive statistical methods for non-linear mixed effect modeling using NONMEM. Comput Methods Programs Biomed 79:241–257. doi: 10.1016/j.cmpb.2005.04.005. [DOI] [PubMed] [Google Scholar]
- 14.Keizer RJ, van Benten M, Beijnen JH, Schellens JH, Huitema AD. 2011. Piraña and PCluster: a modeling environment and cluster infrastructure for NONMEM. Comput Methods Programs Biomed 101:72–79. doi: 10.1016/j.cmpb.2010.04.018. [DOI] [PubMed] [Google Scholar]
- 15.Andes D, van Ogtrop M. 1999. Characterization and quantitation of the pharmacodynamics of fluconazole in a neutropenic murine disseminated candidiasis infection model. Antimicrob Agents Chemother 43:2116–2120. [DOI] [PMC free article] [PubMed] [Google Scholar]
- 16.Clancy CJ, Staley B, Nguyen MH. 2006. In vitro susceptibility of breakthrough Candida bloodstream isolates correlates with daily and cumulative doses of fluconazole. Antimicrob Agents Chemother 50:3496–3498. doi: 10.1128/AAC.00741-06. [DOI] [PMC free article] [PubMed] [Google Scholar]
- 17.Clancy CJ, Yu VL, Morris AJ, Snydman DR, Nguyen MH. 2005. Fluconazole MIC and the fluconazole dose/MIC ratio correlate with therapeutic response among patients with candidemia. Antimicrob Agents Chemother 49:3171–3177. doi: 10.1128/AAC.49.8.3171-3177.2005. [DOI] [PMC free article] [PubMed] [Google Scholar]
- 18.Pai MP, Turpin RS, Garey KW. 2007. Association of fluconazole area under the concentration-time curve/MIC and dose/MIC ratios with mortality in nonneutropenic patients with candidemia. Antimicrob Agents Chemother 51:35–39. doi: 10.1128/AAC.00474-06. [DOI] [PMC free article] [PubMed] [Google Scholar]
- 19.Pappas PG, Kauffman CA, Andes D, Benjamin DK Jr, Calandra TF, Edwards JE Jr, Filler SG, Fisher JF, Kullberg BJ, Ostrosky-Zeichner L, Reboli AC, Rex JH, Walsh TJ, Sobel JD, Infectious Disease Society of America. 2009. Clinical practice guidelines for the management of candidiasis: 2009 update by the Infectious Diseases Society of America. Clin Infect Dis 48:503–535. doi: 10.1086/596757. [DOI] [PMC free article] [PubMed] [Google Scholar]
- 20.Hiemenz J, Cagnoni P, Simpson D, Devine S, Chao N, Keirns J, Lau W, Facklam D, Buell D. 2005. Pharmacokinetic and maximum tolerated dose study of micafungin in combination with fluconazole versus fluconazole alone for prophylaxis of fungal infections in adult patients undergoing a bone marrow or peripheral stem cell transplant. Antimicrob Agents Chemother 49:1331–1336. doi: 10.1128/AAC.49.4.1331-1336.2005. [DOI] [PMC free article] [PubMed] [Google Scholar]
- 21.Buijk SL, Gyssens IC, Mouton JW, Verbrugh HA, Touw DJ, Bruining HA. 2001. Pharmacokinetics of sequential intravenous and enteral fluconazole in critically ill surgical patients with invasive mycoses and compromised gastro-intestinal function. Intensive Care Med 27:115–121. doi: 10.1007/s001340000771. [DOI] [PubMed] [Google Scholar]
- 22.Andes D, Forrest A, Lepak A, Nett J, Marchillo K, Lincoln L. 2006. Impact of antimicrobial dosing regimen on evolution of drug resistance in vivo: fluconazole and Candida albicans. Antimicrob Agents Chemother 50:2374–2383. doi: 10.1128/AAC.01053-05. [DOI] [PMC free article] [PubMed] [Google Scholar]
- 23.Anaissie EJ, Kontoyiannis DP, Huls C, Vartivarian SE, Karl C, Prince RA, Bosso J, Bodey GP. 1995. Safety, plasma concentrations, and efficacy of high-dose fluconazole in invasive mold infections. J Infect Dis 172:599–602. doi: 10.1093/infdis/172.2.599. [DOI] [PubMed] [Google Scholar]
- 24.Brammer KW, Coates PE. 1994. Pharmacokinetics of fluconazole in pediatric patients. Eur J Clin Microbiol Infect Dis 13:325–329. doi: 10.1007/BF01974613. [DOI] [PubMed] [Google Scholar]
- 25.Dagan O, Klein J, Gruenwald C, Bohn D, Barker G, Koren G. 1993. Preliminary studies of the effects of extracorporeal membrane oxygenator on the disposition of common pediatric drugs. Ther Drug Monit 15:263–266. doi: 10.1097/00007691-199308000-00001. [DOI] [PubMed] [Google Scholar]
- 26.Muhl E, Martens T, Iven H, Rob P, Bruch HP. 2000. Influence of continuous veno-venous haemodiafiltration and continuous veno-venous haemofiltration on the pharmacokinetics of fluconazole. Eur J Clin Pharmacol 56:671–678. doi: 10.1007/s002280000216. [DOI] [PubMed] [Google Scholar]
- 27.Yagasaki K, Gando S, Matsuda N, Kameue T, Ishitani T, Hirano T, Iseki K. 2003. Pharmacokinetics and the most suitable dosing regimen of fluconazole in critically ill patients receiving continuous hemodiafiltration. Intensive Care Med 29:1844–1848. doi: 10.1007/s00134-003-1980-z. [DOI] [PubMed] [Google Scholar]
- 28.Valtonen M, Tiula E, Neuvonen PJ. 1997. Effect of continuous venovenous haemofiltration and haemodiafiltration on the elimination of fluconazole in patients with acute renal failure. J Antimicrob Chemother 40:695–700. doi: 10.1093/jac/40.5.695. [DOI] [PubMed] [Google Scholar]
- 29.Patel K, Roberts JA, Lipman J, Tett SE, Deldot ME, Kirkpatrick CM. 2011. Population pharmacokinetics of fluconazole in critically ill patients receiving continuous venovenous hemodiafiltration: using Monte Carlo simulations to predict doses for specified pharmacodynamic targets. Antimicrob Agents Chemother 55:5868–5873. doi: 10.1128/AAC.00424-11. [DOI] [PMC free article] [PubMed] [Google Scholar]