

Abstract
The ongoing development of new antimalarial drugs and the increasing use of controlled human malaria infection (CHMI) studies to investigate their activity in early-stage clinical trials require the development of methods to analyze their pharmacodynamic effect. This is especially so for studies where quantitative PCR (qPCR) is becoming the preferred method for assessing parasite clearance as the study endpoint. We report the development and validation of an analytic approach for qPCR-determined parasite clearance data. First, in a clinical trial with the licensed antimalarial combination sulfadoxine-pyrimethamine (S/P), qPCR data were collected from 12 subjects and used to determine qPCR replicate variability and to identify outliers. Then, an iterative analytic approach based on modeling the log-linear decay of parasitemia following drug treatment was developed to determine the parasite reduction ratio (PRR) and parasite clearance half-life, both measures of parasite clearance. This analytic approach was then validated with data from 8 subjects enrolled in a second study with the licensed antimalarial drug mefloquine. By this method, the PRR and parasite clearance half-lives for S/P and Mefloquine were determined to be 38,878 (95% confidence interval [95% CI], 17,396 to 86,889) at 3.15 (95% CI, 2.93 to 3.41) days and 157 (95% CI, 130 to 189) at 6.58 (95% CI, 6.35 to 6.83) days for the respective studies. No serious adverse events occurred in the two trials, and pharmacokinetic values were within expected ranges for sulfadoxine and pyrimethamine. The robust statistical method that we have developed to analyze qPCR-derived pharmacodynamic data from CHMI studies will facilitate the assessment of the activity of a range of experimental antimalarial drugs now entering clinical trials. (This trial was registered with the Australian New Zealand Clinical Trials Registry under registration numbers ACTRN12611001203943 and ACTRN12612000323820.)
INTRODUCTION
A critical determinant of the success of antimalarial chemotherapy is the speed of clearance of parasites from the blood of infected individuals. Indeed, this pharmacodynamic relationship represents one of the few clinically validated examples in antimicrobial chemotherapy. For example, the superiority of artemisinin antimalarials over comparator drugs, such as quinine, in terms of clinical endpoints can be attributed to the more rapid clearance of parasites from the blood following artemisinin combination chemotherapy (ACT) (1). Indeed, the increasing number of reports from the Greater Mekong Delta of slower clearance of Plasmodium falciparum from the blood following ACT forebodes worsening clinical outcomes (2–5).
Quantification of parasitemia has generally relied on counting parasites on blood films. Advantages of this methodology include the ease of collection from finger prick, the low cost of consumables, and well-standardized methods. Additional useful information can be obtained from blood films, including infection with mixed parasite species, the presence of different life cycle stages, and the presence of malaria pigment in white cells. Disadvantages include the need for skilled microscopists who regularly undertake Quality Assurance Programs, the inferior sensitivity of microscopy compared to molecular techniques, and the time-consuming nature of reading multiple slides in the context of an ongoing clinical trial. Although quantitation of biomarkers of parasite biomass, such as histidine-rich protein 2, has some utility in measuring parasite biomass (6), it is not well suited for serial estimation of changes in parasite density in the context of drug treatment due to the kinetics of clearance of circulating parasite antigen differing from that of parasites (7).
Nucleic acid amplification tests (NAT) have assumed an important role in the diagnosis of a number of infectious diseases. Likewise, quantitative estimation of the concentration of pathogen target sequences in blood or other biologic samples, using quantitative PCR (qPCR), has assumed critical importance in the management of a number of viral infections. Foremost of all test cases is HIV-1, for which viral load as measured by qPCR is the critical marker of success of antiretroviral therapy (8). Likewise, qPCR for measurement of the level of malaria parasitemia has been developed as a means of monitoring parasite growth and clearance in clinical trials of drugs and vaccines (9, 10). Although some quantitative assays have used nucleic acid sequence-based amplification techniques (NASBA), most now employ a PCR-based methodology and frequently target multicopy, highly conserved parasite gene targets, such as the 18S ribosomal DNA (rDNA) gene. Such PCR assays improve sensitivity 10- to 100-fold over that of blood films, as well as offer the ability to batch and automate processing and sample analysis, potentially with the use of robotic equipment now found in many modern clinical diagnostic laboratories (11, 12).
Until recently, parasite clearance time (PCT), as determined by microscopy, has been the predominant endpoint that has been reported in clinical trials. In many such studies, there has, however, been a paucity of reporting of measures of quality of slide reading, such as reporting the limit of detection, the number of blood film fields read, and the frequency of collection of blood films. In a recent paper, Flegg et al. proposed a standardized method for the reporting of parasite clearance, as determined by blood films, in clinical trials (13).
However, additional considerations apply when parasite clearance analysis is undertaken by qPCR. In addition to technical issues related to the qPCR method used, which will not be addressed here, considerations such as reproducibility of assay data, how many biologic and analytic replicates should be tested, acceptable limits of variation in replicates, and management of the limit of detection (LOD) all apply.
Parasite clearance following antimalarial drug treatment follows a log-linear decay curve, consisting of three stages: the lag phase, log-linear decay, and the tail phase (14) (Fig. 1). The log-linear decay in the middle of the decay profile has been suggested to have the least interindividual variance, and the slope of the log-linear relationship of parasitemia over time can provide a relatively robust estimate of parasite clearance (14). The parasite reduction ratio (PRR), a mathematical representation of the ratio of the parasite density between admission and 48 h posttreatment (15), has been proposed as a means of describing the decay of parasitemia. The PRR and the mathematically related parasite clearance half-life (t1/2) are derived from the slope of the clearance curve. These are less subject to methodological problems or other confounders, such as the influence of starting parasitemia on clearance time, than the previously used PCT (14).
FIG 1.
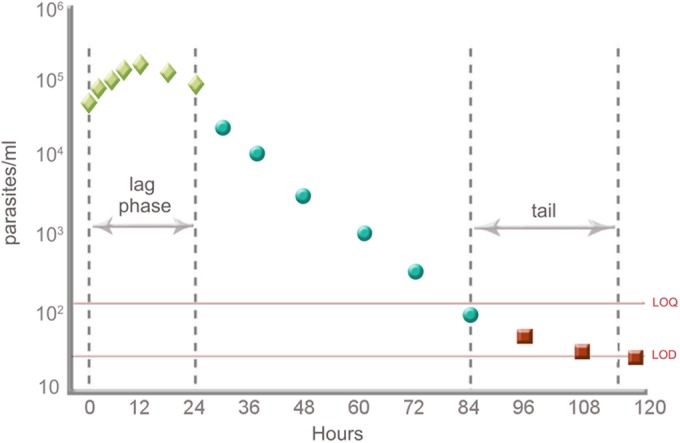
Effect of lag phase and tail exclusion on the calculation of the clearance rate constant. (Modified from reference 13 with permission of the author.)
In this paper, we used parasite clearance data from two clinical trials to develop and then validate a methodology to analyze parasite clearance after antimalarial chemotherapy, specifically as it applies to parasitemia data collected by qPCR rather than by microscopy. An important characteristic of the study design of these trials is the relatively rich data collected from small cohorts of subjects deliberately infected with blood-stage malaria parasites (induced blood-stage malaria [IBSM]) (10, 16), rather than from a larger group of patients with natural malaria parasite exposure enrolled in a clinical trial in a setting of endemicity, where parasite clearance data are generally collected by less frequent blood film examination. The details of the modeling strategy to obtain the most efficient subject-specific PRR estimate and corresponding drug- and dose (cohort)-specific PRR estimates are reported. Second, we report the safety and pharmacokinetic profiles of both sulfadoxine and pyrimethamine (S/P) in the first clinical trial.
MATERIALS AND METHODS
Two single-center, uncontrolled studies of IBSM infection were undertaken as described previously (10). Healthy, nonsmoking malaria-naive adult volunteers between 18 and 45 years of age were enrolled. In the first study, two cohorts of six subjects each were treated orally once only with three tablets of S/P (500 mg/25 mg; Fansidar, Roche Products Pty. Limited). The plasma concentrations of the two antimalarial drugs were determined at time points 0, 0.5, 2, 4, 8, 12, 18, 24, 36, 48, 72, and 96 h using a high-performance liquid chromatography assay (17), and noncompartmental pharmacokinetic analysis was undertaken to estimate the maximum concentration of the drugs in serum (Cmax), time to maximum concentration (Tmax), half-life (t1/2), and area under the curve (AUC). To optimize estimation of clearance of parasitemia, blood sampling for qPCR was designed to be most intensive at the early stages after treatment (0, 0.5, 2, 4, 8, 12, 18, 24, 36, and 48 h). Clinical evaluation, safety biochemistry, and hematology laboratory testing were conducted at screening, prior to malaria inoculation (day 0), upon entry to the clinic prior to confinement for antimalarial treatment, upon exit from confinement, and on day 28 or the end-of-study visit. This trial was registered with the Australian New Zealand Clinical Trials Registry under registration number ACTRN12611001203943.
A second study of identical design was undertaken with a single group of eight subjects, with mefloquine (Lariam; Roche Products Pty Limited) administered as a single dose of 10 mg/kg of body weight. For this second study, data reported here are restricted to the parasitemia data (time points 0, 2, 4, 8, 12, 24, 30, 36, 48, 60, 72, 84, 96, 108, 120, and 144 h) for the purpose of validation of the methods developed; full details of this study will be reported elsewhere. Adverse-event data were classified and aggregated using the NCI's common terminology criteria for adverse events (CTCAE), version 4 (18). This second trial was registered with the Australian New Zealand Clinical Trials Registry under registration number ACTRN12612000323820. The two clinical trials reported here were approved by the Queensland Institute of Medical Research Human Research Ethics Committee.
Details of the qPCR assay for assessment of parasitemia at each of the time points used in this work have been previously published (19). Key information from this assay includes results from effectively sampling 250 μl of packed red cells and retrospectively testing all samples from a single subject in a single assay for final quantitation.
To minimize interassay variation, samples were tested in replicate on a single qPCR plate. This enabled estimation of assay replicate variability and the development of a set of guidelines to identify sample outliers in future qPCR analyses. To calculate an estimate of the expected analytic replicate variance of the qPCR assay, samples for 10 time points for each subject were analyzed by qPCR analysis in quadruplicate. Statistical modeling was performed on the log10-transformed parasitemia values using general linear models (GLMs) to estimate variation. The GLM included main effects and an interaction for the subject and time (in hours) from antimalarial treatment to take into account the repeated measurements on the subject. The mean square error (MSE) of the GLM was used as the estimate of the variance of the replicates. The variance of the PCR replicates (PCR assay replicate variance) was estimated as the pooled variance from S/P cohorts 1 and 2. This pooled variance estimate is expected to be stable and therefore could be used as the expected qPCR assay replicate variance. The derived estimated assay replicate variability was used to develop a set of guidelines to identify outliers in future qPCR samples. The guidelines were developed to determine if the observed variability of samples when tested by qPCR in duplicate, triplicate, or quadruplicate is excessive compared to the expected assay replicate variability.
The within-sample variance in parasitemia of the replicates was calculated for every subject and time point (SO2), where O stands for “observed.” The rule for determining a sample outlier was based on a variance ratio test that compares the observed replicate variability in a qPCR sample to the expected assay replicate variability by the F test. The F test is defined as follows:
| (1) |
where SE2 is the expected assay replicate variance estimated previously, α is the significance level, n0 is the number of replicates for the observed sample (i.e., duplicates, triplicates, or quadruplicates), and nE is the number of replicates used to calculate the replicate variability (assumed to be infinity).
Correction for multiple testing was incorporated into the rule, as each subject contributed multiple samples over time. The test statistic was adjusted for multiple testing by using Bonferroni correction to the significance level, such that the corrected test statistic is given by the equation
| (2) |
where N is the total number of time points for which the subject has parasitemia above the LOD. By rearranging equations 1 and 2, the minimum observed analytic replicate variance that will indicate a qPCR sample outlier can be determined when there is a significant difference between the observed replicate variability and the expected assay replicate variability. When this violation is detected at any time point, the qPCR assay is required to be repeated for all samples for that subject.
Once potential outliers had been appropriately handled, the replicate parasitemia data were next cleaned to take into account parasitemia values where a derived value fell below the LOD or tests returned a negative value. For any replicate parasitemia values below the LOD, the value was substituted with LOD/2 (20). For any values that were not detected (ND), the value was replaced with 1 such that when the data were log10 transformed, ND was equal to log10(1), which is equal to 0. If all replicates for a subject within a time point were ND, the first time point with all values ND was included in model fitting and all subsequent time points were set to missing, regardless of whether parasitemia values increased afterwards due to potential recrudescence. The data used for all subsequent model selection and fitting were comprised of the arithmetic mean of the replicate log10 parasitemia value per time point per subject up to the first time all replicates were not detected.
Statistical analysis entailed two steps: an initial calculation of the decay rate (slope coefficient from the log-linear decay regression) for each individual and then calculation of the weighted average slope estimate and corresponding standard error using the inverse-variance method (21) to obtain a cohort-specific PRR estimate and 95% confidence interval (95% CI). Before calculating the PRR, it was necessary to deal with the lag and tail phases (13, 14) of the parasitemia decay profile (Fig. 1). To achieve this, an algorithm was developed to remove potential lag and/or tail phases in order to determine the optimal log-linear decay regression. The algorithm considers removing parasitemia data points in an iterative process from both ends of the parasitemia curve, i.e., by a combination of right censoring (removing values from the tail phase) and left censoring (removing values from the lag phase), and uses model selection techniques to find the optimal log-linear regression.
The algorithm to obtain the log-linear decay for each subject is based on the log-linear regression detailed in equation 3, where time is the number of hours since administration of antimalarial treatment (time = 1,…, m), and β0 and β1 are the intercept and slope estimates, respectively.
| (3) |
Based on the cleaned and processed parasitemia data for each subject, the iterative algorithm to determine the optimal log-linear decay for each subject is summarized in Table 1. The iterative algorithm is continued until a minimum of four observations are available. The optimal log-linear regression model for a subject was deemed an appropriate fit if the overall model P value was less than 0.001.
TABLE 1.
Iteration process to determine the optimal log-linear decay curve
| Step | Process for each subject |
|---|---|
| 1 | Fit the full model; i.e., fit a linear regression (as defined by equation 3) to all m parasitemia values of subject i |
| 2 | Fit two models; i.e., fit the linear regression model to m − 1 parasitemia values by (i) removing the first observation and (ii) removing the last observation |
| 3 | Determine the best model of steps 2i and ii, defined as the model corresponding to the minimum overall model P value |
| 4 | Of the best model defined in step 3, repeat steps 2 and 3 in an iterative process until a minimum of four observations have been taken |
| 5 | Of the m − 3 best models selected per iteration (including the full model [step 1]), the optimal model is defined by the minimum overall model P value |
Estimating the subject-specific PRR.
The slope and corresponding standard error estimate of the optimal linear regression model for subject i was used to calculate the subject PRR estimate and corresponding 95% CI, as shown in equations 4 and 5, respectively.
| (4) |
| (5) |
where β1,i and SE(β1,i) are the slope and corresponding standard error of the slope parameter of the optimal linear regression model, respectively.
Estimating study-specific PRR.
The average PRR and corresponding 95% CI for each cohort were estimated by using the inverse-variance method (21) to calculate the weighted average linear regression slope (β1) and corresponding standard error [SE(β1)]. The cohort-specific PRR calculation is based only on the s subjects with the optimal regression model having a P value of ≤0.001. The weighted average slope for s subjects in the cohort is given in equation 6, where the weight is the inverse of the squared standard error [wi = 1/SE(β1,i)2] for i, which is equal to 1, …s.
| (6) |
The standard error of is estimated as SE() = . Therefore, the cohort-specific PRR (PRRc) and corresponding 95% confidence interval are shown in equations 7 and 8, respectively.
| (7) |
| (8) |
Parasite clearance t1/2.
The parasite clearance half-life is a characteristic of a mono-exponential decline and is seen within other natural systems, e.g., the decay of a radioisotope, the decline in drug concentrations, etc. The half-life is a transformation of the gradient (per time, equivalent to PRR) into a time period. The relationship between PRR and parasite reduction t1/2 is a simple transformation of the PRR,
| (9) |
where the PRR48 is the parasitemia ratio estimated over a 48-h interval that is subsequently transformed into a per-hour gradient.
Comparison of study-specific PRRs.
To determine whether there are differences between study-specific PRRs, an omnibus test for between-group differences is used (22). The test is used to assess whether there are differences in the weighted mean slope of the J studies, using the following test statistic:
| (10) |
where j equals 1, …, J. The weight for the jth cohort is denoted by for subject i in cohort j. The is the weighted average slope for cohort j as defined in equation 6, and β̄.. is the weighted grand mean given by
| (11) |
Post hoc pairwise comparisons can be calculated using the test statistic , where G is the contrast (G = c1 + … + ) and vG is the variance of the contrast . The P value of the L pairwise comparisons can be calculated using the Scheffe method, by comparing ZG2 to a chi-squared distribution with L − 1 degrees of freedom.
Software implementation.
All data processing and statistical analyses were performed in R (version 2.12).
RESULTS
Safety outcome of the clinical trial.
Twelve male volunteers (11 Caucasian and 1 Asian) were enrolled in a clinical trial of the activity of sulfadoxine-pyrimethamine (S/P) in the IBSM challenge model. The median age, weight, height, and body mass index (BMI) of these 12 subjects were 24 years, 83 kg, 183 cm, and 24.7 kg/m2, respectively. The safety outcome of this study is presented in detail in the supplemental material (see Table S1). A total of 57 adverse events, none of which were serious adverse events, were reported during the conduct of the S/P study. Twenty-two of these were related to clinical malaria, and 15 were assessed as possibly and 7 as probably related. Of these 22 adverse events, 6 were headache, 3 were fatigue, 3 were fever, 2 were myalgia, 2 were neck pain/stiffness, and 1 each was rigors, dizziness, arthralgia, malaise, body ache, and nausea (Table S1). These adverse events were transient and resolved with either paracetamol or without treatment. One adverse event was assessed as possibly related to the S/P (a metallic taste 30 min after treatment). The remaining 34 adverse events were assessed as unlikely or unrelated to either malaria or the antimalarial treatment. No clinically significant deviations in vital signs from the normal range were detected. Likewise, no echocardiogram abnormalities were reported in any of the volunteers during the study. Apart from transient falls in neutrophil counts in three volunteers (nadirs of 2.0, 1.4, and 1.9), no clinically significant derangements in laboratory results were detected. Details of the clinical study with mefloquine will be reported elsewhere.
Parasite clearance and pharmacokinetic profiles.
The 12 subjects in the S/P study became qPCR positive on either day 6 or day 7 following the inoculation and then followed the expected increasing sinusoidal pattern up to treatment, with values reaching the qPCR treatment threshold of 1,000 parasites/ml on day 9 and day 10; on this day, the subjects were administered the designated single-dose treatment, with rapid clinical and parasitological response, as shown in Fig. 2a. Levels of parasitemia reduced rapidly from their peak level, and all subjects except one became PCR negative by 48 h after drug administration. For this final subject, parasitemia did not disappear after retreatment with artemether-lumefantrine (Riamet) but cleared after primaquine therapy, suggesting that this low-level parasitemia was due to gametocytemia. The pharmacokinetic profiles of pyrimethamine and sulfadoxine are shown in Fig. 2b and c and pharmacokinetic parameters presented in Table 2. The average elimination half-lives of pyrimethamine and sulfadoxine in the subjects were 7.3 and 3.9 days, respectively. The Cmax values were 135 mg/liter and 714 μg/liter for sulfadoxine and pyrimethamine, respectively. These pharmacokinetic profiles are similar to previously published data (23, 24). A full description of the mefloquine study, including details of adverse events and pharmacokinetics, will be reported elsewhere (submitted for publication).
FIG 2.
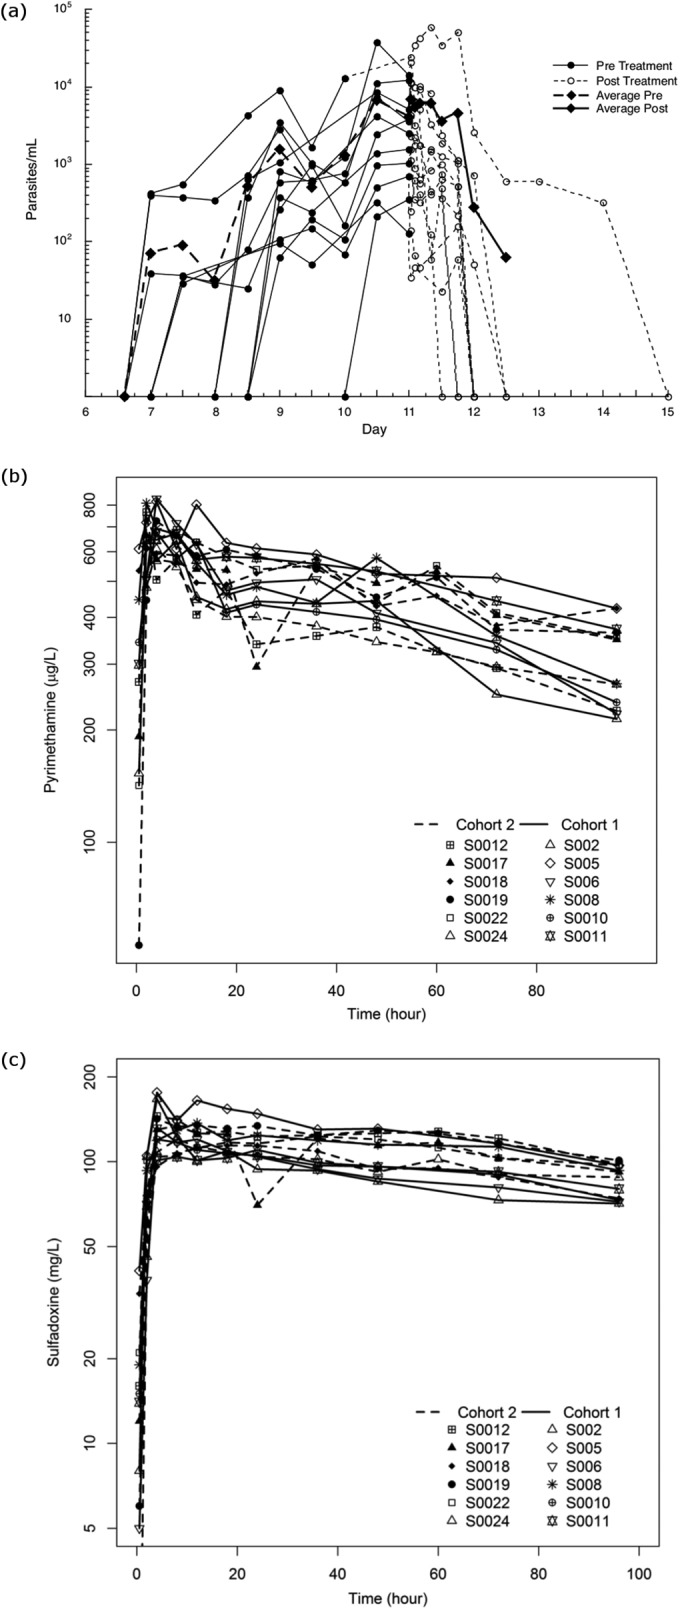
Parasitemia curves and pharmacodynamic profiles for the 12 subjects administered sulfadoxine-pyrimethamine. (a) Pre- and posttreatment parasitemia curves; (b and c) pharmacokinetic profiles for pyrimethamine (25-mg dose) and sulfadoxine (500-mg dose), respectively. Average Pre and Average Post, average at pretreatment and posttreatment, respectively.
TABLE 2.
Pharmacokinetic measures as means and corresponding ranges for Cmax, Tmax, t1/2, and AUC measurements of sulfadoxine and pyrimethamine
| Drug | Mean (range)a |
||||
|---|---|---|---|---|---|
| Cmax | Tmax (h) | t1/2 (days) | AUC0–96 | AUC0–∞ | |
| Sulfadoxine | 135 mg/liter (110–176) | 10.8 (4–36) | 7.3 (4.9–13.2) | 10,044 (8,422–12,244) | 31,848 (21,705–49,365) |
| Pyrimethamine | 714 μg/liter (610–832) | 3.8 (2–8) | 3.9 (2.1–6.5) | 42,701 (33,922–53,872) | 87,786 (51,612–140,201) |
AUC0–96 and AUC0–∞, AUC from 0 to 96 h and from 0 h to infinity, respectively.
qPCR analytic replicate variability.
The variance estimate of the analytic replicates determined from the pooled variance from S/P cohorts 1 and 2 was calculated as 0.0207 (parasites/ml)2. This estimated analytic replicate variability was used to establish the rules to identify PCR sample outliers (equations 2 to 3), and appropriate cutoff points are presented in Table S2 in the supplemental material. For example, the critical value for analytic variance is 0.1634 (parasites/ml)2 when there are duplicate samples from 10 time points and a P value of 0.05 is used (Table S2). Hence, if any of the analytic variance estimates exceed this critical value for any of the 10 time points, an outlier is identified. The consequence is reanalysis by qPCR for duplicate samples of all 10 time points for this subject. From practical experience, violation of this rule is a rare occurrence, and this may partly be explained by the controlled experimental design that we utilize.
Optimal linear-decay modeling.
To assess the performance of calculating subject- and cohort-specific PRRs, the proposed algorithm detailed in Table 1 was applied to each subject in both the S/P and the mefloquine study data sets. Figure 3 shows an example of fitting the algorithm to parasitemia data from a subject treated with single-dose mefloquine (10 mg/kg), for whom 13 valid parasitemia values were available for model fitting after data cleaning and preparation. Figure 3a to k show the plot of parasitemia over time of the best model for each of the 10 iterations (including the full model) and show that the optimal fit, corresponding to the smallest overall model fit P value (P = 0.00005), is iteration 5 (Fig. 3f).
FIG 3.

Example of the algorithm to determine the optimal log-linear decay for subject MQ-16, treated with mefloquine at 10 mg/kg (as a single dose). Linear-regression fit of log10 parasitemia over time for each iteration of the algorithm. (a) The first iteration fits the regression model to all the data. (b) Best model after removal of observations from either the lag or tail phase from panel a. The data show that the best fit corresponds to removal from the lag phase. (c) The best fit is after removal of another observation from lag phase and continues on until panel j, where the final model fits a linear regression to the minimum 4 observations. A total of 10 iterations was performed, and the optimal model corresponding to the minimum P value is iteration 5 (f), which involved removing the first three observations and the last observation shown in panel a. Pr, probability.
Of the 12 subjects in the S/P study, seven subjects (S02, S05, S06, S10, S11, S19, S24) had significant optimal regression models (P ≤ 0.001) that could contribute to the cohort-specific PRR calculation. The optimal regression model fit and subject-specific PRR estimates of the seven subjects are presented in Fig. 4, and the S/P PRR estimate is 38,878 (corresponding 95% CI, 17,396 to 86,889). The corresponding parasite clearance half-life for S/P was calculated as 3.15 (95% CI, 2.93 to 3.41) days. The optimal regression model fit of the five subjects who did not have significant optimal regression models are displayed in Fig. S3 in the supplemental material. Of the five subjects excluded from the S/P PRR estimate, the optimal regression P values ranged from 0.002 to 0.02. Two subjects (SP-08, SP-17) had high intrasubject variability, two had fewer than 6 positive parasitemia values (SP-12, SP-18), and one (SP-22) had an extremely low starting parasitemia.
FIG 4.

Optimal regression models for sulfadoxine-pyrimethamine subjects, with significant regression fits.
All eight subjects in the mefloquine study had significant optimal regression models, and the results from these subjects therefore contributed toward the mefloquine-specific PRR estimate. The optimal regression model fit and subject-specific PRR estimates are presented in Fig. 5, and the mefloquine study PRR estimate is 157 (corresponding 95% CI, 130 to 189). The corresponding parasite clearance half-life for mefloquine was calculated as 6.58 (95% CI, 6.35 to 6.83) days.
FIG 5.

Optimal regression models for subjects in the mefloquine study, with significant regression fits.
The slope estimates of the log-linear regression of S/P (β1 = –0.096) and mefloquine (β1 = –0.046) studies were significantly different (QB = 171; P value < 0.001). This indicates that S/P results in faster parasite clearance than mefloquine.
DISCUSSION
There is a growing consensus in the malaria drug development and drug resistance communities that measures of drug efficacy in clinical trials, specifically the rate of parasite clearance, need to be standardized and based on robust parasitological and statistical methods. This is particularly the case with the increasing concern regarding diminished rates of parasite clearance in the Greater Mekong Delta following ACT (2–5). It also represents a critical methodological aspect of clinical trials for assessment of new antimalarial drugs, whether such trials are undertaken in controlled human malaria infection (CHMI) studies or in settings of endemicity with “natural” infection. To this end, the World Wide Antimalarial Resistance Network (WWARN) parasite clearance estimator, described by Flegg et al. (13) and available online (http://www.wwarn.org/tools-resources/toolkit/analyse/parasite-clearance-estimator-pce), represents a valuable tool for undertaking this analysis in a standardized way and, further, for curating clearance data for the malaria chemotherapy community.
In a manner similar to that of documented standards for characterization of pharmacokinetic parameters, a full characterization of the accuracy in estimating the gradient of parasite clearance should be available. Reporting of results should ideally include minimum-fit criteria, the number of subjects excluded from reporting a PRR, the time period used for regression, the number of time points used in the regression, and the handling of values where the parasitemia is below the limit of quantification and the first nondetectable results. These aspects determine the reliability of the reported PRR and its interpretation. Additionally, plots of the data would facilitate independent assessment of how well a reported gradient reflects the overall data. In studies conducted subsequent to this study in which we used the methodology described here, we further optimized the logistic aspects of undertaking IBSM studies and also integrated pharmacokinetic and pharmacodynamic data to model the relationship between these for experimental antimalarial drugs (unpublished). These include optimizing the timing of administration of the test antimalarial so as to approach the maximal safe level of parasitemia in this system, qPCR testing in triplicate, and rich sampling over the first 24 h after drug administration. These improvements have provided the opportunity to collect several data points before approaching the limit of quantification, thereby facilitating modeling while preserving volunteer safety. Factors such as timing of drug administration to defined points in the parasite life cycle have also been investigated. As a consequence of these improvements, we rarely see subject-specific data failing quality assurance by the methods described here.
The method described here differs from the WWARN estimator in a number of ways. First, our method is designed to enumerate parasite density in blood by using qPCR rather than by microscopic examination of blood slides. Handling of assay replicates from qPCR-derived data requires defining a set of rules to determine outliers based on assay replicate variability, with a requirement to retest biologic samples where replicate variability falls outside a prespecified range. However, in the rare situation where a biologically implausible result is obtained (perhaps due to assay failure or qPCR contamination), additional assessment of the consistency of results with immediately preceding and succeeding measurements as incorporated in the WWARN estimator could be beneficial.
Second, our method specifically models and censors both the lag and the tail phase within the iterative process. As articulated by White (14), a robust method for defining the end of the lag phase and the beginning of the tail phase is of major importance in terms of defining the PRR. By including parasitemia values below the limit of detection and nondetectable values, information about the tail is retained and can provide a model for the entire decay profile. By incorporating both right and left censoring and not restricting ourselves to left censoring only, the proposed method is not restricted to potential anchoring issues that may arise if too much weight is given to the tail region. The right censoring of our method can then remove any potential tails in a standardized way. This differs from the WWARN calculator in that the last value included in the model is determined by either replacing a nondetectable value with the limit of detection or removing repeated values below a threshold.
Third, our method is based solely on linear regression and does not use tobit models to account for the potential censoring of values below the limit of detection or nondetectable values. It has been suggested that only substantial differences between the results of using a tobit regression and a linear regression will occur when the last recorded parasitemia value before the censored value is high (13). However, as our screening method incorporates values below the limit of detection and nondetectable values, the differences between the last parasitemia value and the censored values is expected to be negligible. Finally, our proposed method identifies and removes potential lag phases without the need to incorporate higher-order polynomials and assess potential convex curvature.
The PRR or the mathematically related parasite clearance half-life should reflect the maximum rate of parasitemia reduction and should specifically exclude the influence of the lag or tail phase (Fig. 1) independently of their causation. The lag in drug effect is not unique to antimalarial chemotherapy and can be drug related, being influenced by the pharmacokinetic profile of the drug, i.e., to drug absorption into the circulation and/or distribution into the efficacy biophase, in this case the blood. A number of malaria-specific effects also apply. First, many antimalarials are believed to exert their pharmacodynamic effect at specific phases in the parasite life cycle (25). Indeed, it is the loss of activity of the artemisinin antimalarials in the early stages of the parasite life cycle that is believed to underlie the slow-clearance phenotype reported in the Greater Mekong Delta. Another related consideration is that in IBSM trials, parasitemia is synchronous; i.e., parasites are together in the same life cycle stage. Therefore, administration of drug in a clinical trial at different time points in the parasite's 48-h life cycle is likely to influence the lag effect. In addition to life cycle-specific drug susceptibility, the effect of parasite sequestration and the related rapid rise in parasite counts following erythrocyte rupture may exert a confounding effect on the assessment of drug activity if the lag phase is not objectively addressed.
Additional considerations apply at the tail of the parasite clearance curve, specifically how to handle the limit of quantification and limit of detection. Again, these issues are not unique to malaria or to diagnostic pathology, and a literature regarding statistical approaches to this issue exists (26, 27). However, the “tailing” in parasitemia reduction can have specific relevance in malaria beyond stochastic variation at the detection limit of the test or in association with the statistical approach adopted to address the issue. As concentration of the antimalarial falls below the minimum parasiticidal concentration, the parasite reduction decelerates and is observed as a tail. Tailing may occur at parasitemia levels approaching the limit of quantification but also above the limits of detection. The limit of quantification is determined as the assay limits when replicate variance is greater than a coefficient of variation of 20%. Parasitemia values at these levels can be considered inaccurate but informative. However, any trend observed with these concentrations should be considered in light of their inaccuracy.
It is important to differentiate between parasitemia values below the limit of detection and nondetect values. The nondetect values provide additional information about the tail phase of the parasitemia decay profile, such as by identifying the first time point that parasitemia levels are not detectable by qPCR. Techniques to deal with values below the LOD exist and include substitution methods (20), quantile regression, and tobit regression (28). The impact of substituting qPCR values below the LOD with LOD/2 has been assessed by performing sensitivity analyses. The sensitivity analyses considered different substitution techniques, including no substitution, , and LOD. Sensitivity analysis suggests minimal difference in results of estimating both subject-specific and cohort-specific PRR values (results not shown). There is scope for further work to appropriately include values below the LOD.
To facilitate comparison, the data from studies analyzed here were submitted for analysis using the WWARN estimator. Both unprocessed and processed data for the two data sets were submitted. The unprocessed data were defined as the raw mean of the data from replicates, and the processed data were defined as the cleaned and processed back-transformed mean of the log10 data from replicates. In comparison to the WWARN method, our method generally resulted in slope estimates that were within the estimates based on the unprocessed and processed data (see Table S4 in the supplemental material). In the S/P study, four subjects (SP-02, SP-06, SP-10, SP-19) had significant models for both the WWARN calculator and our method, and in one case (SP-02), the results for the processed WWARN and our method were identical, as there were no points below the LOD and no lag phase identified. Three subjects (SP-08, SP-12, SP-17) were excluded from our model yet could be analyzed in the WWARN calculator; conversely, three subjects (SP-05, SP-11, SP-24) could be analyzed in our model but were excluded from analysis with the WWARN calculator. Two subjects (SP-18 and SP-22) were not estimated in either method. The cohort-specific PRR based on subjects with significant regression models in our method (PRR = 38,878) was within the WWARN estimates for the unprocessed (PRR = 1437) and processed (PRR = 105,110) data. In the mefloquine study, all subjects except for one (MQ-25) had significant models for both the WWARN and our method. Subject MQ-25 was analyzed in our model but was excluded from the analysis in the WWARN method. The cohort-specific PRR for our method (PRR = 157) was within the WWARN estimates for the unprocessed (PRR = 33) and processed (PRR = 228) data.
It is therefore reassuring that the two different methods for assessing the pharmacodynamic activities of antimalarial drugs result in estimates of similar magnitudes. It should be noted, however, that significant processing of PCR data tested in replicate is required before input into the WWARN calculator. In this respect, with the field moving toward molecular methods for parasite quantification, a method such as the one described here or a modification to the WWARN calculator to facilitate input of PCR-derived data would be desirable.
The method described here enables detection of outliers based on the variability within qPCR replicates. This is appropriate in most situations. However, there may be scenarios where there are biological outliers at successive time points (i.e., subject MQ-08). For example, in the method described by Flegg et al. (13), values that were not consistent with the two immediately preceding and succeeding measurements are censored, with consistency determined by comparing the rate of change in parasitemia at the time point to the average rate in the subject profile. It is possible that an additional check of consistency between time points could further enhance the method described here. Equally, it should not be used to exclude true variance outside these two phases. Parasitemia responses that are intrinsically variable or display trends that are not mono-exponential should be identified, and while a log-linear regression is ideal, it should not be applied with exclusion of data outside a true tail or lag phase.
The analytic method reported here is specific for the study of drug action in IBSM. Although methodological aspects, such as replicates and reproducibility, are of some relevance to IBSM studies, such as those in which proof of parasitemia is the study endpoint and where parasite multiplication rate in the setting of a blood-stage vaccine is being tested, equally stringent methodological considerations will apply. This method documents the maximum velocity of parasite clearance and does not capture the full pharmacodynamic relationship between parasite and drug concentration, something that can be done by more formal pharmacokinetic/pharmacodynamic analysis. The outstanding pharmacodynamic characteristics include the lag phase and drug potency. Drug potency is often characterized by the 50% inhibitory concentration (IC50), although in the malaria and infectious disease area, the surrogates maximum parasiticidal concentration (MPC) and MIC are used. The MPC is the drug concentration above which the parasite clearance is maximal; as drug levels fall below it, the clearance decelerates. The approach described here may also provide an estimate of MPC which can serve as prior information for further analysis. The described log-linear regression required to calculate the PRR also identifies the period that the parasitemia displays a maximum log-linear clearance of parasites. The time point marking the end of this regression (especially when recrudescence may follow) may signal when the MPC is reached in the drug concentration. Extension of this work should include additional semimechanistic aspects added to the regression which serve to model growth data (when it exists) and the onset of drug action, including any synchronous behavior. A more comprehensive pharmacokinetic/pharmacodynamic model-based approach should be used for characterizing parasitemia and the influence of an antimalarial. This will require further changes in collecting optimal data and the collation of a model suitable for the simultaneous characterization of drug pharmacokinetic profiles and the resultant pharmacodynamic effects.
Conclusion.
The statistical method that we have developed provides a robust method to objectively analyze qPCR-derived pharmacodynamic data from CHMI studies. Application of this method in studies aimed at assessing the activities of a range of experimental antimalarial drugs now entering clinical trial will facilitate the selection of specific drugs to take further into development, as well as the dose and dose regimen to be tested in phase II efficacy studies.
Supplementary Material
ACKNOWLEDGMENTS
This work was supported by an NHMRC practitioner fellowship and a Government of Queensland clinical research fellowship to J.S.M. and by The Medicines for Malaria Venture.
Footnotes
Supplemental material for this article may be found at http://dx.doi.org/10.1128/AAC.04942-14.
REFERENCES
- 1.Dondorp AM, Fanello CI, Hendriksen IC, Gomes E, Seni A, Chhaganlal KD, Bojang K, Olaosebikan R, Anunobi N, Maitland K, Kivaya E, Agbenyega T, Nguah SB, Evans J, Gesase S, Kahabuka C, Mtove G, Nadjm B, Deen J, Mwanga-Amumpaire J, Nansumba M, Karema C, Umulisa N, Uwimana A, Mokuolu OA, Adedoyin OT, Johnson WB, Tshefu AK, Onyamboko MA, Sakulthaew T, Ngum WP, Silamut K, Stepniewska K, Woodrow CJ, Bethell D, Wills B, Oneko M, Peto TE, von Seidlein L, Day NP, White NJ. 2010. Artesunate versus quinine in the treatment of severe falciparum malaria in African children (AQUAMAT): an open-label, randomised trial. Lancet 376:1647–1657. doi: 10.1016/S0140-6736(10)61924-1. [DOI] [PMC free article] [PubMed] [Google Scholar]
- 2.Amaratunga C, Sreng S, Suon S, Phelps ES, Stepniewska K, Lim P, Zhou C, Mao S, Anderson JM, Lindegardh N, Jiang H, Song J, Su XZ, White NJ, Dondorp AM, Anderson TJ, Fay MP, Mu J, Duong S, Fairhurst RM. 2012. Artemisinin-resistant Plasmodium falciparum in Pursat province, western Cambodia: a parasite clearance rate study. Lancet Infect Dis 12:851–858. doi: 10.1016/S1473-3099(12)70181-0. [DOI] [PMC free article] [PubMed] [Google Scholar]
- 3.Ashley EA, Dhorda M, Fairhurst RM, Amaratunga C, Lim P, Suon S, Sreng S, Anderson JM, Mao S, Sam B, Sopha C, Chuor CM, Nguon C, Sovannaroth S, Pukrittayakamee S, Jittamala P, Chotivanich K, Chutasmit K, Suchatsoonthorn C, Runcharoen R, Hien TT, Thuy-Nhien NT, Thanh NV, Phu NH, Htut Y, Han KT, Aye KH, Mokuolu OA, Olaosebikan RR, Folaranmi OO, Mayxay M, Khanthavong M, Hongvanthong B, Newton PN, Onyamboko MA, Fanello CI, Tshefu AK, Mishra N, Valecha N, Phyo AP, Nosten F, Yi P, Tripura R, Borrmann S, Bashraheil M, Peshu J, Faiz MA, Ghose A, Hossain MA, Samad R, Rahman MR, Hasan MM, Islam A, Miotto O, Amato R, MacInnis B, Stalker J, Kwiatkowski DP, Bozdech Z, Jeeyapant A, Cheah PY, Sakulthaew T, Chalk J, Intharabut B, Silamut K, Lee SJ, Vihokhern B, Kunasol C, Imwong M, Tarning J, Taylor WJ, Yeung S, Woodrow CJ, Flegg JA, Das D, Smith J, Venkatesan M, Plowe CV, Stepniewska K, Guerin PJ, Dondorp AM, Day NP, White NJ, Tracking Resistance to Artemisinin Collaboration (TRAC). 2014. Spread of artemisinin resistance in Plasmodium falciparum malaria. N Engl J Med 371:411–423. doi: 10.1056/NEJMoa1314981. [DOI] [PMC free article] [PubMed] [Google Scholar]
- 4.Dondorp AM, Nosten F, Yi P, Das D, Phyo AP, Tarning J, Lwin KM, Ariey F, Hanpithakpong W, Lee SJ, Ringwald P, Silamut K, Imwong M, Chotivanich K, Lim P, Herdman T, An SS, Yeung S, Singhasivanon P, Day NP, Lindegardh N, Socheat D, White NJ. 2009. Artemisinin resistance in Plasmodium falciparum malaria. N Engl J Med 361:455–467. doi: 10.1056/NEJMoa0808859. [DOI] [PMC free article] [PubMed] [Google Scholar]
- 5.Phyo AP, Nkhoma S, Stepniewska K, Ashley EA, Nair S, McGready R, ler Moo C, Al-Saai S, Dondorp AM, Lwin KM, Singhasivanon P, Day NP, White NJ, Anderson TJ, Nosten F. 2012. Emergence of artemisinin-resistant malaria on the western border of Thailand: a longitudinal study. Lancet 379:1960–1966. doi: 10.1016/S0140-6736(12)60484-X. [DOI] [PMC free article] [PubMed] [Google Scholar]
- 6.Noedl H, Wongsrichanalai C, Miller RS, Myint KS, Looareesuwan S, Sukthana Y, Wongchotigul V, Kollaritsch H, Wiedermann G, Wernsdorfer WH. 2002. Plasmodium falciparum: effect of anti-malarial drugs on the production and secretion characteristics of histidine-rich protein II. Exp Parasitol 102:157–163. doi: 10.1016/S0014-4894(03)00051-1. [DOI] [PubMed] [Google Scholar]
- 7.Marquart L, Butterworth A, McCarthy JS, Gatton ML. 2012. Modelling the dynamics of Plasmodium falciparum histidine-rich protein 2 in human malaria to better understand malaria rapid diagnostic test performance. Malar J 11:74. doi: 10.1186/1475-2875-11-74. [DOI] [PMC free article] [PubMed] [Google Scholar]
- 8.Li TS, Tubiana R, Katlama C, Calvez V, Ait Mohand H, Autran B. 1998. Long-lasting recovery in CD4 T-cell function and viral-load reduction after highly active antiretroviral therapy in advanced HIV-1 disease. Lancet 351:1682–1686. doi: 10.1016/S0140-6736(97)10291-4. [DOI] [PubMed] [Google Scholar]
- 9.Lawrence G, Cheng QQ, Reed C, Taylor D, Stowers A, Cloonan N, Rzepczyk C, Smillie A, Anderson K, Pombo D, Allworth A, Eisen D, Anders R, Saul A. 2000. Effect of vaccination with 3 recombinant asexual-stage malaria antigens on initial growth rates of Plasmodium falciparum in non-immune volunteers. Vaccine 18:1925–1931. doi: 10.1016/S0264-410X(99)00444-2. [DOI] [PubMed] [Google Scholar]
- 10.McCarthy JS, Sekuloski S, Griffin PM, Elliott S, Douglas N, Peatey C, Rockett R, O'Rourke P, Marquart L, Hermsen C, Duparc S, Mohrle J, Trenholme KR, Humberstone AJ. 2011. A pilot randomised trial of induced blood-stage Plasmodium falciparum infections in healthy volunteers for testing efficacy of new antimalarial drugs. PLoS One 6:e21914. doi: 10.1371/journal.pone.0021914. [DOI] [PMC free article] [PubMed] [Google Scholar]
- 11.Mens PF, Sawa P, van Amsterdam SM, Versteeg I, Omar SA, Schallig HD, Kager PA. 2008. A randomized trial to monitor the efficacy and effectiveness by QT-NASBA of artemether-lumefantrine versus dihydroartemisinin-piperaquine for treatment and transmission control of uncomplicated Plasmodium falciparum malaria in western Kenya. Malar J 7:237. doi: 10.1186/1475-2875-7-237. [DOI] [PMC free article] [PubMed] [Google Scholar]
- 12.Murphy SC, Prentice JL, Williamson K, Wallis CK, Fang FC, Fried M, Pinzon C, Wang R, Talley AK, Kappe SH, Duffy PE, Cookson BT. 2012. Real-time quantitative reverse transcription PCR for monitoring of blood-stage Plasmodium falciparum infections in malaria human challenge trials. Am J Trop Med Hyg 86:383–394. doi: 10.4269/ajtmh.2012.10-0658. [DOI] [PMC free article] [PubMed] [Google Scholar]
- 13.Flegg JA, Guerin PJ, White NJ, Stepniewska K. 2011. Standardizing the measurement of parasite clearance in falciparum malaria: the parasite clearance estimator. Malar J 10:339. doi: 10.1186/1475-2875-10-339. [DOI] [PMC free article] [PubMed] [Google Scholar]
- 14.White NJ. 2011. The parasite clearance curve. Malar J 10:278. doi: 10.1186/1475-2875-10-278. [DOI] [PMC free article] [PubMed] [Google Scholar]
- 15.White NJ. 1997. Assessment of the pharmacodynamic properties of antimalarial drugs in vivo. Antimicrob Agents Chemother 41:1413–1422. [DOI] [PMC free article] [PubMed] [Google Scholar]
- 16.Engwerda CR, Minigo G, Amante FH, McCarthy JS. 2012. Experimentally induced blood stage malaria infection as a tool for clinical research. Trends Parasitol 28:515–521. doi: 10.1016/j.pt.2012.09.001. [DOI] [PubMed] [Google Scholar]
- 17.Bell DJ, Nyirongo SK, Molyneux ME, Winstanley PA, Ward SA. 2007. Practical HPLC methods for the quantitative determination of common antimalarials in Africa. J Chromatogr B Analyt Technol Biomed Life Sci 847:231–236. doi: 10.1016/j.jchromb.2006.10.020. [DOI] [PubMed] [Google Scholar]
- 18.US Department of Health and Human Services. 2010. Common terminology criteria for adverse events (CTCAE), version 4.03. National Cancer Institute, National Institutes of Health, US Department of Health and Human Services, Washington, DC: http://evs.nci.nih.gov/ftp1/CTCAE/CTCAE_4.03_2010-06-14_QuickReference_5x7.pdf. [Google Scholar]
- 19.Rockett RJ, Tozer SJ, Peatey C, Bialasiewicz S, Whiley DM, Nissen MD, Trenholme K, Mc Carthy JS, Sloots TP. 2011. A real-time, quantitative PCR method using hydrolysis probes for the monitoring of Plasmodium falciparum load in experimentally infected human volunteers. Malar J 10:48. doi: 10.1186/1475-2875-10-48. [DOI] [PMC free article] [PubMed] [Google Scholar]
- 20.Beal SL. 2001. Ways to fit a PK model with some data below the quantification limit. J Pharmacokinet Pharmacodyn 28:481–504. doi: 10.1023/A:1012299115260. [DOI] [PubMed] [Google Scholar]
- 21.Hartung J, Knapp G, Sinha B. 2008. Statistical meta-analysis with applications, p 35–41. John Wiley & Sons, Inc, Hoboken, NJ. [Google Scholar]
- 22.Konstantopoulos S, Hedges LV. 2009. Analysing effect sizes: fixed-effects models, p 279–294. In Cooper H, Hedges LV, Valentine JC (ed), The handbook of research synthesis and meta-analysis, 2nd ed Russell Sage Foundation, New York, NY. [Google Scholar]
- 23.Barnes KI, Little F, Smith PJ, Evans A, Watkins WM, White NJ. 2006. Sulfadoxine-pyrimethamine pharmacokinetics in malaria: pediatric dosing implications. Clin Pharmacol Ther 80:582–596. doi: 10.1016/j.clpt.2006.08.016. [DOI] [PubMed] [Google Scholar]
- 24.Weidekamm E, Plozza-Nottebrock H, Forgo I, Dubach UC. 1982. Plasma concentrations in pyrimethamine and sulfadoxine and evaluation of pharmacokinetic data by computerized curve fitting. Bull World Health Organ 60:115–122. [PMC free article] [PubMed] [Google Scholar]
- 25.ter Kuile F, White NJ, Holloway P, Pasvol G, Krishna S. 1993. Plasmodium falciparum: in vitro studies of the pharmacodynamic properties of drugs used for the treatment of severe malaria. Exp Parasitol 76:85–95. doi: 10.1006/expr.1993.1010. [DOI] [PubMed] [Google Scholar]
- 26.Senn S, Holford N, Hockey H. 2012. The ghosts of departed quantities: approaches to dealing with observations below the limit of quantification. Stat Med 31:4280–4295. doi: 10.1002/sim.5515. [DOI] [PubMed] [Google Scholar]
- 27.Bergstrand M, Karlsson M. 2009. Handling data below the limit of quantification in mixed effects models. AAPS J 11:371–380. doi: 10.1208/s12248-009-9112-5. [DOI] [PMC free article] [PubMed] [Google Scholar]
- 28.Tobin J. 1958. Estimation of relationships of limited dependent variables. Econometrica 26:24–36. doi: 10.2307/1907382. [DOI] [Google Scholar]
Associated Data
This section collects any data citations, data availability statements, or supplementary materials included in this article.