

Abstract
Background
Mass drug administration (MDA), defined as the empiric administration of a therapeutic antimalarial regimen to an entire population at the same time, has been a historic component of many malaria control and elimination programmes, but is not currently recommended. With renewed interest in MDA and its role in malaria elimination, this review aims to summarize the findings from existing research studies and program experiences of MDA strategies for reducing malaria burden and transmission.
Objectives
To assess the impact of antimalarial MDA on population asexual parasitaemia prevalence, parasitaemia incidence, gametocytaemia prevalence, anaemia prevalence, mortality and MDA‐associated adverse events.
Search methods
We searched the Cochrane Infectious Disease Group Specialized Register, the Cochrane Central Register of Controlled Trials (CENTRAL), MEDLINE+, EMBASE, to February 2013. We also searched CABS Abstracts, LILACS, reference lists, and recent conference proceedings.
Selection criteria
Cluster‐randomized trials and non‐randomized controlled studies comparing therapeutic MDA versus placebo or no MDA, and uncontrolled before‐and‐after studies comparing post‐MDA to baseline data were selected. Studies administering intermittent preventive treatment (IPT) to sub‐populations (for example, pregnant women, children or infants) were excluded.
Data collection and analysis
Two authors independently reviewed studies for inclusion, extracted data and assessed risk of bias. Studies were stratified by study design and then subgrouped by endemicity, by co‐administration of 8‐aminoquinoline plus schizonticide drugs and by plasmodium species. The quality of evidence was assessed using the GRADE approach.
Main results
Two cluster‐randomized trials, eight non‐randomized controlled studies and 22 uncontrolled before‐and‐after studies are included in this review. Twenty‐two studies (29 comparisons) compared MDA to placebo or no intervention of which two comparisons were conducted in areas of low endemicity (≤5%), 12 in areas of moderate endemicity (6‐39%) and 15 in areas of high endemicity (≥ 40%). Ten studies evaluated MDA plus other vector control measures. The studies used a wide variety of MDA regimens incorporating different drugs, dosages, timings and numbers of MDA rounds. Many of the studies are now more than 30 years old.
Areas of low endemicity (≤5%)
Within the first month post‐MDA, a single uncontrolled before‐and‐after study conducted in 1955 on a small Taiwanese island reported a much lower prevalence of parasitaemia following a single course of chloroquine compared to baseline (1 study, very low quality evidence). This lower parasite prevalence was still present after more than 12 months (one study, very low quality evidence). In addition, one cluster‐randomized trial evaluating MDA in a low endemic setting reported zero episodes of parasitaemia at baseline, and throughout five months of follow‐up in both the control and intervention arms (one study, very low quality evidence).
Areas of moderate endemicity (6‐39%)
Within the first month post‐MDA, the prevalence of parasitaemia was much lower in three non‐randomized controlled studies from Kenya and India in the 1950s (RR 0.03, 95% CI 0.01 to 0.08, three studies, moderate quality evidence), and in three uncontrolled before‐and‐after studies conducted between 1954 and 1961 (RR 0.29, 95% CI 0.17 to 0.48, three studies,low quality evidence).
The longest follow‐up in these settings was four to six months. At this time point, the prevalence of parasitaemia remained substantially lower than controls in the two non‐randomized controlled studies (RR 0.18, 95% CI 0.10 to 0.33, two studies, low quality evidence). In contrast, the two uncontrolled before‐and‐after studies found mixed results: one found no difference and one found a substantially higher prevalence compared to baseline (not pooled, two studies, very low quality evidence).
Areas of high endemicity (≥40%)
Within the first month post‐MDA, the single cluster‐randomized trial from the Gambia in 1999 found no significant difference in parasite prevalence (one study, low quality evidence). However, prevalence was much lower during the MDA programmes in three non‐randomized controlled studies conducted in the 1960s and 1970s (RR 0.17, 95% CI 0.11 to 0.27, three studies, moderate quality evidence), and within one month of MDA in four uncontrolled before‐and‐after studies (RR 0.37, 95% CI 0.28 to 0.49, four studies,low quality evidence).
Four trials reported changes in prevalence beyond three months. In the Gambia, the single cluster‐randomized trial found no difference at five months (one trial, moderate quality evidence). The three uncontrolled before‐and‐after studies had mixed findings with large studies from Palestine and Cambodia showing sustained reductions at four months and 12 months, respectively, and a small study from Malaysia showing no difference after four to six months of follow‐up (three studies,low quality evidence).
8‐aminoquinolines
We found no studies directly comparing MDA regimens that included 8‐aminoquinolines with regimens that did not. In a crude subgroup analysis with a limited number of studies, we were unable to detect any evidence of additional benefit of primaquine in moderate‐ and high‐transmission settings.
Plasmodium species
In studies that reported species‐specific outcomes, the same interventions resulted in a larger impact on Plasmodium falciparum compared to P. vivax.
Authors' conclusions
MDA appears to reduce substantially the initial risk of malaria parasitaemia. However, few studies showed sustained impact beyond six months post‐MDA, and those that did were conducted on small islands or in highland settings.
To assess whether there is an impact of MDA on malaria transmission in the longer term requires more quasi experimental studies with the intention of elimination, especially in low‐ and moderate‐transmission settings. These studies need to address any long‐term outcomes, any potential barriers for community uptake, and contribution to the development of drug resistance.
22 March 2019
Update pending
Authors currently updating
The update is due to be published in 2019.
Plain language summary
Administration of antimalarial drugs to whole populations
Malaria is the most important mosquito‐borne disease caused by a parasite, accounting for an estimated 660,000 deaths annually. Fortunately, malaria is both preventable and treatable. Several malaria control tools currently exist, and new and innovative approaches are continually under development.
The administration of drugs against malaria to whole populations, termed mass drug administration (MDA), was a component of many malaria elimination programmes in the 1950s, and is once again attracting interest as a malaria elimination tool. As a consequence, it is important to review the currently available literature in order to assess the potential for this strategy to reduce malaria burden and transmission, and to identify gaps in our understanding.
This review assessed the impact of MDA on several malaria‐specific outcome measures. Thirty‐two studies were included in this review, from sites in Asia, Africa, Europe and the Americas.
The review found that although MDA can reduce the initial risk of malaria‐specific outcomes, these reductions are often not sustained. However, a few studies conducted on small islands or in highland areas did show sustained impact more than six months after MDA.
Adverse events were inadequately addressed in most studies. Notable severe drug reactions, including haemolysis, haemoglobinuria, severe anaemia and death, were reported with 8‐aminoquinoline plus schizonticide drug co‐administration, while severe skin reactions were reported with sulphadoxine‐pyrimethamine plus artesunate plus primaquine.
Assessing the true impact of MDA programmes can be a challenge due to the heterogeneity of the study methods employed. Nonetheless, this review can help guide future antimalarial MDA interventions and their evaluation.
Background
Description of the condition
Malaria causes an estimated 219 million clinical episodes and 660,000 deaths annually, primarily among young children in sub‐Saharan Africa (WHO 2012). Four main species of the malaria parasite infect humans: Plasmodium falciparum, P. vivax, P. ovale, and P. malariae. P. falciparum and P. vivax cause the majority of infections, with P. falciparum responsible for most cases of severe and potentially fatal malaria.
Malaria is both preventable and treatable. Prevention efforts have focused on vector control strategies to reduce adult mosquito populations and human‐mosquito contact, and to eradicate mosquito breeding grounds. These strategies include the use of insecticide treated nets (ITNs), indoor residual spraying (IRS), larviciding, and environmental management. In addition, treatment strategies in endemic areas frequently combine case management, and the diagnosis and treatment of clinically ill malaria patients, with disease prevention. This involves administering antimalarial drugs to particularly vulnerable population groups, such as pregnant women, infants and non‐immune travellers to endemic areas, to prevent clinical disease.
Success in malaria control using these existing tools has led to renewed interest in the possibility of malaria elimination in some countries or regions. Although the Global Malaria Eradication Program of the mid‐20th century was ultimately abandoned, current calls for elimination stress the need for new technologies (insecticide delivery systems, new drugs and insecticides, and candidate vaccines) and the revitalization of older strategies (IRS and larviciding). Mass drug administration (MDA) was a component of many malaria elimination programmes during the eradication era, but it is not currently recommended due to concerns about efficacy, logistical feasibility, sustainability and the risk of accelerating drug resistance (WHO 2010). However, these concerns are not supported by firm evidence, particularly in light of the development of new antimalarial drugs (WHO 2007).
Description of the intervention
For nearly a century, antimalarial drugs have been used in a variety of ways to prevent infection. While the aim of early antimalarial drug distribution studies was to interrupt transmission, this was rarely accomplished. The empiric use of antimalarial drugs to prevent malaria can be generally grouped into three, sometimes overlapping categories: 1) chemoprophylaxis, where drugs are administered at suppressive doses throughout the defined period; 2) intermittent preventive treatment (IPT), where a full curative dose of an antimalarial is given to a target population at specified times; or 3) MDA, where drugs are administered to the whole population either using full therapeutic courses, known as direct MDA, or through the fortification of dietary salt, known as indirect MDA (Greenwood 2004; von Seidlein 2003).
Chemoprophylaxis has been found to be highly effective at reducing mortality and morbidity from malaria in highly endemic areas, but this approach is often difficult to sustain and at times has impaired the development of natural immunity (Greenwood 2004). These difficulties and perceived risks of implementing chemoprophylaxis drove many programmes that began in the 1990s towards targeted drug administration via IPT to populations at high risk of infection (such as pregnant women). There is considerable overlap amongst the three strategies for preventing malaria, and the term MDA has been used to describe varying approaches, from using full therapeutic doses to fortifying foods, and with varying objectives, from decreasing malaria morbidity to interrupting transmission.
Over the past 20 years, MDA has been a key strategy for controlling or eliminating highly‐prevalent neglected tropical diseases (NTDs) such as lymphatic filariasis, soil transmitted helminthes, onchocerciasis, schistosomiasis, and trachoma. The simultaneous administration of essential medicines to target high‐prevalence NTDs has two main functions: to treat prevalent infection and subsequently to reduce further transmission within the population (Hotez 2009). Mass antimalarial drug administration, defined as the empiric administration of a therapeutic course of an antimalarial regimen to an entire population at the same time without screening or diagnostic testing prior to administration, has been used for malaria control since the early 1930s and was advocated by the World Health Organization (WHO) in the 1950s as a tool in situations where other more conventional control measures had failed (von Seidlein 2003 GMB).
Most early programmes did not clearly define whether their main aim was to interrupt transmission or to control disease. While programmes that attempted to interrupt transmission nearly always failed, there are several examples where MDA, in combination with other malaria control measures, had some success. For instance, MDA with sulfalene‐pyrimethamine combined with IRS achieved high levels of initial malaria control during a research project in Garki, Northern Nigeria, in 1969 (Molineaux 1980 NGA). In addition, the use of MDA with other malaria control interventions succeeded in interrupting malaria transmission for both P. falciparum and P. vivax on the island of Aneityum in Vanuatu (Kaneko 2000 VUT). Primaquine, the only registered drug that can eliminate gametocytes, was given in combination with chloroquine to an estimated 70% of Nicaragua's population in 1981, preventing an estimated 9200 cases of malaria (Garfield 1983 NIC). In these instances, the entire population was simultaneously treated with a therapeutic dose of an antimalarial in a single or multiple rounds both to reduce malaria burden and potentially to interrupt transmission.
How the intervention might work
Malaria transmission is dependent on mosquito vector dynamics, the proportion of humans with peripheral gametocytaemia, and the infectiousness of circulating gametocytes to mosquitoes. MDA of antimalarials might reduce malaria burden by its direct effect on individuals who receive a treatment dose of antimalarials; it may also reduce rates of transmission in several different ways. First, MDA could reduce parasitaemia prevalence and potentially reduce malaria transmission by inhibiting the liver or asexual intra‐erythrocytic stages of the parasite, thereby reducing the number of parasites that can progress to form gametocytes. Second, the antimalarial drug could have a direct effect on gametocytes. Third, the antimalarial drug could inhibit the sporogonic cycle in the mosquito. If every member of a given population is treated by antimalarial MDA then one would expect an immediate reduction in asexual parasite prevalence in the population, and possibly a sustained reduction in the population parasite prevalence if there was a concomitant reduction in transmission.
Most antimalarial drugs target the asexual blood stages of the parasite life cycle, as these stages are responsible for symptomatic disease. Blood schizonticidal drugs reduce asexual parasitaemia and possibly early stage gametocytes in P. falciparum by preventing the development of mature gametocytes, without having a direct effect on circulating mature gametocytes. Some antimalarial drugs, such as the artemisinins and 8‐aminoquinolines (eg primaquine), have known gametocytocidal activities and have the potential to reduce transmission by reducing circulating gametocytaemia. In addition, primaquine is the only currently available drug with unique activity against mature gametocytes and the hypnozoite stage of P. vivax and P. ovale species, reducing the possibility of relapse (WHO 2010).
Why it is important to do this review
Since its wider application in the 1950s and 1960s, the use of MDA as a malaria control tool has fallen out of favour due to concerns over its efficacy, logistical feasibility, and sustainability, and over the risk of accelerating drug resistance. But with a renewed interest in malaria elimination, limitations of currently available diagnostic tools, and the development of new antimalarials that have some gametocytocidal effect, such as the artemisinins, MDA is once again being considered as a tool for malaria elimination (Feachem 2009). Given this renewed interest in conducting MDAs, it is important to review the currently available literature to assess the potential for this strategy to reduce malaria burden and transmission. In addition, a systematic review of the literature will allow us to define the gaps in our understanding of the potential benefits and risks of this strategy, such as the risk of adverse drug events in populations given MDA. This information could then guide both the design of future antimalarial MDA interventions and their evaluation.
Objectives
To assess the impact of antimalarial MDA on population asexual parasitaemia prevalence, parasitaemia incidence, gametocytaemia prevalence, anaemia prevalence, mortality and MDA‐associated adverse events.
Methods
Criteria for considering studies for this review
Types of studies
We assessed randomized and non‐randomized studies, including cluster‐randomized trials, non‐randomized controlled studies and uncontrolled before‐and‐after studies, that measured at least one outcome of interest in the target population.
Types of participants
Children and adults living in malaria endemic areas. Due to the nature of the intervention, only studies that were carried out on entire populations at the same time were included. Studies where participants left the malaria endemic area during the study period or studies administering IPT to a sub‐population, such as pregnant women, children or infants, were excluded.
Types of interventions
Intervention
For the purposes of this review, MDA was defined as the empiric administration of a therapeutic course (doses greater than the standard prophylactic regimens) of an antimalarial regimen to an entire population at the same time without screening or diagnostic testing prior to administration.
A therapeutic dose was defined as a dose greater than the current standard prophylactic dose (ie chloroquine or amodiaquine at 300 mg of base weekly; pyrimethamine at 25 mg weekly; proguanil at 100 mg daily; mepacrine at 300 mg weekly in one dose or 700 mg weekly in daily doses of 100 mg; and quinine at 325 mg twice a day) (WHO 1951; WHO 1963).
Controls
1. No MDA or placebo for cluster‐randomized trials and non‐randomized controlled studies.
2. Baseline up to one year prior to intervention for uncontrolled before‐and‐after studies.
Studies that included other malaria co‐interventions (eg ITNs, IRS, source reduction activities and environmental management) and non‐malaria co‐interventions (eg MDA campaigns for other neglected tropical diseases and mass nutritional supplementation activities such as vitamin A distribution) were included. Studies using an indirect approach to MDA, where antimalarials are added to essential foodstuffs, usually dietary salt, were excluded.
Types of outcome measures
Primary outcomes
Parasitaemia prevalence
Parasitaemia incidence
Secondary outcomes
Gametocytaemia prevalence
Anaemia prevalence
Mortality
Adverse events related to MDA using WHO definitions (Edwards 2000)
Search methods for identification of studies
Electronic searches
Search strategy for identification of studies
We attempted to identify all relevant studies regardless of language or publication status (published, unpublished, in press, ongoing).
Databases
We searched the following databases: Cochrane Infectious Disease Group Specialized Register; Cochrane Central Register of Controlled Trials (CENTRAL), published in The Cochrane Library; MEDLINE+; EMBASE; CABS Abstracts; and LILACS, using the search strategy detailed in Appendix 1. The final search was conducted on February 6, 2013.
Searching other resources
Reference lists
We checked the reference lists of all studies and articles identified by the above methods, as well as references listed in review articles (Greenwood 2004; von Seidlein 2003; Shanks 2012).
Conference proceedings
We searched the following recent conference proceedings for relevant abstracts: Fifth MIM Pan‐African Malaria Conference (Nairobi, Kenya, November 2009); the 58th Annual American Society of Tropical Medicine and Hygiene Conference (Washington, D.C., November 2009); the 59th Annual American Society of Tropical Medicine and Hygiene Conference (Atlanta, G.A., November 2010); the 60th Annual American Society of Tropical Medicine and Hygiene Conference (Philadelphia, P.A., November 2011); and the 61st Annual American Society of Tropical Medicine and Hygiene Conference (Atlanta, G.A., November 2012).
Researchers and organizations
In addition to the electronic searches described above, we contacted additional experts in the field to identify both published and unpublished studies that might be available from other sources.
Data collection and analysis
Selection of studies
Two authors independently screened the titles and abstracts of the search results for potentially relevant studies. We retrieved the full report of any study identified by at least one author as potentially eligible. Two authors then reviewed the full reports of all retrieved studies and independently assessed eligibility using an eligibility form based on the inclusion and exclusion criteria. A third author resolved any discrepancies between the first two authors. We assessed all foreign language papers for eligibility. Excluded studies and the reasons for their exclusion were reported.
Data extraction and management
Using a pre‐tested data extraction form, two authors independently extracted information on the study characteristics, including the parasite species of interest, study design, setting (country, transmission season, and endemicity), MDA regimen and coverage, duration of follow‐up, methods for ensuring comparability between sites in multi‐site studies, and outcomes. We resolved disagreements between the two primary authors by consulting with a third author.
We extracted dichotomous data (parasitaemia prevalence, gametocytaemia prevalence and anaemia) and rate data (parasitaemia incidence and mortality). In all studies, parasite and gametocyte prevalence were assessed by microscopy. Anaemia was defined as per the definition (eg hematocrit < 33%) in the von Seidlein 2003 GMB study.
Cluster‐randomized trials
We extracted clustered‐adjusted measures of effect and a standard error when the study was adjusted for clustering. If the study did not adjust for clustering or report the intra‐cluster correlation coefficient for dichotomous outcomes, the number of persons with events, the number analyzed and the number randomized in each group was extracted. For count outcomes, we extracted the number of episodes and the person‐time risk in each group. The number sampled was calculated as the sum of participants in both the intervention and comparison groups at specified time points.
Non‐randomized controlled studies
For non‐randomized controlled trials, we extracted the number of persons with events, the number analyzed and the number randomized in each group for dichotomous data. For count outcomes, we extracted the number of episodes and the person time at risk in each group. We included pre‐intervention data up to one year prior to the intervention. While all post‐MDA data were included, they are reported according to our designated time points (eg < 1 month, 1‐3 months, etc). The number sampled was calculated as the sum of participants in both the intervention and comparison groups at specified time points.
Uncontrolled before‐and‐after studies
For uncontrolled before‐and‐after studies, we extracted the number of persons with events, the number analyzed and the number in each group for dichotomous data (ie baseline pre‐intervention data compared to during MDA or post‐MDA measurements). For count outcomes, we extracted the number of episodes and the person time at risk in each group. The number sampled was calculated as the number of participants post‐MDA at specified time points.
Assessment of risk of bias in included studies
Two authors independently assessed the risk of bias for both cluster‐randomized trials and non‐randomized controlled studies and uncontrolled before‐and‐after studies using an assessment form. We assessed all studies for random sequence generation, allocation concealment, baseline imbalance, contamination protection, blinding of participants and personnel, blinding of outcome assessment, incomplete outcome data, selective reporting, and other potential threats to validity. Authors assessed each element separately and classified as 'low risk of bias', 'high risk of bias' or 'unclear'; details are presented in a separate risk of bias table for each study. In addition, we present a risk of bias summary and a risk of bias graph. We resolved disagreements between the two primary authors by consulting with a third author.
Measures of treatment effect
We reported the findings in a summary of findings table for all outcomes of interest. For cluster‐randomized trials and non‐randomized controlled studies, we estimated risk ratios between intervention and control groups. For uncontrolled before‐and‐after studies, we estimated risk ratios against the pre‐intervention risk. We combined reports for specific Plasmodium species into one composite malaria outcome for the overall analysis, but conducted a subgroup analysis comparing outcomes for P. falciparum and P. vivax separately. We adjusted for the contribution of studies with more than one comparison to the overall estimate. Outcomes were reported for all age groups whenever available. However, some studies reported outcomes in children only or in a sample of the treated population.
Unit of analysis issues
Cluster‐randomized trials and non‐randomized controlled studies
None of the studies reported the design effect or intra‐cluster correlation coefficient needed to calculate valid associated variances for the estimates of interest. Thus, we were unable to adjust for clustering.
In addition, non‐randomized controlled studies often have few intervention groups/clusters and face the risk of imbalance between groups.
For studies with multiple arms that were included in a meta‐analysis more than once, the data was adjusted to account for multiple comparisons.
All estimates were individually analyzed and thus their associated confidence intervals (CIs) need to be cautiously interpreted as unduly narrow.
Uncontrolled before‐and‐after studies
Similarly, all estimates were individually analyzed and so their associated CIs need to be cautiously interpreted as unduly narrow. Pre‐intervention risk was determined from the presented baseline data. When multiple baseline data were presented, the data for the most recent year prior to MDA was used.
Dealing with missing data
It should be noted that for many of the studies MDA was applied widely, although data were only collected on a cross‐sectional sample of the entire treated population. Therefore, we have not attempted to apply imputation measures for working with missing data. If data from studies were insufficient, unclear or missing, we attempted to contact study investigators to obtain additional information.
Assessment of heterogeneity
Heterogeneity was assessed by summarizing study and patient characteristics across studies and by inspecting the forest plots for overlapping CIs. The I2 statistic with a level of 50%, denoting moderate levels of heterogeneity, and the Chi2 test with a P value of 0.10, indicating statistical significance, were also evaluated to assess heterogeneity.
Assessment of reporting biases
We did not assess publication bias by examining funnel plots for symmetry, since the reported associated variance of the estimates are invalid for the included cluster/population‐targeted intervention studies.
Data synthesis
We analyzed data in Review Manager (RevMan) 5.2. Analyses were stratified according to study design (ie cluster‐randomized trials, non‐randomized controlled studies or uncontrolled before‐and‐after studies) and by post‐intervention time points (ie baseline, during MDA, < 1 month post‐MDA, 1‐3 months, 4‐6 months, 7‐12 months, and > 12 months). The during MDA time point refers to situations where MDA occurred over a period of time in multiple rounds. Post‐MDA time points were chosen for their ability to assess immediate, intermediate and long‐term effects. A random‐effects approach was used if heterogeneity was detected; otherwise, a fixed‐effect approach was adopted.
Subgroup analysis and investigation of heterogeneity
We carried out subgroup analyses to explore causes of heterogeneity, grouping by co‐interventions (vector control versus no vector control), endemicity level (≤ 5%, 6‐39% and ≥ 40%), co‐administration of 8‐aminoquinoline plus schizonticide drug treatments, and plasmodium species (P. falciparum or P. vivax). Malaria endemicity classifications of low (≤ 5%), moderate (6‐39%), and high (≥ 40%) based on malaria prevalence data at baseline or the control group in children 2‐10 years of age were based on the mapping criteria proposed by the Malaria Atlas Project (Hay 2008). Study‐specific endemicity was defined preferentially using data from 1) children 2‐10 years of age, 2) children of any age, and lastly 3) all ages, depending on the available data. Subgroup analyses to evaluate heterogeneity were not possible for anaemia prevalence and mortality, due to the small number of studies.
Sensitivity analysis
Due to the heterogeneity of the studies, there were not sufficient studies to conduct a sensitivity analysis for investigating the robustness of the results to the risk of bias components.
Results
Description of studies
Results of the search
The initial search was conducted in May 2010, repeated in May 2011 and August 2012, and updated in February 2013. In total, 3048 records were identified through database searches. Of those, 372 abstracts were screened, 240 full‐text articles were assessed for eligibility, 48 publications were included in our review, and 32 unique studies were included in our final quantitative meta‐analysis. Nine of the studies included more than one comparison (different drugs, number of MDA rounds or co‐interventions) resulting in 47 comparisons. One publication has been included as two separate eligible studies (Paik 1974a SLB; Paik 1974b SLB), since it reported interventions in two different geographic settings with differing endemicities. The remaining 192 full‐text articles assessed for eligibility were excluded from analysis.
Included studies
Cluster‐randomized trials
Two cluster‐randomized trials were included: one from a setting with very low endemicity in Tanzania (< 1% prevalence) (Shekalaghe 2011 TZA) and one from a highly endemic setting in the Gambia (≥ 40% prevalence) (von Seidlein 2003 GMB).
Both studies administered a single treatment course of artesunate plus sulfadoxine‐pyrimethamine. In Tanzania, a single dose of primaquine 0.75 mg/kg was also given on day three to all participants excluding pregnant women and those with anaemia at the start of the transmission season; individuals were followed up for four months. In the Gambia study, drugs were given during the transmission season and villages were surveyed weekly for five months. The control group in both trials received a placebo.
Shekalaghe 2011 TZA reports a background rate of bed net use of 25.1% to 36.1% during the study period and an ongoing trachoma control programme; von Seidlein 2003 GMB did not report on ITN or IRS use in the study areas. Shekalaghe 2011 TZA administered the drugs at the start of the transmission season whereas von Seidlein 2003 GMB administered drugs during the transmission season.
Non‐randomized controlled studies
We included eight non‐randomized controlled studies, of which six were conducted in Africa more than 30 years ago (Escudie 1962 BFA; Jones 1958 KEN; Molineaux 1980 NGA; Najera 1973 NGA; Roberts 1964 KEN; Schneider 1961 BFA), one was from India in the 1950s (Singh 1953 IND) and one was from Vanuatu in the 1990s (Kaneko 2000 VUT). Of the seven studies comparing MDA to no MDA, three studies (seven comparisons) were from high endemicity settings (≥ 40% prevalence) (Escudie 1962 BFA; Molineaux 1980 NGA; Schneider 1961 BFA) and four studies (five comparisons) were from moderate endemicity settings (6‐39% prevalence) (Jones 1958 KEN; Najera 1973 NGA; Roberts 1964 KEN; Singh 1953 IND). Four studies (six comparisons) compared MDA with vector control measures (Kaneko 2000 VUT; Escudie 1962 BFA; Molineaux 1980 NGA; Schneider 1961 BFA).
The drugs used, dosages and frequency, and number of MDA rounds varied across the studies. One study gave a single dose of pyrimethamine (Roberts 1964 KEN) and one study gave pyrimethamine every six months for three rounds (Jones 1958 KEN). One study gave amodiaquine alone every two weeks for five rounds (Singh 1953 IND), one study gave sulfalene‐pyrimethamine alone every two to ten weeks for three rounds (Molineaux 1980 NGA) and one study gave chloroquine plus pyrimethamine every two months for 11 rounds (Najera 1973 NGA). Three studies included primaquine in their MDA regimens. Specifically, one study gave chloroquine plus sulfadoxine‐pyrimethamine plus primaquine every month for three rounds, with weekly chloroquine and primaquine in the intervening weeks, sufficient to treat vivax hypnozoites (Kaneko 2000 VUT). One study gave chloroquine or amodiaquine, plus single dose primaquine every two weeks for 15 rounds (Schneider 1961 BFA) and one study gave amodiaquine or chloroquine, plus single dose primaquine, every two or four weeks for six months (Escudie 1962 BFA).
Two studies administered drugs during the transmission season (Escudie 1962 BFA; Singh 1953 IND) and two before or at start of the transmission season (Kaneko 2000 VUT; Roberts 1964 KEN). Four studies administered drugs for a longer duration spanning the transmission season (Jones 1958 KEN; Molineaux 1980 NGA; Najera 1973 NGA; Schneider 1961 BFA).
Three studies reported that IRS activities were underway in both intervention and control areas, and allowed estimation of the additive effect of MDA (Escudie 1962 BFA; Molineaux 1980 NGA; Najera 1973 NGA).
Uncontrolled before‐and‐after studies
The remaining studies (22 out of 32) were uncontrolled before‐and‐after studies: eight from Africa (Archibald 1960 NGA; Cavalie 1962 CMR; De Zulueta 1961 UGA; De Zulueta 1964 UGA; Gaud 1953 MAR; Houel 1954 MAR; Jones 1954 KEN; Ricosse 1959 BFA), nine from Asia (Hii 1987 MYS; Kondrashin 1985 IND; Malaria_Taiwan 1991 TWN; Metselaar 1961 PNG; Paik 1974a SLB; Paik 1974b SLB; Simeons 1938 IND; Song 2010 KHM; van Dijk 1961 PNG), four from the Americas (Cáceres Garcia 2008 VEN; Comer 1971 PAN; Gabaldon 1959 VEN; Garfield 1983 NIC) and one from Palestine (known as British Mandate Palestine at the time of the study's publication; Kligler 1931 PSE).
Of the 13 studies (15 comparisons) comparing MDA to no intervention, one was conducted in an area of low endemicity (≤ 5%) (Malaria_Taiwan 1991 TWN), seven in areas of moderate endemicity (6‐39%) (Archibald 1960 NGA; Cavalie 1962 CMR; Comer 1971 PAN; Houel 1954 MAR; Jones 1954 KEN; Metselaar 1961 PNG; van Dijk 1961 PNG) and seven in areas of high endemicity (≥ 40%) (Archibald 1960 NGA; Cavalie 1962 CMR; Gaud 1953 MAR; Hii 1987 MYS; Kligler 1931 PSE; Ricosse 1959 BFA; Song 2010 KHM). Six studies evaluated MDA plus vector control measures (De Zulueta 1961 UGA; De Zulueta 1964 UGA; Hii 1987 MYS; Metselaar 1961 PNG; Paik 1974a SLB; Ricosse 1959 BFA). The remaining six studies (Cáceres Garcia 2008 VEN; Gabaldon 1959 VEN; Garfield 1983 NIC; Kondrashin 1985 IND; Paik 1974b SLB; Simeons 1938 IND) only reported monthly incidence estimates ranging from 0.4/1000 to 156/1000. Due to the challenges of converting monthly incidence to precise endemicity estimates, these studies were analyzed separately in the meta‐analysis.
Once again, the drugs used, dosages and frequency, and number of rounds varied between studies. In brief, four studies gave pyrimethamine alone (Houel 1954 MAR, once only; Gabaldon 1959 VEN, weekly for six months; Ricosse 1959 BFA, every two weeks for eight rounds; Jones 1954 KEN, every six months for three rounds), six gave pyrimethamine plus chloroquine (Archibald 1960 NGA; Cavalie 1962 CMR; De Zulueta 1961 UGA; De Zulueta 1964 UGA; Metselaar 1961 PNG; Paik 1974a SLB) and one gave amodiaquine alone (Gaud 1953 MAR, once only). The remaining 11 studies all included primaquine or plasmoquine in the MDA regimen. One gave pyrimethamine plus primaquine every two weeks for two years (Comer 1971 PAN), one gave sulfadoxine‐pyrimethamine plus primaquine once only (Hii 1987 MYS), four gave chloroquine plus primaquine (Cáceres Garcia 2008 VEN and Garfield 1983 NIC, once only; Kondrashin 1985 IND, every six months for two rounds; Paik 1974b SLB, every three months for three rounds) and one gave artesunate‐piperaquine plus primaquine (Song 2010 KHM). The two earliest studies gave plasmoquine plus quinine every three weeks for three rounds (Kligler 1931 PSE) and atebrin plus plasmochin once only (Simeons 1938 IND). Two studies administered primaquine with the intention of treating vivax hypnozoites (Cáceres Garcia 2008 VEN; Comer 1971 PAN).
Five studies did not describe the transmission season (Hii 1987 MYS; Malaria_Taiwan 1991 TWN; Metselaar 1961 PNG; Song 2010 KHM; van Dijk 1961 PNG). Six studies administered drugs during the transmission season (Archibald 1960 NGA; Gabaldon 1959 VEN; Houel 1954 MAR; Kligler 1931 PSE; Ricosse 1959 BFA; Simeons 1938 IND), another six at the start or before the transmission season (Cáceres Garcia 2008 VEN; Cavalie 1962 CMR; Garfield 1983 NIC; Gaud 1953 MAR; Kaneko 2000 VUT; Paik 1974a SLB), and four between transmission seasons (Archibald 1960 NGA; Cavalie 1962 CMR; Kondrashin 1985 IND; Paik 1974b SLB). The remaining four studies administered drugs for a longer duration spanning the transmission season (Comer 1971 PAN; De Zulueta 1961 UGA; De Zulueta 1964 UGA; Jones 1954 KEN).
Six studies reported on interventions, which include MDA and co‐interventions such as IRS (De Zulueta 1961 UGA; De Zulueta 1964 UGA; Paik 1974a SLB; Ricosse 1959 BFA; Metselaar 1961 PNG) or ITNs (Hii 1987 MYS). These studies have been analyzed separately as they are confounded by the effect of the co‐intervention.
Excluded studies
Of the 192 excluded studies, we excluded 74 because they administered an inadequate treatment dose; 19 because they were individually‐randomized studies; 16 because they did not provide sufficient information on reported outcomes; and 16 because they did not provide sufficient information on drug administration (Figure 1). Several studies included in a previous review were excluded due to inadequate treatment doses (von Seidlein 2003 GMB). Barber 1932 is often cited as the first report of MDA, but it was excluded because plasmoquine simplex 10 mg twice a week was classified as an inadequate treatment dose (von Seidlein 2003 GMB). The excluded studies and reasons for their exclusion are given in the 'Characteristics of excluded studies' table.
1.
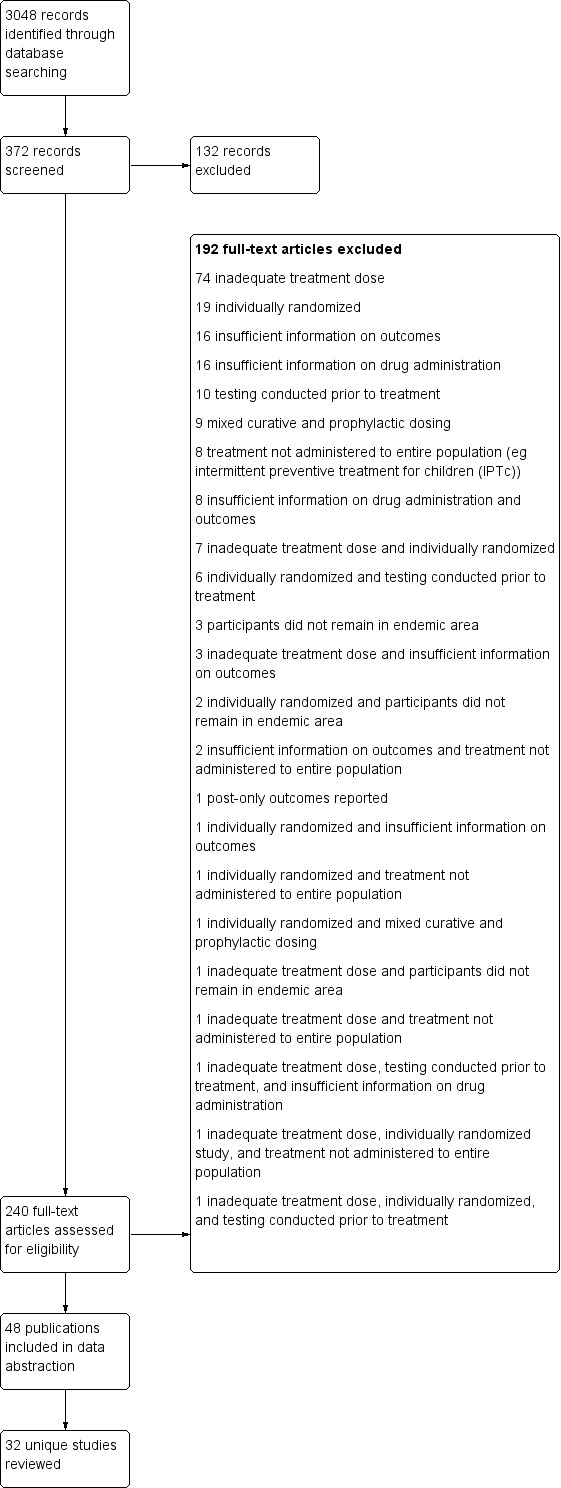
Study flow diagram.
Risk of bias in included studies
The risk of bias assessments are summarized in Figure 2 and Figure 3.
2.

Risk of bias summary: review authors' judgements about each risk of bias item for each included study.
3.

Risk of bias graph: review authors' judgements about each risk of bias item presented as percentages across all included studies.
Allocation
The two cluster‐randomized trials (Shekalaghe 2011 TZA; von Seidlein 2003 GMB) adequately randomized and concealed allocation, and are at low risk of selection bias. The non‐randomized controlled studies and the uncontrolled before‐and‐after studies are all considered at high risk of bias for random sequence generation and allocation concealment due to the non‐randomized study design. However, in addition to the two cluster‐randomized trials, three non‐randomized controlled studies (Kaneko 2000 VUT; Molineaux 1980 NGA; Schneider 1961 BFA) are at low risk of baseline imbalance between non‐randomized groups or clusters. The remaining studies are at high risk of bias for baseline imbalance due to evident baseline differences between intervention and control groups.
Blinding
The two cluster‐randomized trials used placebos and adequately blinded participants and personnel/assessors, and so were judged to be at low risk of performance and detection bias.
In seven non‐randomized controlled studies, it was unclear if outcome assessors were blinded to allocation group. One non‐randomized controlled study (Molineaux 1980 NGA) did not mention whether participants and personnel were blinded; it was unclear if this impacted the outcomes of interest. However, blood slides in this study were independently re‐examined; therefore, risk for detection bias was low. All 22 uncontrolled before‐and‐after studies were considered to be at high risk of performance bias and detection bias.
Incomplete outcome data
Attrition was low in both of the cluster‐randomized trials (Shekalaghe 2011 TZA; von Seidlein 2003 GMB) and were judged to be at low risk of bias. Of the non‐randomized controlled studies, two were judged to be at high risk of bias: one study reported that only a subset of participants were included in the evaluation of outcomes (Schneider 1961 BFA) and the other did not report intervention coverage (Singh 1953 IND). The remaining six non‐randomized controlled studies demonstrated low risk of bias.
Six uncontrolled before‐and‐after studies were considered to be at high risk of attrition bias. Two studies had large losses to follow‐up (Kligler 1931 PSE; van Dijk 1961 PNG). Furthermore, one study reported that only a subset of participants was included in the evaluation of outcomes (Houel 1954 MAR); one study had to stop MDA distribution in one study zone during the study period, which could impact results (Ricosse 1959 BFA); and one reported missing data (Song 2010 KHM). Hii 1987 MYS was also assessed to be at high risk of bias: although the entire population was treated, only a subset of 286 children were surveyed, of which only 29.7% were present at every one of the eight sessions. An additional six uncontrolled before‐and‐after studies did not provide a sufficiently adequate description to allow an assessment of attrition bias and these were judged to be 'unclear' (Cavalie 1962 CMR; De Zulueta 1964 UGA; Gaud 1953 MAR; Malaria_Taiwan 1991 TWN; Paik 1974a SLB; Paik 1974b SLB). The other 11 uncontrolled before‐and‐after studies were at low risk of bias.
Selective reporting
We found evidence of selective outcome reporting in two non‐randomized controlled studies (Kaneko 2000 VUT; Schneider 1961 BFA) and five uncontrolled before‐and‐after studies (Archibald 1960 NGA; Hii 1987 MYS; Kligler 1931 PSE; Paik 1974a SLB; Song 2010 KHM). In addition, one non‐randomized controlled trial (Roberts 1964 KEN) and seven uncontrolled before‐and‐after studies (Cavalie 1962 CMR; Gaud 1953 MAR; Houel 1954 MAR; Kondrashin 1985 IND; Metselaar 1961 PNG; Paik 1974b SLB; Ricosse 1959 BFA) did not contain enough information to assess adequately the risk of selective outcome reporting.
Contamination protection
Contamination protection was low in both of the cluster‐randomized trials (Shekalaghe 2011 TZA; von Seidlein 2003 GMB). Of the eight non‐randomized controlled studies, four demonstrated a low risk of contamination (Kaneko 2000 VUT; Molineaux 1980 NGA; Najera 1973 NGA; Roberts 1964 KEN). Another three non‐randomized controlled studies (Escudie 1962 BFA; Jones 1958 KEN; Schneider 1961 BFA) did not provide sufficient information to assess whether contamination bias was of concern. However, one study (Singh 1953 IND) did show evidence of contamination, as large numbers of labourers were repatriated to their own villages each week because of high malaria incidence. Due to the lack of a comparison group, all 22 uncontrolled before‐and‐after studies demonstrated high risk of contamination.
Other potential sources of bias
One non‐randomized controlled study (Jones 1958 KEN) and seven uncontrolled before‐and‐after studies described other sources of potential bias. In one study (Archibald 1960 NGA), anecdotes of ill effects began to circulate and evidence of the 'palming' of tablets was described by investigators. Another study (De Zulueta 1964 UGA) reported that only about half of the population was given treatment during the first administration, with the resultant low coverage likely reducing the impact of the intervention. Houel 1954 MAR provided no data on the coverage of the intervention. An additional three studies (Jones 1954 KEN; Jones 1958 KEN; Ricosse 1959 BFA) described the presence of antimalarial drug resistance. Furthermore, due to the movement of labour, there was likely an influx of P. falciparum cases that could have introduced bias in the Kondrashin 1985 IND study. Paik 1974a SLB conducted active case detection in the post‐intervention surveillance, which could have resulted in higher baseline prevalence, potentially overestimating the impact of MDA. A further three studies – two non‐randomized controlled studies (Escudie 1962 BFA; Schneider 1961 BFA) and one uncontrolled before‐and‐after study (van Dijk 1961 PNG) ‐ provided insufficient information to assess whether an important risk of bias was present. No other sources of bias were identified in the remaining studies.
Effects of interventions
Section 1: MDA vs no intervention
Comparison 1: MDA vs no MDA in areas of low endemicity (≤ 5%)
Only two studies were conducted in areas of low endemicity (≤ 5%): one cluster‐randomized trial (Shekalaghe 2011 TZA) and one uncontrolled before‐and‐after study (Malaria_Taiwan 1991 TWN). Studies ranged from targeting 1110 (Shekalaghe 2011 TZA) to 1537 (Malaria_Taiwan 1991 TWN) participants in the intervention groups. See Table 9.
1. Overview of studies conducted in areas of low endemicity.
| Study ID | Design | Country | Year | Endemicity | MDA group |
Control group/ Baseline |
|||||
| Drug (dose) | Interval | No. of rounds | Population targeted | Coverage | Co‐intervention | ||||||
| Shekalaghe 2011 | CRT | Tanzania | 2008 | 0%* | AS (4 mg/kg/day for 3 days) +SP (25 mg/1.25 mg on day 1) +PQ (0.75 mg on day 3) | ‐ | 1 | 1110 | 93% | Background ITN use | Placebo + Background ITN use |
| Malaria_Taiwan 1991 | BAS | Taiwan | 1955 | 3‐4%* | CQ (12 mg/kg) | ‐ | 1 | 1520 | ND | IRS | IRS |
CRT = Cluster‐randomized trial; BAS = Uncontrolled before‐and‐after study; AS = Artesunate; SP = Sulfadoxine‐Pyrimethamine; PQ = Primaquine; CQ = Chloroquine; ND = Not described; IRS = Indoor Residual Spraying.
*In all ages
Parasitaemia prevalence
Cluster‐randomized trials: The study from Tanzania administered a single round of MDA as a 3‐day course of artesunate (4 mg/kg/day for three days) plus sulphadoxine‐pyrimethamine (25 mg + 1.25 mg/kg as a single dose on the first day) plus primaquine (0.75 mg/kg as a single dose on the third day). All participants in both the intervention and control groups tested negative for malaria parasites at baseline and during the five months of follow‐up (1 study, number sampled 484 to 794, Analysis 1.1).
1.1. Analysis.
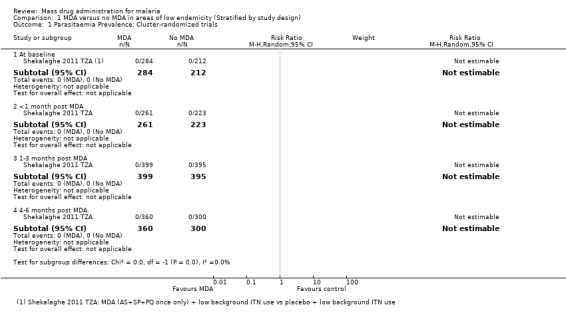
Comparison 1 MDA versus no MDA in areas of low endemicity (Stratified by study design), Outcome 1 Parasitaemia Prevalence: Cluster‐randomized trials.
Uncontrolled before‐and‐after studies: One study from a small, remote island of Taiwan administered MDA as a single dose of chloroquine (12 mg/kg). Compared to baseline data, large reductions in the prevalence of parasitaemia were reported within the first month post‐MDA (RR 0.27, 95% CI 0.14 to 0.50, 1 study, number sampled 1537, Analysis 1.2) and over several years of post‐intervention follow‐up (RR 0.02, 95% CI 0.00 to 0.12, 1 study, number sampled 2007, Analysis 1.2).
1.2. Analysis.

Comparison 1 MDA versus no MDA in areas of low endemicity (Stratified by study design), Outcome 2 Parasitaemia Prevalence: Uncontrolled before‐and‐after studies.
Parasitaemia incidence
No studies from settings with low endemicity reported malaria incidence.
Gametocytaemia prevalence
Cluster‐randomized trials: In Tanzania, no participants tested positive for gametocytes at baseline or during follow‐up (1 study, number sampled 484 to 794, Analysis 1.3).
1.3. Analysis.

Comparison 1 MDA versus no MDA in areas of low endemicity (Stratified by study design), Outcome 3 Gametocytaemia Prevalence: Cluster randomized trials.
Uncontrolled before‐and‐after studies: The Taiwan study did not report on gametocytaemia prevalence.
Comparison 2: MDA vs no MDA in areas of moderate endemicity (6% to 39%)
Four non‐randomized controlled studies (five comparisons) (Jones 1958 KEN; Najera 1973 NGA; Roberts 1964 KEN; Singh 1953 IND) and seven uncontrolled before‐and‐after studies (Archibald 1960 NGA; Cavalie 1962 CMR; Comer 1971 PAN; Houel 1954 MAR; Jones 1954 KEN; Metselaar 1961 PNG; van Dijk 1961 PNG) were conducted in areas of moderate endemicity. Study sample sizes for those targeted in the intervention groups ranged from 125 to 101,000 for non‐randomized controlled studies and between 899 and 22,500 for uncontrolled before‐and‐after studies. See Table 10. One non‐randomized controlled study (Najera 1973 NGA) and four uncontrolled before‐and‐after studies added MDA to existing IRS programs (Archibald 1960 NGA; Cavalie 1962 CMR; Houel 1954 MAR; Metselaar 1961 PNG).
2. Overview of studies conducted in areas of moderate endemicity.
| Study ID | Design | Country | Year | Endemicity | MDA group | Control group/baseline | |||||
| Drug (dose) | Interval | No. of rounds | Population targeted | Coverage | Co‐intervention | ||||||
| Najera 1973 | N‐RCS | Nigeria | 1966‐68 | 29%* | CQ (450 mg) + Pyr (45 mg) | 2 months | 11 | 52,000 | 78‐92% | IRS | IRS alone |
| Singh 1953 | N‐RCS | India | 1952‐53 | 22%* | AQ (600 mg) | 2 weeks | 5 | 125 | ND | None | No intervention |
| Jones 1958 | N‐RCS | Kenya | 1952‐53 | 34%† | Pyr (100 mg) | 6 months | 3 | 3721‐4500 | ND | None | No intervention |
| Roberts 1964 | N‐RCS | Kenya | 1953 | 28%* | Pyr (50 mg) | ‐ | 1 | 101,000 | 95% | None | No intervention |
| N‐RCS | Kenya | 1954 | 22%* | Pyr (50 mg) | ‐ | 1 | 99,000 | 95% | None | No intervention | |
| Archibald 1960 | BAS | Nigeria | 1958 | 29%† | CQ (600 mg) + Pyr (25 mg) | 1 month | 5 | 10,000 | ND | IRS | IRS |
| Cavalie 1962 | BAS | Cameroon | 1960‐61 | 20%† | CQ (600 mg) + Pyr (50 mg) | 4 months | 2 | 22,500 | 76‐92% | IRS | IRS |
| Houel 1954 | BAS | Morocco | 1953 | 14%† | Pyr (100 mg) | ‐ | 1 | 9999 | ND | IRS | IRS |
| Metselaar 1961 | BAS | New Guinea | 1958‐59 | 13‐21%† | CQ (450 mg) +Pyr (50 mg) | 1 week | 6 | 2500 | 90% | IRS | IRS |
| Jones 1954 | BAS | Kenya | 1952‐53 | 35%† | Pyr (100 mg) | 6 months | 3 | 3721 | ND | None | ‐ |
| van Dijk 1961 | BAS | Papua New Guinea | 1960 | 39%† | CQ (450 mg) | 4 weeks | 11 | 1250 | 97% | None | ‐ |
| Comer 1971 | BAS | Panama | 1965‐68 | 17%* | Pyr (50 mg / 75 mg) + PQ (40 mg) | 2 weeks | 49 | 1709 | 61‐87% | None | ‐ |
N‐RCS = Non‐randomized controlled study; BAS = Uncontrolled before‐and‐after study; AQ = Amodiaquine; Pyr = Pyrimethamine; CQ = Chloroquine; PQ = Primaquine; ND = Not described; IRS = Indoor Residual Spraying.
*In all ages
†Amongst children only
Parasitaemia prevalence
Non‐randomized controlled studies: There was evidence of baseline imbalance in parasite prevalence in all four studies, biasing the subsequent time points and leading to an over‐ or underestimate of the effect (4 studies, number sampled 3123, Analysis 2.1). These studies were conducted between 1952 and 1968 in India, Kenya and Nigeria.
2.1. Analysis.
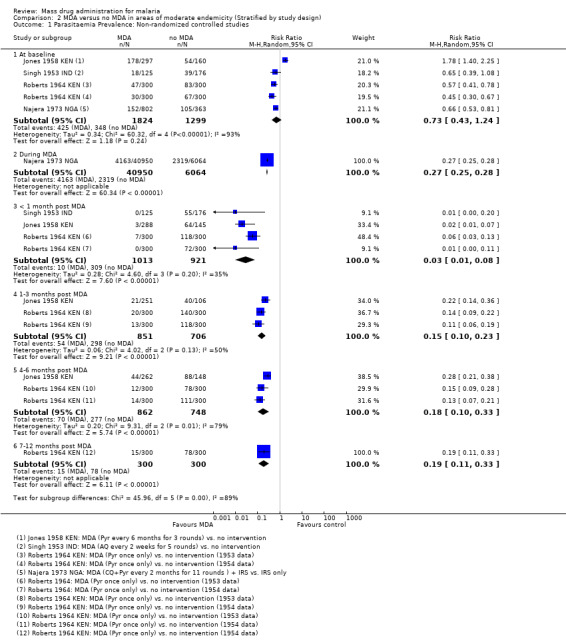
Comparison 2 MDA versus no MDA in areas of moderate endemicity (Stratified by study design), Outcome 1 Parasitaemia Prevalence: Non‐randomized controlled studies.
Only one study reported the prevalence of parasitaemia while the MDA was ongoing and this study administered MDA as chloroquine (450mg) plus pyrimethamine (45mg) every two months for 11 rounds (Najera 1973 NGA). The study reported a substantial reduction in prevalence compared to the control areas (RR 0.27, 95% CI 0.25 to 0.28, 1 study, number sampled 47,014, Analysis 2.1)
Three studies reported very large reductions in prevalence during the first month post‐MDA compared to control areas (RR 0.03, 95% CI 0.01 to 0.08, 3 studies, number sampled 1934, Analysis 2.1). Only two studies from the 1950s conducted follow‐up for more than three months post‐MDA (Jones 1958 KEN; Roberts 1964 KEN). In Jones 1958 KEN, the baseline prevalence of parasitaemia was higher in the intervention areas than in control areas, but was substantially lower in the intervention areas one to three months post‐MDA (RR 0.22, 95% CI 0.14 to 0.36, 1 study, number sampled 357, Analysis 2.1) and at about four months post‐MDA (RR 0.28, 95% CI 0.21 to 0.38, 1 study, number sampled 410, Analysis 2.1). This study administered MDA as pyrimethamine (100 mg) every six months for three rounds. In the highlands of Kenya, where MDA was administered as a single dose of pyrimethamine (Roberts 1964 KEN), there was evidence of continued reduction compared to the control areas by month 7 of follow‐up (RR 0.19, 95% CI 0.11 to 0.33, 1 study, number sampled 600, Analysis 2.1).
Uncontrolled before‐and‐after studies: Compared to baseline data, a large reduction in parasitaemia was seen during multiple rounds of pyrimethamine (50 mg) plus primaquine (40 mg) given every two weeks in Panama (Comer 1971 PAN) and a smaller reduction was seen during weekly administration of chloroquine (450mg) and pyrimethamine (50 mg) for six weeks in New Guinea (Metselaar 1961 PNG) (RR 0.17, 95% CI 0.02 to 1.47, 2 studies, number sampled 4209, Analysis 2.2).
2.2. Analysis.

Comparison 2 MDA versus no MDA in areas of moderate endemicity (Stratified by study design), Outcome 2 Parasitaemia Prevalence: Uncontrolled before‐and‐after studies.
Three studies reported parasitaemia within one month of finishing MDA, with large and consistent reductions compared to baseline (RR 0.29, 95% CI 0.17 to 0.48, 3 studies, number sampled 1727, Analysis 2.2). Two studies conducted follow‐up for more than three months post‐MDA with mixed results: one found no effect (Archibald 1960 NGA) and one found a substantial increase in prevalence compared to baseline (Cavalie 1962 CMR).
Parasitaemia incidence
None of these studies reported on parasitaemia incidence.
Gametocytaemia prevalence
Non‐randomized controlled studies: One non‐randomized controlled study from Nigeria reported a substantial reduction in gametocytaemia in the intervention area during 11 rounds of chloroquine plus pyrimethamine given every two months (RR 0.48, 95% CI 0.42 to 0.54, 1 study, number sampled 47,014, Analysis 2.3). A second study from Kenya reported a substantial reduction in prevalence within the first month following three rounds of pyrimethamine (RR 0.28, 95% CI 0.10 to 0.82, 1 study, number sampled 433, Analysis 2.3). Only the Kenyan study conducted follow‐up for longer than three months post‐MDA. At four months, gametocytaemia prevalence appeared to be increasing in the intervention population and was no longer substantially different from the control population (1 study, number sampled 410, Analysis 2.3). Neither of these studies gave primaquine as part of the MDA.
2.3. Analysis.

Comparison 2 MDA versus no MDA in areas of moderate endemicity (Stratified by study design), Outcome 3 Gametocytaemia Prevalence: Non‐randomized controlled studies.
Uncontrolled before‐and‐after studies: Three uncontrolled before‐and‐after studies reported on gametocyte prevalence within one month of MDA, with substantial effects in two studies (RR 0.47, 95% CI 0.25 to 0.87, 3 studies, number sampled 1727, Analysis 2.4). Only one study continued follow‐up beyond three months (Archibald 1960 NGA); in this study, the prevalence of gametocytaemia was rising after five months but remained lower than baseline (1 study, number sampled 125, Analysis 2.4).
2.4. Analysis.

Comparison 2 MDA versus no MDA in areas of moderate endemicity (Stratified by study design), Outcome 4 Gametocytaemia Prevalence: Uncontrolled before‐and‐after studies.
Comparison 3: MDA vs no MDA in areas of high endemicity (≥ 40%)
One cluster‐randomized trial (von Seidlein 2003 GMB), three non‐randomized controlled studies (seven comparisons) (Escudie 1962 BFA; Molineaux 1980 NGA; Schneider 1961 BFA), and seven uncontrolled before‐and‐after studies (Archibald 1960 NGA; Cavalie 1962 CMR; Gaud 1953 MAR; Hii 1987 MYS; Kligler 1931 PSE; Ricosse 1959 BFA; Song 2010 KHM) compared MDA with no MDA in areas of high endemicity. Of the 16,442 participants in the von Seidlein 2003 GMB cluster‐randomized trial, 14,017 took part in the MDA trial and 1969 were evaluated in the intervention group. The population targeted ranged from 1810 to 14,129 for the non‐randomized controlled studies and from 148 to 7000 for the uncontrolled before‐and‐after studies; see Table 11. Two non‐randomized controlled studies (Escudie 1962 BFA; Molineaux 1980 NGA) and two uncontrolled before‐and‐after studies added MDA to existing IRS programs (Archibald 1960 NGA; Cavalie 1962 CMR). Several of these studies had multiple treatment arms and so appear more than once in the subsequent analyses.
3. Overview of studies conducted in areas of high endemicity.
| Study ID | Design | Country | Year | Endemicity | MDA group | Control group | |||||
| Drug (dose) | Interval | No. of rounds | Population targeted | Coverage | Co‐intervention | ||||||
| Von Seidlein 2003 | CRT | Gambia | 1999 | 43%† | AS (4 mg/kg/day for 3 days) +SP (25 mg/1.25 mg on day 1) | ‐ | 1 | 1969 | 89% | None | Placebo |
| Molineaux 1980 | N‐RCS | Nigeria | 1970‐75 | 46%* | SP (500 mg/25 mg) | 10 weeks | 9‡ | 14,129 | 85% | IRS | IRS alone |
| SP (500 mg/25 mg) | 2‐10 weeks | 23‡ | 1810 | 85% | IRS | IRS alone | |||||
| Escudie 1962 | N‐RCS | Burkina Faso | 1960‐61 | 56.1%† | CQ (600 mg)/AQ (600 mg) +PQ (15 mg) | 1 month | 8 | 1890 | 75‐92% | None | No intervention |
| CQ (600 mg)/AQ (600 mg) +PQ (15 mg) | 2 weeks | 15 | 2560 | 84‐97% | None | No intervention | |||||
| CQ (600 mg)/AQ (600 mg) +PQ (15 mg) | 1 month | 8 | 5400 | 81‐92% | IRS | IRS alone‐ | |||||
| CQ (600 mg)/AQ (600 mg) +PQ (15 mg) | 2 weeks | 15 | 3490 | 82‐94% | IRS | IRS alone‐ | |||||
| Schneider 1961 | N‐RCS | Burkina Faso | 1960‐61 | 59%† | CQ (600 mg)/AQ (600 mg) +PQ (15 mg) | 2 weeks | 15 | 2500 | 90% | None | No intervention |
| Archibald 1960 | BAS | Nigeria | 1957‐59 | 64%† | CQ (600 mg) +Pyr (25 mg) | 6 months | 4 | 1300 | ND | IRS | IRS‐ |
| Cavalie 1962 | BAS | Cameroon | 1960‐61 | 65%* | CQ (600 mg) +Pyr (50 mg) | ‐ | 1 | 7000 | 100% | IRS | IRS |
| Gaud 1953 | BAS | Morocco | 1952 | 42%* | AQ (600 mg) | ‐ | 1 | 3000 | ND | None | ‐ |
| Ricosse 1959 | BAS | Burkina Faso | 1958‐59 | 56%† | Pyr (50 mg) | 2 weeks | 8 | 3000 | 82‐91% | None | ‐ |
| Song 2010 | BAS | Cambodia | 2003‐06 | 56%† | AS (125 mg/day for 2 days) + PIP (750 mg/day for 2 days) + PQ (9 mg every 10 days) | ‐ | 1 | 3653 | ND | None | ‐ |
| Hii 1987 | BAS | Malaysia | 1984‐85 | 56%† | SP (1500 mg / 75 mg) + PQ (30 mg) | ‐ | 1 | 148 | 76% | None | ‐ |
| Kligler 1931 | BAS | Palestine | 1930 | 67%† | Plas (30 mg) + Q (900 mg) twice daily for 5 days | 3 weeks | 3 | 953 | 79% | None | ‐ |
CRT= Cluster‐randomized trial; N‐RCS = Non‐randomized controlled study; BAS = Uncontrolled before‐and‐after study; AS = Artesunate; SP = Sulfadoxine (or sulfalene)‐Pyrimethamine; Pyr = Pyrimethamine; CQ = Chloroquine; AQ = Amodiaquine; PQ = Primaquine; Pip = Piperaquine; Plas = Plasmochin; Q = Quinine; ND = Not described; IRS = Indoor Residual Spraying.
*In all ages
†Amongst children only
‡Estimated from the data provided
Parasitaemia prevalence
Cluster‐randomized trials: In the Gambia, no significant differences in parasite prevalence were seen at baseline, at six to 10 weeks or at five months following a single treatment course of artesunate plus sulfadoxine‐pyrimethamine (1 study, number sampled 1089 to 1800, Analysis 3.1).
3.1. Analysis.
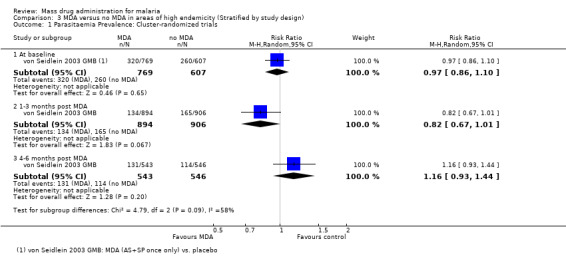
Comparison 3 MDA versus no MDA in areas of high endemicity (Stratified by study design), Outcome 1 Parasitaemia Prevalence: Cluster‐randomized trials.
Non‐randomized controlled studies: At baseline, there was evidence of imbalance in parasite prevalence between groups in all three studies, biasing the subsequent time points and leading to an overestimate of the effect (RR 0.84, 95% CI 0.70 to 1.00, 3 studies, number sampled 9395, Analysis 3.2). These studies were conducted between 1960 and 1975.
3.2. Analysis.
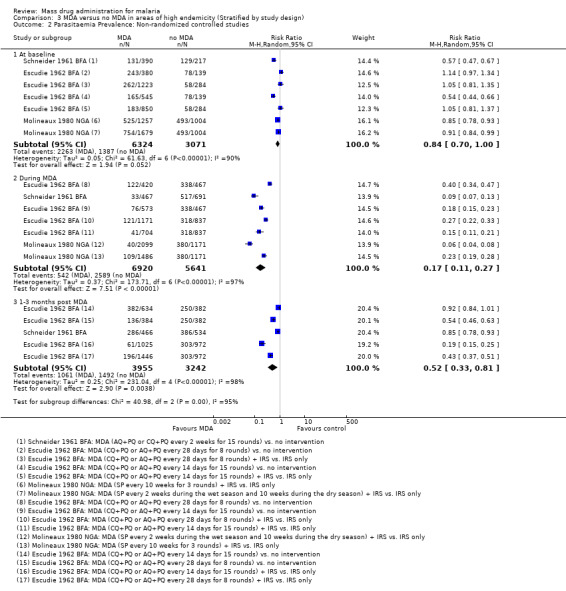
Comparison 3 MDA versus no MDA in areas of high endemicity (Stratified by study design), Outcome 2 Parasitaemia Prevalence: Non‐randomized controlled studies.
Even accounting for the baseline differences, large reductions in parasitaemia were seen consistently during multi‐round MDA programmes (RR 0.17, 95% CI 0.11 to 0.27, 3 studies, number sampled 12,561, Analysis 3.2). In Burkina Faso, where MDA was administered as amodiaquine or chloroquine plus primaquine, there was still some evidence of benefit up to three months post‐MDA, although this effect was of a smaller magnitude than seen during the MDA programmes (RR 0.52, 95% CI 0.33 to 0.81, 1 study, number sampled 7197, Analysis 3.2). These two studies demonstrated a lessening effect back towards baseline estimates.
Uncontrolled before‐and‐after studies: Similarly, in uncontrolled before‐and‐after studies, substantial reductions in parasitaemia were seen during multi‐round MDA programmes (RR 0.10, 95% CI 0.03 to 0.34, 2 studies, number sampled 911, Analysis 3.3). Reductions were also seen within one month of the MDA programmes finishing (RR 0.37, 95% CI 0.28 to 0.49, 4 studies, number sampled 1941, Analysis 3.3), although the magnitude of the reduction ranged from 30% to 72%. Three studies continued to monitor prevalence for more than three months post‐MDA, with mixed findings. One recent study that administered artesunate plus piperaquine with primaquine reported a large reduction over time in Cambodia (Song 2010 KHM), one 1930 study from Palestine using plasmochin and quinine showed modest reductions, while one small study from Malaysia administering sulfadoxine‐pyrimethamine plus primaquine demonstrated no significant effect at any time point (Hii 1987 MYS). In the Cambodia study, periodic surveys were carried out every six months for two years after the mass treatment programme.
3.3. Analysis.
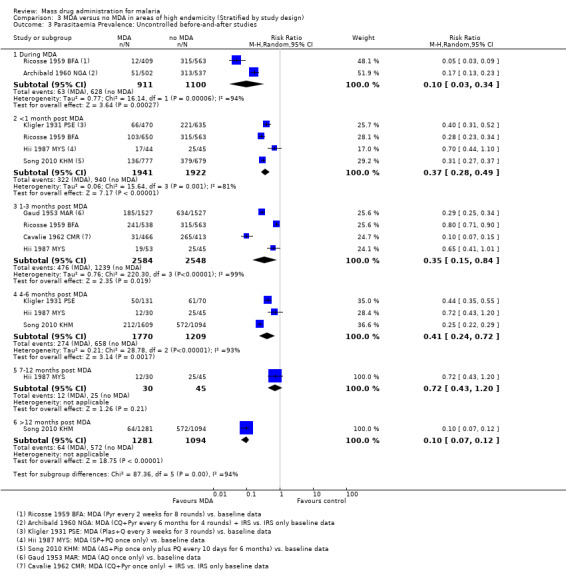
Comparison 3 MDA versus no MDA in areas of high endemicity (Stratified by study design), Outcome 3 Parasitaemia Prevalence: Uncontrolled before‐and‐after studies.
Parasitaemia incidence
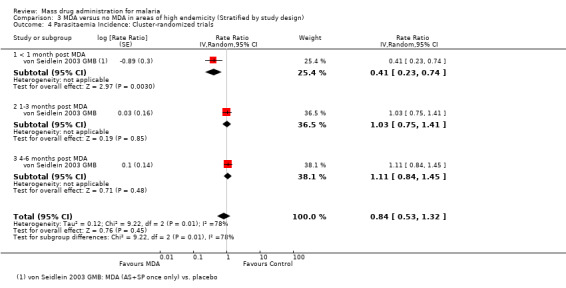
Cluster‐randomized trials: In the single cluster‐randomized trial from the Gambia, the incidence of parasitaemia was reduced by over 50% during the first month following a single course of artesunate plus sulfadoxine‐pyrimethamine (RR 0.41, 95% CI 0.23 to 0.74, one study, number sampled 1225, Analysis 3.4). This significant reduction is consistent with the adjusted geometric mean rate ratio reported in the publication (rate ratio 0.37, 95% CI 0.17 to 0.84) (von Seidlein 2003 GMB). However, no difference was present at six to 10 weeks or at five months in both the unadjusted rate ratios presented in this review and the adjusted rate ratios presented in the publication.
3.4. Analysis.
Comparison 3 MDA versus no MDA in areas of high endemicity (Stratified by study design), Outcome 4 Parasitaemia Incidence: Cluster‐randomized trials.
Gametocytaemia prevalence
Cluster‐randomized trials: In the Gambia, there were no statistically significant differences in gametocytaemia at baseline or at five months following a single treatment course of artesunate plus sulfadoxine‐pyrimethamine (1 study, number sampled 1376 to 1414, Analysis 3.5).
3.5. Analysis.
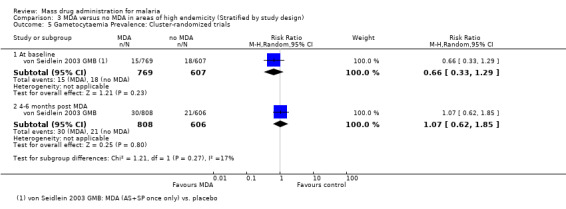
Comparison 3 MDA versus no MDA in areas of high endemicity (Stratified by study design), Outcome 5 Gametocytaemia Prevalence: Cluster‐randomized trials.
Non‐randomized controlled studies: Three non‐randomized controlled studies reported substantial reductions in the prevalence of gametocytaemia during MDA programmes (RR 0.17, 95% CI 0.10 to 0.28, 3 studies, number sampled 12,561, Analysis 3.6). Two of these studies administered MDA as amodiaquine or chloroquine plus primaquine (Escudie 1962 BFA; Schneider 1961 BFA) and one study gave sulfalene‐pyrimethamine alone (Molineaux 1980 NGA). In Schneider 1961 BFA, the effect on gametocytaemia appeared to be lost within three months of the MDA programme finishing, while in Escudie 1962 BFA some reduction still remained after three months in three of four comparison arms, although the impact decreased in magnitude.
3.6. Analysis.
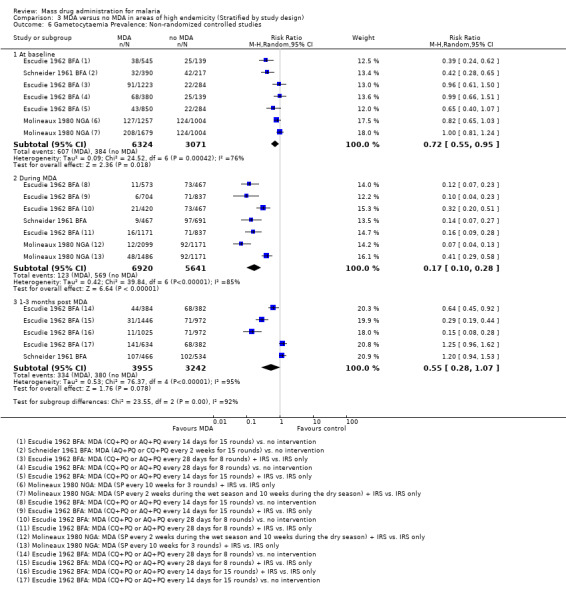
Comparison 3 MDA versus no MDA in areas of high endemicity (Stratified by study design), Outcome 6 Gametocytaemia Prevalence: Non‐randomized controlled studies.
Uncontrolled before‐and‐after studies: Five uncontrolled before‐and‐after studies reported on the effect of MDA on gametocytaemia prevalence. Two studies either administered pyrimethamine alone (Ricosse 1959 BFA) or chloroquine plus pyrimethamine (Archibald 1960 NGA). Two studies were carried out in Asia and treated individuals with a combination drug of sulfadoxine‐pyrimethamine plus primaquine (Hii 1987 MYS) or with artemisinin and piperaquine given with primaquine every 10 days (Song 2010 KHM). One study used plasmochin and quinine (Kligler 1931 PSE). Only Song 2010 KHM demonstrated sustained impact after six months (RR 0.19, 95% CI 0.13 to 0.27, 1 study, number sampled 1609, Analysis 3.7), which was sustained during the 30 month follow‐up (RR 0.09, 95% CI 0.05 to 0.15, 1 study, number sampled 1175, Analysis 3.7).
3.7. Analysis.

Comparison 3 MDA versus no MDA in areas of high endemicity (Stratified by study design), Outcome 7 Gametocytaemia Prevalence: Uncontrolled before‐and‐after studies.
Anaemia prevalence
Cluster‐randomized trials: The prevalence of anaemia (hematocrit < 33%) was only reported in a single cluster‐randomized trial from the Gambia (von Seidlein 2003 GMB). This study demonstrated a modest reduction in anaemia prevalence at five months post‐MDA (RR 0.84, 95% CI 0.75 to 0.93, 1 study, number sampled 1414, Analysis 3.8).
3.8. Analysis.
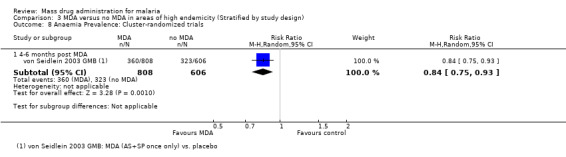
Comparison 3 MDA versus no MDA in areas of high endemicity (Stratified by study design), Outcome 8 Anaemia Prevalence: Cluster‐randomized trials.
Mortality
Cluster‐randomized trials: Mortality was only reported in a single cluster‐randomized trial from the Gambia (von Seidlein 2003 GMB). Mortality was low in both study arms over five months follow‐up, with no statistically significant difference between the two groups (1 study, number sampled 3655, Analysis 3.9).
3.9. Analysis.
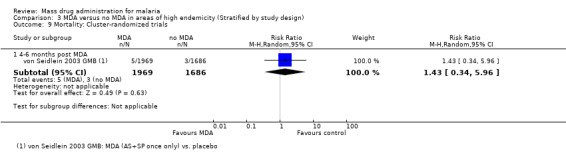
Comparison 3 MDA versus no MDA in areas of high endemicity (Stratified by study design), Outcome 9 Mortality: Cluster‐randomized trials.
Section 2: MDA + vector control vs no intervention
Comparison 4: MDA plus vector control vs no intervention in areas of moderate endemicity (6% to 39%)
One non‐randomized controlled study (Kaneko 2000 VUT) and four uncontrolled before‐and‐after studies (De Zulueta 1961 UGA; De Zulueta 1964 UGA; Paik 1974a SLB; Ricosse 1959 BFA) compared MDA plus vector control with no intervention in areas of moderate endemicity. The target population for the Kaneko 2000 VUT study was 718 villagers. The target population for three uncontrolled before‐and‐after studies (De Zulueta 1961 UGA; De Zulueta 1964 UGA; Ricosse 1959 BFA) ranged from 5000 to 59,605; in the Paik 1974a SLB study, the targeted population was not described. See Table 12.
4. Overview of studies comparing MDA + vector control versus no intervention.
| Study ID | Design | Country | Year | Endemicity | MDA group | Control group/ baseline | |||||
| Drug (dose) | Interval | No. of rounds | Population targeted | Coverage | Co‐intervention | ||||||
| Moderate Endemicity | |||||||||||
| Kaneko 2000 | N‐RCS | Vanuatu | 1991‐99 | 29%* | CQ (600 mg) + SP (1500 mg/75 mg) + PQ (45 mg) weeks 1, 5, and 9; CQ (300 mg) + PQ (45 mg) weeks 2, 3, 4, 6, 7, and 8 |
1 week | 9 | 718 | 79‐92% | ITN + larvivorous fish | low baseline coverage of ITNs |
| Ricosse 1959 | BAS | Burkina Faso | 1958‐59 | 15%† | Pyr (50 mg) | 2 weeks | 8 | 5000 | 82‐91% | IRS | None |
| De Zulueta 1961 | BAS | Uganda | 1959‐60 | 34%† | CQ (600 mg) + Pyr (50 mg) | 3 months | 4 | 30,384 | 80% | IRS | None |
| De Zulueta 1964 | BAS | Uganda | 1960 | 23%† | CQ (600 mg) + Pyr (50 mg) | 5 months | 2 | 16,000 | 50% | IRS | None |
| Paik 1974a | BAS | Solomon Islands | 1972 | 28%* | CQ (600 mg) +Pyr (50 mg) | 1 month | 4 | ND | 90% | IRS | None |
| High Endemicity | |||||||||||
| Molineaux 1980 | N‐RCS | Nigeria | 1970‐75 | 46%* | SP (500 mg/25 mg) | 10 weeks | 9‡ | 14,129 | 85% | IRS | None |
| SP (500 mg/25 mg) | 2‐10 weeks | 23‡ | 1810 | 85% | IRS | None | |||||
| Escudie 1962 | N‐RCS | Burkina Faso | 1960‐61 | 56.1%† | CQ (600 mg) /AQ (600 mg) + PQ (15 mg) | 1 month | 8 | 5400 | 81‐92% | IRS | None |
| CQ (600 mg)/AQ (600 mg) + PQ (15 mg) | 2 weeks | 15 | 3490 | 82‐94% | IRS | None | |||||
| Schneider 1961 | N‐RCS | Burkina Faso | 1960‐61 | 59%† | AQ (600 mg) + PQ (15 mg) | 2 weeks | 8 | 3525 | ND | IRS | None |
| Metselaar 1961 | BAS | New Guinea | 1958‐59 | 46%* | CQ (450 mg) +Pyr (50 mg) | 1 week | 6 | 2500 | 90% | IRS | None |
| Hii 1987 | BAS | Malaysia | 1984‐85 | 46%† | SP (1500 mg / 75 mg) + PQ (30 mg) | ‐ | 1 | 754 | 87% | ITN | None |
N‐RCS = Non‐randomized controlled study; BAS = Uncontrolled before‐and‐after study; AQ = Amodiaquine; Pyr = Pyrimethamine; CQ = Chloroquine; SP = Sulfadoxine (or sulfalene)‐Pyrimethamine; PQ = Primaquine; ND = Not described; IRS = Indoor Residual Spraying; ITN = Insecticide Treated Net.
*In all ages
†Amongst children only
‡Estimated from the data provided
Parasitaemia prevalence
Non‐randomized controlled studies:Kaneko 2000 VUT included larvivorous fish in several identified breeding sites and universal coverage with insecticide‐treated bed nets (about 0.94 nets per villager) in its intervention group. In the comparison group, bed net coverage was approximately 20%. Twelve months post‐MDA, the prevalence of parasitaemia was 1% in the intervention island compared to 12% in the control island (Analysis 4.1).
4.1. Analysis.
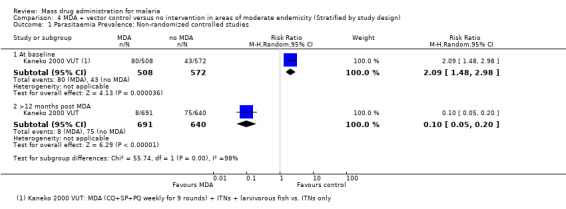
Comparison 4 MDA + vector control versus no intervention in areas of moderate endemicity (Stratified by study design), Outcome 1 Parasitaemia Prevalence: Non‐randomized controlled studies.
Uncontrolled before‐and‐after studies: These four studies administered MDA with either pyrimethamine alone (Ricosse 1959 BFA) or chloroquine plus pyrimethamine (De Zulueta 1961 UGA; De Zulueta 1964 UGA; Paik 1974a SLB), together with IRS. The greatest effect on parasitaemia prevalence was seen within one month post‐MDA (RR 0.06, 95% CI 0.01 to 0.33, three studies, number sampled 2961, Analysis 4.2), which was larger than the effect seen in Analysis 2.2 with MDA alone. Only one study (De Zulueta 1964 UGA) from the Ugandan highlands with disappearance of the vector with IRS found a sustained, large effect lasting over 12 months (RR 0.00, 95% CI 0.00 to 0.03, one study, number sampled 1229, Analysis 4.2).
4.2. Analysis.
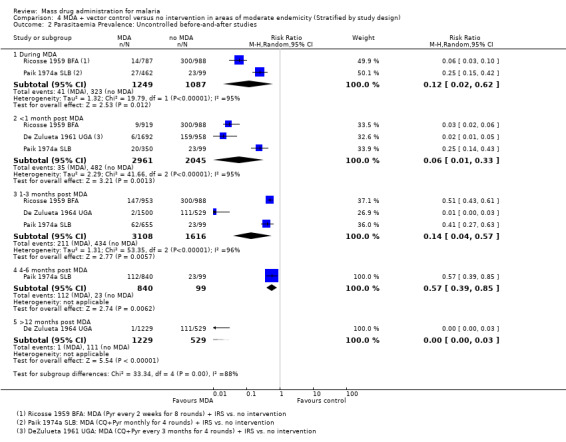
Comparison 4 MDA + vector control versus no intervention in areas of moderate endemicity (Stratified by study design), Outcome 2 Parasitaemia Prevalence: Uncontrolled before‐and‐after studies.
Gametocytaemia prevalence
Uncontrolled before‐and‐after studies: Two studies from Uganda (De Zulueta 1961 UGA) and Burkina Faso (Ricosse 1959 BFA) demonstrated a reduction in gametocytaemia prevalence during MDA (RR 0.13, 95% CI 0.06 to 0.27, two studies, number sampled 2479, Analysis 4.3). Only Ricosse 1959 BFA reported estimates for gametocytaemia prevalence post‐MDA. The largest effect was seen within one month of administration (RR 0.01, 95% CI 0.00 to 0.16, one study, number sampled 919, Analysis 4.3), with a lessening effect after two months (RR 0.22, 95% CI 0.11 to 0.41, one study, number sampled 953, Analysis 4.3). Neither of these studies administered primaquine as part of MDA.
4.3. Analysis.
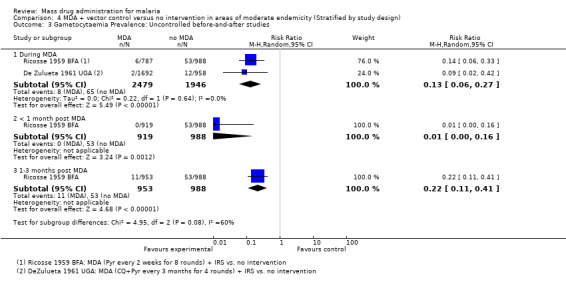
Comparison 4 MDA + vector control versus no intervention in areas of moderate endemicity (Stratified by study design), Outcome 3 Gametocytaemia Prevalence: Uncontrolled before‐and‐after studies.
Comparison 5: MDA plus vector control vs no intervention in areas of high endemicity (≥ 40%)
Three non‐randomized controlled studies (five comparisons) (Escudie 1962 BFA; Molineaux 1980 NGA; Schneider 1961 BFA) and two uncontrolled before‐and‐after studies (Hii 1987 MYS; Metselaar 1961 PNG) compared MDA plus vector control with no intervention in settings of high endemicity. The number of participants ranged from 1810 to 14,129 in the non‐randomized controlled studies and from 754 to 2500 participants in the two uncontrolled before‐after studies. See Table 12.
Parasitaemia prevalence
Non‐randomized controlled studies: These studies administered MDA at intervals of two weeks to 10 weeks for between eight and 23 rounds, alongside IRS. These studies were conducted between 1961 and 1975. In two studies (Escudie 1962 BFA; Schneider 1961 BFA), there was evidence of baseline imbalance in parasite prevalence, biasing the subsequent time points and leading to an overestimate of the effect (Analysis 5.1). Despite this, MDA plus IRS appeared to reduce parasitaemia substantially during MDA (RR 0.10, 95% CI 0.06 to 0.16, three studies, number sampled 9493, Analysis 5.1). However, by three months post‐MDA, this effect had lessened in both Schneider 1961 BFA and Escudie 1962 BFA compared to during administration (RR 0.12, 95% CI 0.06 to 0.23, two studies, number sampled 4455, Analysis 5.1). The effect on parasitaemia prevalence both during and one to three months post MDA with IRS were larger than noted in studies without concomitant vector control measures (Analysis 3.2). Only one study (Molineaux 1980 NGA) conducted follow‐up for more than three months, reporting a continued reduction in prevalence with a modest effect from seven to 12 months (RR 0.60, 95% CI 0.55 to 0.67, one study, number sampled 3154, Analysis 5.1).
5.1. Analysis.
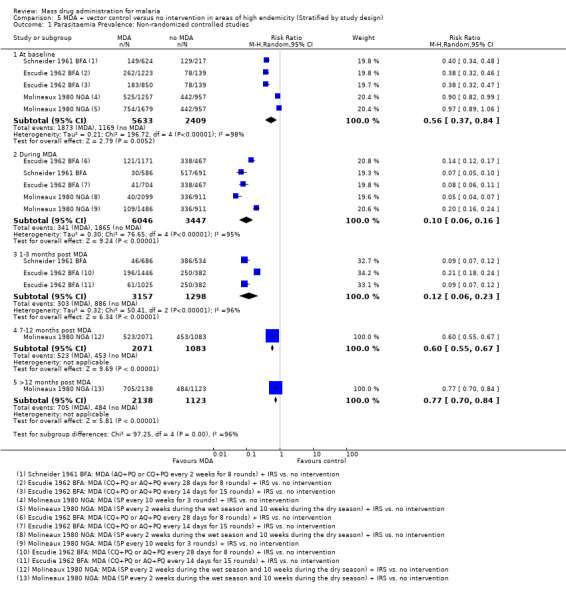
Comparison 5 MDA + vector control versus no intervention in areas of high endemicity (Stratified by study design), Outcome 1 Parasitaemia Prevalence: Non‐randomized controlled studies.
Uncontrolled before‐and‐after studies: A study (Hii 1987 MYS) from Malaysia issuing permethrin‐impregnated bed nets to all households along with larval control measures and a study (Metselaar 1961 PNG) from New Guinea conducting IRS reported the impact on parasitaemia prevalence. The largest reduction in parasitaemia was seen one to three months post MDA(RR 0.13, 95% CI 0.01 to 2.51, two studies, number sampled 2722, Analysis 5.2), with lessening effect as the post‐intervention time increased. Compared to baseline, no difference was noted after nine months of follow‐up for the Malaysian study (Analysis 5.2).
5.2. Analysis.

Comparison 5 MDA + vector control versus no intervention in areas of high endemicity (Stratified by study design), Outcome 2 Parasitaemia Prevalence: Uncontrolled before‐and‐after studies.
Gametocytaemia prevalence
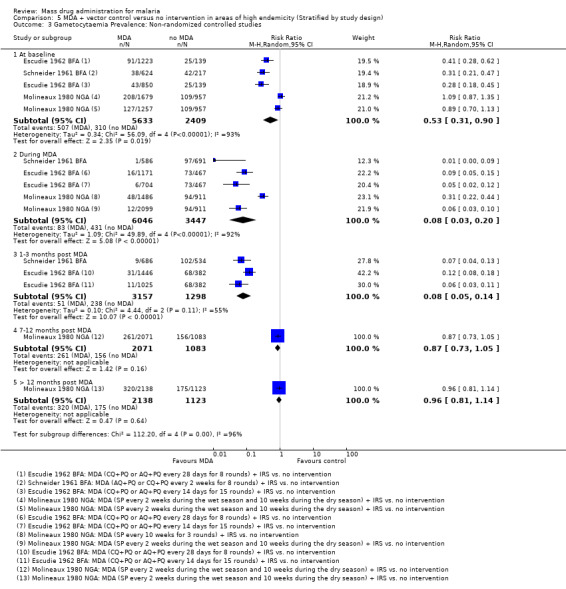
Non‐randomized controlled studies: All three studies (Escudie 1962 BFA; Molineaux 1980 NGA; Schneider 1961 BFA), comprising five comparison groups, included IRS in addition to MDA. At baseline, two studies with three comparison groups (Escudie 1962 BFA; Schneider 1961 BFA) demonstrated higher gametocytaemia prevalence in the intervention arms compared to the comparison arms. These baseline imbalances could inflate the impact of the effect at subsequent time points. Despite this, MDA appeared to reduce substantially the prevalence of gametocytaemia during the intervention (RR 0.08, 95% CI 0.03 to 0.20, three studies, number sampled 9493, Analysis 5.3). The effect of MDA on gametocytaemia prevalence remained until three months post‐MDA (RR 0.08, 95% CI 0.05 to 0.14, two studies, number sampled 4455, Analysis 5.3). Only one study from Nigeria (Molineaux 1980 NGA) reported long‐term data. This study administered MDA using sulfalene (500 mg) plus pyrimethamine (25 mg) every 10 weeks, and noted lessening effect between seven and 11 months (RR 0.87, 95% CI 0.73 to 1.05, one study, number sampled 3154) and no difference beyond 12 months of follow‐up (RR 0.96, 95% CI 0.81 to 1.14, one study, number sampled 3261, Analysis 5.3).
5.3. Analysis.
Comparison 5 MDA + vector control versus no intervention in areas of high endemicity (Stratified by study design), Outcome 3 Gametocytaemia Prevalence: Non‐randomized controlled studies.
Uncontrolled before‐and‐after studies: A single study (Hii 1987 MYS) reporting the co‐administration of ITNs demonstrated a reduction in gametocytaemia prevalence during MDA (RR 0.29, 95% CI 0.17 to 0.50, one study, number sampled 219, Analysis 5.4). The impact on gametocytaemia prevalence decreased with increased time post‐intervention. After six months, estimates of prevalence in the intervention villages approached those before intervention (RR 0.93, 95% CI 0.65 to 1.33, one study, number sampled 194, Analysis 5.4).
5.4. Analysis.

Comparison 5 MDA + vector control versus no intervention in areas of high endemicity (Stratified by study design), Outcome 4 Gametocytaemia Prevalence: Uncontrolled before‐and‐after studies.
Section 3: Parasitaemia incidence only studies
Six uncontrolled before‐and‐after studies (Cáceres Garcia 2008 VEN; Gabaldon 1959 VEN; Garfield 1983 NIC; Kondrashin 1985 IND; Paik 1974b SLB; Simeons 1938 IND) only reported baseline monthly incidence and did not provide malaria endemicity estimates (Table 13). Among these, four compared MDA with no intervention (Cáceres Garcia 2008 VEN; Gabaldon 1959 VEN; Kondrashin 1985 IND; Paik 1974b SLB), while the remaining two compared MDA plus vector control with no intervention (Garfield 1983 NIC; Simeons 1938 IND). Targeted populations ranged in size from 1200 to 2,300,000.
5. Overview of studies assessing parasitaemia incidence only.
| Study ID | Design | Country | Year | Baseline Incidence | MDA group | Baseline | |||||
| Drug (dose) | Interval | No. of rounds | Population targeted | Coverage | Co‐intervention | ||||||
| Garfield 1983 | BAS | Nicaragua | 1981‐82 | 0.4/1000 | CQ (500 mg/day for 3 days) + PQ (15 mg/day for 3 days) | ‐ | 1 | 2,300,000 | 70‐80% | Larval control | None |
| Simeons 1938 | BAS | India | 1935 | 156/1000 | Ate (300 mg) + Plas (60 mg) | ‐ | 1 | 5650 | 100% | Larval control | None |
| Gabaldon 1959 | BAS | Venezuela | 1956‐57 | 0.4/1000 | Pyr (50 mg) | 1 week | 24 | 111,995 | ND | IRS | IRS |
| Kondrashin 1985 | BAS | India | 1981 | 4/1000 | CQ (600 mg) + PQ (45 mg) | 6 months | 2 | 51,325 | 85% | IRS | IRS |
| Paik 1974b | BAS | Solomon Islands | 1972‐73 | 15/1000 | CQ (300 mg/day for 5 days) + PQ (15 mg/day for 5 days) | 3 months | 3 | 1200 | 90% | None | ‐ |
| Cáceres Garcia 2008 | BAS | Venezuela | 2002‐07 | 22/1000 | CQ (25 mg/kg over 3 days) +PQ (3.5 mg/kg over 7 days) | ‐ | 1 | 22,941 | 77% | None | ‐ |
BAS = Uncontrolled before‐and‐after study; PQ = Primaquine; CQ = Chloroquine; Pyr = Pyrimethamine; Plas = Plasmochin; Ate = Atebrin; ND = Not described; IRS = Indoor Residual Spraying.
†Amongst children only
Comparison 6.1: MDA vs no MDA
Uncontrolled before‐and‐after studies: Compared to baseline, large reductions in parasitaemia incidence were seen during MDA administration in two studies ‐ one from Venezuela where pyrimethamine was administered in 24 weekly rounds (Gabaldon 1959 VEN) and another from the Solomon Islands (known as the British Solomon Islands at the time of the study's publication) where three rounds of chloroquine plus primaquine were given three months apart (Paik 1974b SLB). In contrast, no significant effect was seen in India during two rounds of chloroquine plus primaquine given six months apart (Kondrashin 1985 IND) (Analysis 6.1). In addition, three additional studies found large reductions in incidence within the first month post‐intervention (Cáceres Garcia 2008 VEN; Gabaldon 1959 VEN; Paik 1974b SLB), although this effect reduced over the following one to three months (Analysis 6.1). In the two studies from Venezuela (Cáceres Garcia 2008 VEN; Gabaldon 1959 VEN), parasitaemia incidence returned briefly back to baseline levels, before the incidence again fell compared to baseline levels. These data are impossible to interpret without a control group.
6.1. Analysis.

Comparison 6 Parasitaemia Incidence studies, Outcome 1 MDA versus no MDA: Uncontrolled before‐and‐after studies.
Comparison 6.2: MDA plus vector control vs no MDA
Uncontrolled before‐and‐after studies: Two studies (Garfield 1983 NIC; Simeons 1938 IND) described the effect of MDA plus vector control measures on parasitaemia incidence during administration, with baseline monthly incidence levels ranging from 0.4/1000 to 156/1000. During MDA, the effects appear mixed, with an increase in incidence in one study and a decrease in the other (Analysis 6.2). These observations are probably seasonal and again highlight the difficulty of interpreting uncontrolled trials. At later time points, the incidence of malaria appears substantially reduced compared to baseline levels for up to a year (Analysis 6.2).
6.2. Analysis.
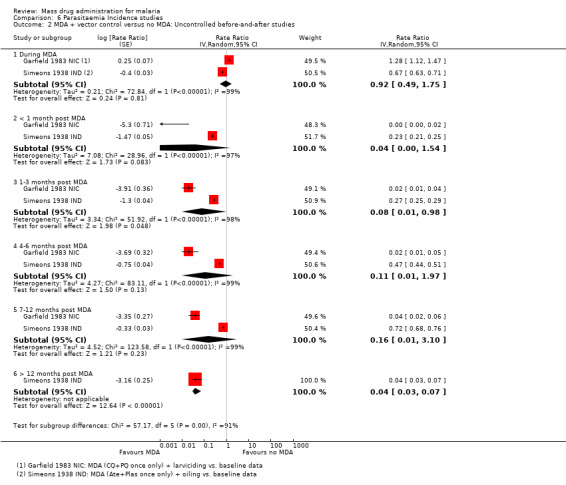
Comparison 6 Parasitaemia Incidence studies, Outcome 2 MDA + vector control versus no MDA: Uncontrolled before‐and‐after studies.
Both studies reported implementing larval control methods, which involved either oiling (Simeons 1938 IND) or larviciding based on large scale application of temephos to peridomiciliary breeding sites targeting Aedes aegypti (Garfield 1983 NIC).
Section 4: MDA of regimens containing 8‐aminoquinolines versus regimens that do not
We found no studies directly comparing MDA regimens that included 8‐aminoquinolines with regimens that did not.
We have instead attempted to compare these regimens indirectly through a subgroup analysis. This was not possible for studies conducted in settings of low endemicity due to their low number. The single cluster‐randomized trial gave primaquine along with artesunate plus sulphadoxine‐pyrimethamine but reported no episodes of parasitaemia or gametocytaemia at baseline or during follow‐up (Shekalaghe 2011 TZA), and the single uncontrolled before‐and‐after study gave chloroquine alone (Malaria_Taiwan 1991 TWN).
Comparison 7: MDA vs no MDA; settings of moderate and high endemicity; subgrouped by inclusion of 8‐aminoquinolines
Parasitaemia prevalence
Non‐randomized controlled trials:
None of the non‐randomized controlled studies from moderate endemic settings administered primaquine as part of MDA. Of the three studies from high endemic settings, two administered primaquine as part of MDA (Escudie 1962 BFA; Schneider 1961 BFA) and one did not (Molineaux 1980 NGA). During multiple MDA rounds, there was a substantial reduction in parasitaemia prevalence regardless of the presence or absence of primaquine, with no statistically significant differences between subgroups (test for subgroup differences P = 0.57, Analysis 7.1). At one to three months, the two studies without primaquine (Jones 1958 KEN; Roberts 1964 KEN) showed a larger impact than studies that included primaquine (Escudie 1962 BFA; Schneider 1961 BFA) (Analysis 7.2).
7.1. Analysis.
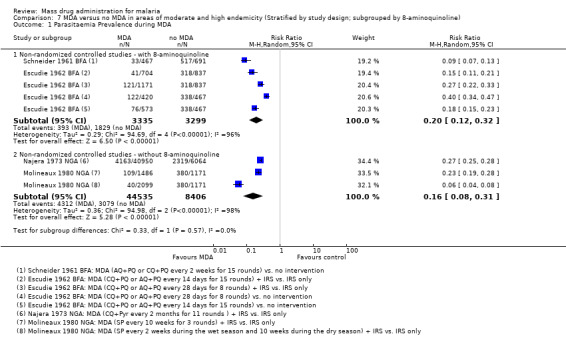
Comparison 7 MDA versus no MDA in areas of moderate and high endemicity (Stratified by study design; subgrouped by 8‐aminoquinoline), Outcome 1 Parasitaemia Prevalence during MDA.
7.2. Analysis.
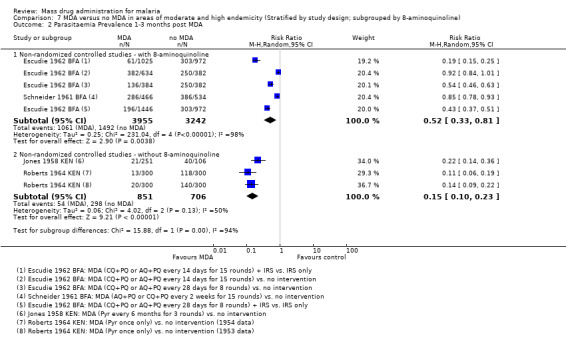
Comparison 7 MDA versus no MDA in areas of moderate and high endemicity (Stratified by study design; subgrouped by 8‐aminoquinoline), Outcome 2 Parasitaemia Prevalence 1‐3 months post MDA.
Uncontrolled before‐and‐after studies: Four studies reporting parasitaemia prevalence administered an 8‐aminoquinoline as part of their MDA regimen (Kligler 1931 PSE: plasmochine 30 mg; Comer 1971 PAN: primaquine 40 mg; Hii 1987 MYS: primaquine 30 mg; Song 2010 KHM: primaquine 9 mg every 10 days). During MDA administration, there was no difference in impact between studies that administered primaquine and those that had not (test for subgroup differences P = 0.08, Analysis 7.3).Within the first month post‐MDA, there was a substantial reduction in parasite prevalence in all four studies regardless of whether primaquine was given or not (test for subgroup differences P = 0.12, Analysis 7.4). At one to three months post‐treatment, uncontrolled before‐and‐after studies that did not include an 8‐aminoquinoline experienced greater reductions in parasitaemia prevalence compared to the one study that did use an 8‐aminoquinoline as part of MDA (test for subgroup differences < 0.001, Analysis 7.5). At four to six months post‐MDA, there was no difference in impact between studies that administered primaquine and those that had not (test for subgroup differences P = 0.07, Analysis 7.6).
7.3. Analysis.
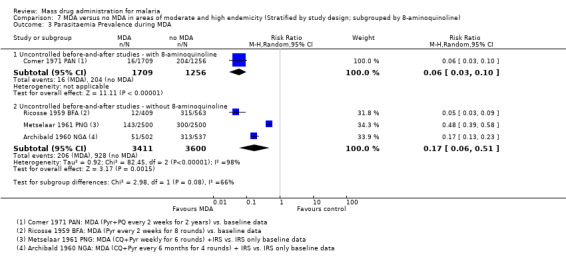
Comparison 7 MDA versus no MDA in areas of moderate and high endemicity (Stratified by study design; subgrouped by 8‐aminoquinoline), Outcome 3 Parasitaemia Prevalence during MDA.
7.4. Analysis.

Comparison 7 MDA versus no MDA in areas of moderate and high endemicity (Stratified by study design; subgrouped by 8‐aminoquinoline), Outcome 4 Parasitaemia Prevalence <1 month post MDA.
7.5. Analysis.
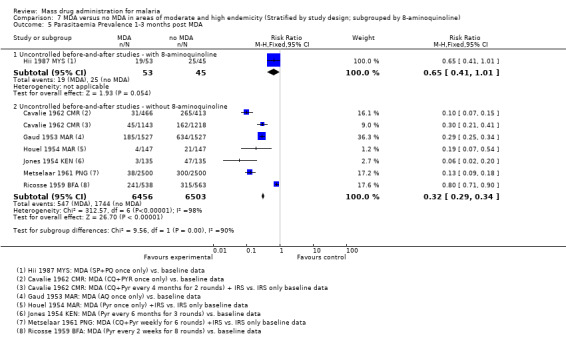
Comparison 7 MDA versus no MDA in areas of moderate and high endemicity (Stratified by study design; subgrouped by 8‐aminoquinoline), Outcome 5 Parasitaemia Prevalence 1‐3 months post MDA.
7.6. Analysis.
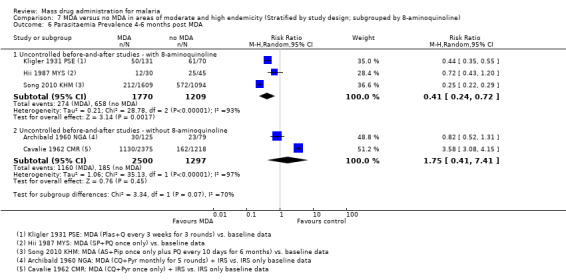
Comparison 7 MDA versus no MDA in areas of moderate and high endemicity (Stratified by study design; subgrouped by 8‐aminoquinoline), Outcome 6 Parasitaemia Prevalence 4‐6 months post MDA.
Section 5: MDA for different plasmodium species
Two non‐randomized controlled studies (Jones 1958 KEN; Kaneko 2000 VUT) and five uncontrolled before‐and‐after studies (Malaria_Taiwan 1991 TWN; Metselaar 1961 PNG; Paik 1974a SLB; Song 2010 KHM; van Dijk 1961 PNG) report the effects of MDA on the prevalence of both P. falciparum and P. vivax parasitaemia. Among these, two studies compared MDA plus vector control with no intervention (Kaneko 2000 VUT; Paik 1974a SLB); the remaining studies compared MDA with no intervention.
Comparison 8: Subgrouped by plasmodium species
Non‐randomized controlled studies: At baseline, there was a substantial imbalance in the prevalence of P. vivax parasitaemia, which would tend to underestimate the effect of MDA on P. vivax (Analysis 8.1). These two studies administered MDA as either pyrimethamine every six months for three rounds (Jones 1958 KEN) or as weekly doses of chloroquine, sulfadoxine‐pyrimethamine and primaquine for nine weeks (Kaneko 2000 VUT); both produced mixed results. Kaneko 2000 VUT reported sustained impact on parasitaemia prevalence over several years of follow‐up with no falciparum infections and few vivax cases, showing that the impact of MDA was larger for P. falciparum. Jones 1958 KEN also found a larger reduction in P. falciparum than P. vivax for up to about four months (Analysis 8.3; Analysis 8.4; Analysis 8.5).
8.1. Analysis.
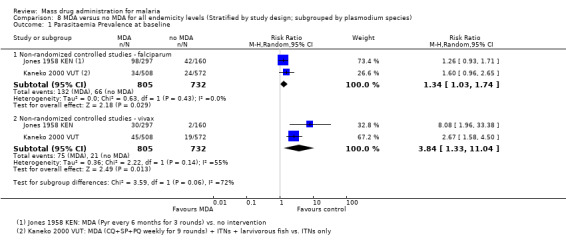
Comparison 8 MDA versus no MDA for all endemicity levels (Stratified by study design; subgrouped by plasmodium species), Outcome 1 Parasitaemia Prevalence at baseline.
8.3. Analysis.
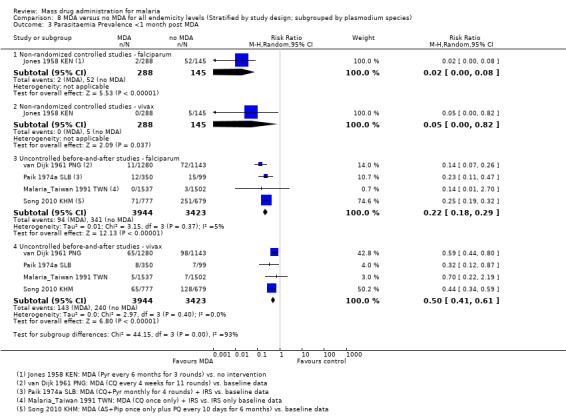
Comparison 8 MDA versus no MDA for all endemicity levels (Stratified by study design; subgrouped by plasmodium species), Outcome 3 Parasitaemia Prevalence <1 month post MDA.
8.4. Analysis.
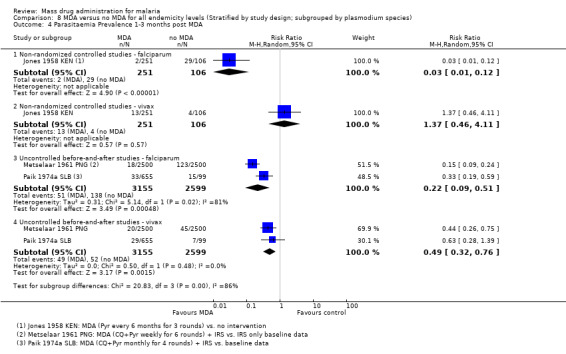
Comparison 8 MDA versus no MDA for all endemicity levels (Stratified by study design; subgrouped by plasmodium species), Outcome 4 Parasitaemia Prevalence 1‐3 months post MDA.
8.5. Analysis.
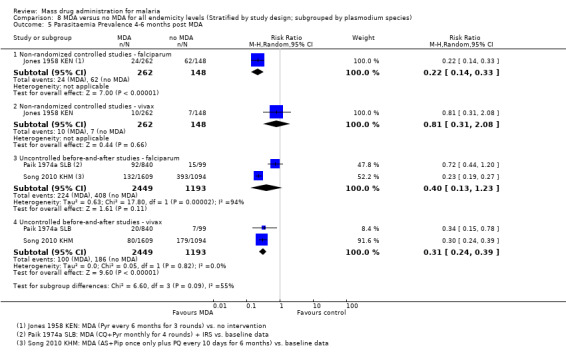
Comparison 8 MDA versus no MDA for all endemicity levels (Stratified by study design; subgrouped by plasmodium species), Outcome 5 Parasitaemia Prevalence 4‐6 months post MDA.
Uncontrolled before‐and‐after studies: Four studies demonstrated a reduction in the prevalence of P. vivax parasitaemia during the first month post‐MDA, although this was of a smaller magnitude than seen for P. falciparum (Analysis 8.3). These studies administered artesunate‐piperaquine plus primaquine (Song 2010 KHM), chloroquine plus pyrimethamine (Paik 1974a SLB) or chloroquine alone (Malaria_Taiwan 1991 TWN; van Dijk 1961 PNG). After one to three months of follow‐up, the impact of MDA on parasitaemia prevalence for P. vivax was smaller than for P. falciparum (Analysis 8.4). By five months of follow‐up, Paik 1974a SLB described greater reductions in parasitaemia prevalence for P. vivax infections compared to P. falciparum cases. In contrast, two studies from Asia (Malaria_Taiwan 1991 TWN; Song 2010 KHM) demonstrated larger reductions in parasitaemia prevalence for P. falciparum at six months (Song 2010 KHM) and after more than 12 months post‐MDA (Malaria_Taiwan 1991 TWN; Song 2010 KHM).
Section 6: Adverse Events
Ten studies reported on adverse events (Archibald 1960 NGA; Comer 1971 PAN; Garfield 1983 NIC; Kaneko 2000 VUT; Kligler 1931 PSE; Najera 1973 NGA; Shekalaghe 2011 TZA; Simeons 1938 IND; Song 2010 KHM; von Seidlein 2003 GMB). Of these, only four studies conducted some level of active adverse event surveillance (Kligler 1931 PSE; Najera 1973 NGA; Shekalaghe 2011 TZA; von Seidlein 2003 GMB).
Kligler 1931 PSE and Song 2010 KHM reported no adverse events.
Minor side effects were reported in three studies (Archibald 1960 NGA; Najera 1973 NGA; von Seidlein 2003 GMB). Two studies conducting MDA with chloroquine plus pyrimethamine (Archibald 1960 NGA; Najera 1973 NGA) reported a number of children vomiting the drug. Complaints of dizziness, fever, diarrhoea, vomiting and itching within two days of taking sulfadoxine‐pyrimethamine and artesunate were reported in von Seidlein 2003 GMB .
Five of the studies (Comer 1971 PAN; Garfield 1983 NIC; Kaneko 2000 VUT; Shekalaghe 2011 TZA; Simeons 1938 IND) reporting adverse events included an 8‐aminoquinoline drug. Comer 1971 PAN described complaints of headache and nausea that were ascribed to pyrimethamine plus primaquine. In Kaneko 2000 VUT, some villagers reported vomiting after taking the tablets (chloroquine and primaquine and sulphadoxine‐pyrimethamine). Common side effects described by Garfield 1983 NIC, which administered chloroquine and primaquine to all persons, included dizziness, nausea, vomiting and diarrhoea. In addition, Garfield 1983 NIC also reported occasional cases of psychomotor disturbance, temporary psychological abnormalities and haemolysis. One study (Shekalaghe 2011 TZA) reported a severe skin reaction one week after MDA with sulphadoxine‐pyrimethamine plus artesunate plus primaquine. This study also reported several cases of moderate anaemia among glucose‐6‐phosphate dehydrogenase (G6PD) deficient participants given primaquine and one case of severe anaemia. Simeons 1938 IND conducted MDA with atebrin intramuscular and plasmochin simplex and reported four cases of haemoglobinuria, a known toxicity of 8‐aminoquinoline drugs. Of those, two cases were fatal; the remaining two cases were mild. Additionally, abscesses were reported in 49 cases, while accounts of 'giddiness' were associated with the drug atebrin.
Discussion
The main findings of this review, alongside assessments of the quality of evidence for each outcome using the GRADE approach, are summarized in three summary of findings tables: Table 14; Table 15; Table 16
6. Summary of findings table: Mass drug administration in areas of low endemicity (≤5%).
| Mass drug administration in areas of low endemicity | |||||||
| Patient or population: People living in malaria endemic areas Settings: Areas with low (≤5%) endemicity Intervention: Mass drug administration (any regimen) Comparison: Placebo or no intervention (or baseline data in before‐and‐after studies) | |||||||
| Timepoint post MDA | Outcomes | Study design | Illustrative comparative risks* (95% CI) | Relative effect (95% CI) | No of studies | Quality of the evidence (GRADE) | |
| Assumed risk | Corresponding risk | ||||||
| Control | MDA | ||||||
| <1 month | Parasite prevalence | Before‐and‐after | 50 per 10001 | 14 per 1000 (7 to 25) | RR 0.27 (0.14 to 0.50) | 1 study | ⊕⊝⊝⊝ very low2,3,4,5 |
| Parasite incidence | ‐ | ‐ | ‐ | ‐ | 0 studies | ‐ | |
| Gametocyte prevalence | ‐ | ‐ | ‐ | ‐ | 0 studies2 | ‐ | |
| 12 months | Parasite prevalence | Before‐and‐after | 50 per 10001 | 1 per 1000 (0 to 6) | RR 0.02 (0 to 0.12) | 1 study | ⊕⊝⊝⊝ very low2,3,4,5 |
| Parasite incidence | ‐ | ‐ | ‐ | ‐ | 0 studies | ‐ | |
| Gametocyte prevalence | ‐ | ‐ | ‐ | ‐ | 0 studies2 | ‐ | |
| The assumed risk has been set at 5%. The corresponding risk (and its 95% CI) is based on the assumed risk in the comparison group and the relative effect of the intervention (and its 95% CI). CI: Confidence interval; RR: Risk Ratio. | |||||||
| GRADE Working Group grades of evidence High quality: Further research is very unlikely to change our confidence in the estimate of effect. Moderate quality: Further research is likely to have an important impact on our confidence in the estimate of effect and may change the estimate. Low quality: Further research is very likely to have an important impact on our confidence in the estimate of effect and is likely to change the estimate. Very low quality: We are very uncertain about the estimate. | |||||||
1 For illustrative purposes the control group prevalence has been set at 5%. 2 Only one cluster‐randomized trial from Tanzania has evaluated MDA in a setting of low endemicity and this study recorded no episodes of parasitaemia or gametocytaemia at baseline or throughout six months follow‐up in either the control or intervention groups. 3 Downgrade by 1 for serious risk of bias: This study is uncontrolled, and so at very high risk of confounding. 4 Downgraded by 1 for serious indirectness: This singe study from Taiwan reported the effects of MDA administered as a single dose of chloroquine (12 mg/kg). Further trials are needed from a variety of settings to have confidence in the results. 5 Compared to baseline data a large reduction in parasite prevalence was seen at 1 month and 12 months post‐MDA.
7. Summary of findings table: Mass drug administration in areas of moderate endemicity (6 to 39%).
| Mass drug administration in areas of moderate endemicity | |||||||
| Patient or population: People living in malaria endemic areas Settings: Areas with moderate malaria endemicity (6‐39%) Intervention: Mass drug administration (any regimen) Comparison: No intervention (or baseline data in before‐and‐after studies) | |||||||
| Timepoint post MDA | Outcomes | Study design | Illustrative comparative risks* (95% CI) | Relative effect (95% CI) | No of studies | Quality of the evidence (GRADE) | |
| Assumed risk | Corresponding risk | ||||||
| Control | MDA | ||||||
| <1 month | Parasitaemia prevalence | Non‐randomized | 250 per 1000 | 5 per 1000 (3 to 15) | RR 0.03 (0.01 to 0.08) | 3 studies | ⊕⊕⊕⊝ moderate1,2,3,4 |
| Before‐and‐after | 250 per 1000 | 73 per 1000 (43 to 120) | RR 0.29 (0.17 to 0.48) | 3 studies | ⊕⊕⊝⊝ low5,3,6 | ||
| Parasitaemia incidence | ‐ | ‐ | ‐ | 0 studies | ‐ | ||
| Gametocytaemia prevalence | Non‐randomized | 100 per 1000 | 28 per 1000 (10 to 82) | RR 0.28 (0.1 to 0.82) | 1 study | ⊕⊝⊝⊝ very low1,7 | |
| Before‐and‐after | 100 per 1000 | 47 per 1000 (25 to 87) | RR 0.47 (0.25 to 0.87) | 3 studies | ⊕⊕⊝⊝ low5,6,8 | ||
| 4‐6 months | Parasitaemia prevalence | Non‐randomized | 250 per 1000 | 70 per 1000 (53 to 95) | RR 0.18 (0.10 to 0.33) | 2 studies | ⊕⊕⊝⊝ low1,3,9 |
| Before‐and‐after | 250 per 1000 | 438 per 1000 (103 to 1000) | RR 1.75 (0.41 to 7.41) | 2 studies | ⊕⊝⊝⊝ very low5,10,11 | ||
| Parasitaemia incidence | ‐ | ‐ | ‐ | ‐ | 0 studies | ‐ | |
| Gametocytaemia prevalence | Non‐randomized | 100 per 1000 | 52 per 1000 (24 to 111) | RR 0.52 (0.24 to 1.11) | 1 study | ⊕⊝⊝⊝ very low12 | |
| Before‐and‐after | 100 per 1000 | 35 per 1000 (12 to 101) | RR 0.35 (0.12 to 1.01) | 1 study | ⊕⊝⊝⊝ very low12 | ||
| The assumed risk for parasitaemia prevalence has been set at 25%. Gametocytaemia prevalence was generally lower in the included studies and the assumed risk has therefore been set at 10%. The corresponding risk (and its 95% CI) is based on the assumed risk in the comparison group and the relative effect of the intervention (and its 95% CI). CI: Confidence interval; RR: Risk Ratio. | |||||||
| GRADE Working Group grades of evidence High quality: Further research is very unlikely to change our confidence in the estimate of effect. Moderate quality: Further research is likely to have an important impact on our confidence in the estimate of effect and may change the estimate. Low quality: Further research is very likely to have an important impact on our confidence in the estimate of effect and is likely to change the estimate. Very low quality: We are very uncertain about the estimate. | |||||||
1 No serious risk of bias: Although there were some differences in prevalence at baseline, these were much smaller in size than the large effects seen post‐intervention. 2 No serious indirectness: These three studies were conducted in Kenya in 1953 and 1954 (pyrimethamine administered every six months for three rounds), and in India in 1953 (amodiaquine administered every two weeks for five rounds). A fourth study from Nigeria in 1973 reported a similar reduction in prevalence during an ongoing MDA program. Although these studies are old, similar effects might be expected today with effective anti‐malarials. 3 No serious inconsistency: Consistent and large reductions were seen in these studies. 4 Upgraded by 1 for large effect size: Very large effects were seen consistently across both controlled and uncontrolled studies. 5 No serious risk of bias: These studies are uncontrolled, and so are at very high risk of confounding. However, as the GRADE approach automatically downgrades non‐randomized controlled studies by two levels for risk of bias we did not further downgrade. 6 No serious indirectness: These three studies were conducted between 1953 and 1961, and administered MDA as: Pyrimethamine once only (Morocco), chloroquine plus pyrimethamine every month for five rounds (Nigeria) and chloroquine every four weeks for 11 rounds (Papua New Guinea). Although these studies are old, similar effects might be expected today with effective anti‐malarials. 7 Downgraded by 1 for serious indirectness: This single trial in Kenya gave pyrimethamine every six months for three rounds. Different regimens may have different effects and primaquine, a drug with gametocytocidal properties, was not given. One further trial from Nigeria in the 1960s, which only reported on prevalence during an ongoing MDA programme, also administered MDA without primaquine. 8 No serious inconsistency: Gametocyte prevalence was lower post‐intervention in all four trials, however there was variation in the size of this effect. 9 No serious indirectness: These two studies are both from Kenya in the 1950s, and both administer MDA as pyrimethamine alone. One study continued follow‐up for > 6 months when an effect was still present. 10 No serious indirectness: These two studies were conducted between 1959 and 1961, and administered MDA as: chloroquine plus pyrimethamine every four months for two rounds (Cameroon), chloroquine plus pyrimethamine every month for five rounds (Nigeria). 11 Downgraded by 1 for serious inconsistency: At this time point results were mixed. One study found a higher prevalence at this time point and one found no difference. 12 Downgraded by 1 for serious indirectness: This single trial found no substantial difference between groups at 4‐6 months. Modern trials with different regimens may have different effects. This study did not administer primaquine as part of MDA.
8. Summary of findings table: Mass drug administration in areas of high endemicity (≥40%).
| Mass drug administration in areas of high endemicity | |||||||
| Patient or population: People living in malaria endemic areas Settings: Areas with high malaria endemicity (≥ 40%) Intervention: Mass drug administration (any regimen) Comparison: No intervention (or baseline data in before‐and‐after studies) | |||||||
| Timepoint post MDA | Outcomes | Study design | Illustrative comparative risks* (95% CI) | Relative effect (95% CI) | No of studies | Quality of the evidence (GRADE) | |
| Assumed risk | Corresponding risk | ||||||
| Control | MDA | ||||||
| < 1 month | Parasitaemia prevalence | Cluster‐randomized | 500 per 1000 | 410 per 1000 (335 to 505) | RR 0.82 (0.67 to 1.01) | 1 study | ⊕⊕⊝⊝ low1,2,3 |
| Non‐randomized | 500 per 1000 | 85 per 1000 (50 to 140) | RR 0.17 (0.10 to 0.28) | 3 studies | ⊕⊕⊕⊝ moderate4,5,6,7 | ||
| Before‐and‐after | 500 per 1000 | 185 per 1000 (140 to 245) | RR 0.37 (0.28 to 0.49) | 4 studies | ⊕⊕⊝⊝ low8,9,10 | ||
| Parasitaemia incidence | Cluster‐randomized | 60 per 1000 | 25 per 1000 (14 to 44) | RR 0.41 (0.23 to 0.73) | 1 study | ⊕⊕⊕⊝ moderate1,2,11 | |
| Gametocytaemia prevalence | Non‐randomized | 100 per 1000 | 16 per 1000 (8 to 30) | RR 0.16 (0.08 to 0.30) | 3 studies | ⊕⊕⊕⊝ moderate4,5,6,7 | |
| Before‐and‐after | 100 per 1000 | 38 per 1000 (13 to 108) | RR 0.38 (0.13 to 1.08) | 3 studies | ⊕⊕⊝⊝ low8,12 | ||
| 4‐6 months | Parasitaemia prevalence | Cluster‐randomized | 500 per 1000 | 580 per 1000 (465 to 720) | RR 1.16 (0.93 to 1.44) | 1 study | ⊕⊕⊕⊝ moderate1,2,13 |
| Non‐randomized | ‐ | ‐ | ‐ | 0 studies | ‐ | ||
| Before‐and‐after | 500 per 1000 | 205 per 1000 (120 to 360) | RR 0.41 (0.24 to 0.72) | 3 studies | ⊕⊕⊝⊝ low8,14 | ||
| Parasitaemia incidence | Cluster‐randomized | 60 per 1000 | 67 per 1000 (52 to 85) | RR 1.11 (0.87 to 1.41) | 1 study | ⊕⊕⊕⊝ moderate1,2,13 | |
| Gametocytaemia prevalence | Cluster‐randomized | 100 per 1000 | 107 per 1000 (62 to 185) | RR 1.07 (0.62 to 1.85) | 1 study | ⊕⊕⊝⊝ low1,2,3 | |
| Non‐randomized | ‐ | ‐ | ‐ | 0 studies | ‐ | ||
| Before‐and‐after | 100 per 1000 | 35 per 1000 (10 to 128) | RR 0.35 (0.10 to 1.28) | 2 studies | ⊕⊝⊝⊝ very low8,15 | ||
| The assumed risk for parasitaemia prevalence has been set at 50%. Gametocytaemia prevalence was generally lower in the included studies and the assumed risk has therefore been set at 10%. The assumed risk for parasitaemia incidence is taken from the control group of the single trial. The corresponding risk (and its 95% CI) is based on the assumed risk in the comparison group and the relative effect of the intervention (and its 95% CI). CI: Confidence interval; RR: Risk ratio. | |||||||
| GRADE Working Group grades of evidence High quality: Further research is very unlikely to change our confidence in the estimate of effect. Moderate quality: Further research is likely to have an important impact on our confidence in the estimate of effect and may change the estimate. Low quality: Further research is very likely to have an important impact on our confidence in the estimate of effect and is likely to change the estimate. Very low quality: We are very uncertain about the estimate. | |||||||
1 No serious risk of bias: This cluster‐randomized trial was at low risk of bias. 2 Downgraded by 1 for serious indirectness: This single study from the Gambia in 1999 administered MDA as AS+SP. The findings may not be easily generalized to other settings, or to alternative MDA regimens. The first time point measured post‐MDA was 1‐3 months. 3 Downgraded by 1 for serious imprecision: The result was not statistically significant but the 95% CI is wide and includes important effects. 4 No serious risk of bias: Although there was some evidence of baseline imbalance between the intervention and control areas, these were generally of smaller magnitude than the effects seen. 5 No serious indirectness: The data presented here were measured during ongoing multiple‐round MDA programmes, not at one month post‐intervention. The studies were conducted in Burkina Faso in 1961 (CQ or AQ plus PQ every two to four weeks), and Nigeria in 1975 (SP given every two weeks or every 10 weeks). Although these studies are old, similar effects might be expected today with effective anti‐malarials. 6 No serious inconsistency: The observed effects were consistently large in all three trials. 7 Upgraded by 1 for the large effect size: Large effects seen in all trials. 8 No serious risk of bias: These studies are uncontrolled, and so are at very high risk of confounding. However, as the GRADE approach automatically downgrades non‐randomized controlled studies by two levels for risk of bias we did not further downgrade. 9 No serious indirectness: These four studies were conducted in Palestine in 1930 (plasmoquine plus quinine every three weeks for three rounds), Burkina Faso in 1959 (pyrimethamine every two weeks), in Malaysia in 1985 (SP + PQ once only), and Cambodia in 2006 (AS + piperaquine once only plus PQ every 10 days). 10 No serious inconsistency: Three studies observed large effects, while one small study found no effect. 11 No serious imprecision: The result is statistically significant. 12 No serious indirectness: Two large studies found large effects in Burkina Faso in the 1950s (pyrimethamine every 2 weeks for 8 rounds), and Palestine in the 1930s (plasmoquine plus quinine every three weeks for three rounds). One small study from Malaysia in the 1980s found no effect. 13 No serious imprecision: The 95% CI excludes clinically important reductions at this time point. 14 No serious inconsistency: The two large studies from Palestine and Cambodia still demonstrated a large reduction at 4‐6 months while the small study from Malaysia found no difference 15 Downgraded by 1 for serious indirectness: Benefits beyond three months have only been demonstrated in this single study from Cambodia. MDA was administered as artesunate plus piperaquine once only followed by primaquine every 10 days for six months.
Summary of main results
Two cluster‐randomized trials, eight non‐randomized controlled studies and 22 uncontrolled before‐and‐after studies are included in this review. The studies used a wide variety of MDA regimens incorporating different drugs, dosages, timings and numbers of MDA rounds. Many of the studies are now more than 30 years old.
Areas of low endemicity (≤5%)
Within the first month post‐MDA, a single uncontrolled before‐and‐after study conducted in 1955 on a small Taiwanese island reported a much lower prevalence of parasitaemia following a single course of chloroquine compared to baseline (very low quality evidence). This lower parasite prevalence was still present after more than 12 months (very low quality evidence) (see Table 14).
Areas of moderate endemicity (6% to 39%)
Within the first month post‐MDA, the prevalence of parasitaemia was much lower in three non‐randomized controlled studies from Kenya and India in the 1950s (moderate quality evidence) and in three uncontrolled before‐and‐after studies conducted between 1954 and 1961 (low quality evidence). The longest follow‐up in these settings was four to six months. At this time point, the prevalence of parasitaemia remained substantially lower than controls in the two non‐randomized controlled studies (low quality evidence). In contrast, the two uncontrolled before‐and‐after studies found mixed results: one found no difference and one found a substantially higher prevalence compared to baseline (very low quality evidence) (see Table 15).
Areas of high endemicity (≥ 40%)
Within the first month post‐MDA, the single cluster‐randomized trial from the Gambia in 1999 found no difference in parasite prevalence (low quality evidence). However, prevalence was much lower during the MDA programmes in three non‐randomized controlled studies conducted in the 1960s and 1970s (moderate quality evidence), and within one month of MDA in four uncontrolled before‐and‐after studies, including one study from Cambodia in 2006 (low quality evidence). Four trials reported changes in prevalence beyond three months. In the Gambia, the single cluster‐randomized trial found no difference at five months (moderate quality evidence). The three uncontrolled before‐and‐after studies had mixed findings with large studies from Palestine and Cambodia showing sustained reductions at four months and 12 months, respectively, and a small study from Malaysia showing no difference after four to six months of follow‐up (low quality evidence) (see Table 16).
MDA + vector control
In general, studies that included a vector control measure showed a large impact on parasitaemia and gametocytaemia prevalence both during MDA and up to three months post‐intervention. In high‐endemicity settings, one large study from Nigeria reported no difference after six months, whereas in moderate endemicity settings one study from an island of Vanuatu and one from the highlands of Uganda noted sustained impact after more than 12 months.
8‐aminoquinolines
We found no studies directly comparing MDA regimens that included 8‐aminoquinolines with regimens that did not. In a crude subgroup analysis with a limited number of studies, we were unable to detect any evidence of additional benefit of primaquine in moderate‐ or high‐transmission settings.
P. falciparum vs P. vivax
Reviewing studies that reported the impact of MDA on P. falciparum and P. vivax separately, most reported a larger impact on P. falciparum than P. vivax at all time intervals.
Adverse events
Adverse events were inadequately addressed in most studies. Notable severe drug reactions, including haemolysis, haemoglobinuria, severe anaemia and death, were reported for the co‐administration of 8‐aminoquinoline plus schizonticide, and severe skin reactions were documented with administration of sulphadoxine‐pyrimethamine plus artesunate plus primaquine.
Overall completeness and applicability of evidence
The studies included in this review were conducted in a variety of settings in Africa, Asia, Europe and the Americas, and employed various designs, endemicities, drug regimens, co‐intervention uses and numbers of rounds of MDA intervention. Comparative studies of malaria interventions are always confounded by differences in background epidemiology between diverse study areas, but, in this case, the situation is made even more difficult by the major differences in design between the studies. Therefore, the findings can be reasonably applied to scenarios that coincide closely with the aforementioned parameters but caution is advised in extrapolating results too broadly; the heterogeneity of the studies included in the overall analysis presents risks when trying to draw conclusions from pooled data. Furthermore, in reviewing these results, it is important to note the different properties of the antimalarials employed for mass treatment. Studies using non‐gametocytocidal antimalarials should be interpreted separately from those using gametocytocidal antimalarials, so as to allow a fair comparison of pharmacodynamic properties. The same precautions should be taken when contrasting the impact of short‐acting antimalarials such as the artemisinin derivatives with the impact of long‐acting antimalarials such as sulphadoxine‐pyrimethamine or piperaquine‐containing combinations.
Gaps remain in the research evidence and some of the evidence presented in this overview has serious limitations. Most studies do not explicitly describe the aims of the MDA programme (eg to interrupt transmission, to reduce transmission, to reduce morbidity from malaria, etc), making it difficult to determine whether studies were successful or not. Numerous studies also did not clearly indicate the timing of MDA in relation to the local transmission season. Too few studies were conducted in low transmission settings to determine the effect of MDA in these settings and the likely impact of this intervention in eliminating malaria. Furthermore, several outcome data included meta‐analyses drawn from only one or two studies. There are exceptions to this, but even within this review the variability and high heterogeneity mean the results may still be difficult to interpret. Under these circumstances, generalizing findings will remain a challenge.
Many of our pre‐specified outcomes were not reported in all individual studies, although the majority of studies at least reported on parasitaemia and gametocytaemia prevalence. Few studies reported on parasitaemia incidence, anaemia prevalence or mortality, making it impossible to make any meaningful conclusions on these outcomes. Furthermore, some of the studies reporting on incidence presented data graphically, making it difficult for reviewers to extrapolate incidence estimates accurately without access to the raw data. Thus, these estimates may be imprecise and must be interpreted with caution.
Quality of the evidence
We assessed the quality of the evidence provided by the included studies using the GRADE approach, and have presented these results in the Table 14, Table 15 and Table 16. The majority of the evidence in this review comes from non‐randomized studies, which in most cases can provide only low or very low quality evidence. However, in some circumstances, very well conducted non‐randomized studies can be upgraded to moderate or high quality evidence if they possess one or more of the following features: 1) a very large treatment effect; 2) evidence of a dose‐response effect; 3) absence of plausible confounders that could be causing the effect.
Most MDA programmes are currently being planned for settings with low endemicity. However, studies of previous MDA programmes in these settings were assessed as providing only 'very low' quality evidence, meaning we cannot have any confidence in these results. The single study that provided any data on malaria prevalence in these settings was conducted in Taiwan in 1955 and is highly susceptible to confounding due to the lack of an adequate control group.
In settings with moderate endemicity, there is moderate quality evidence of substantial reductions in parasitaemia prevalence during the first month post‐MDA. This evidence, from non‐randomized controlled trials, was upgraded due to the consistently large effects seen and the supportive evidence from four uncontrolled before‐and‐after studies. Only two non‐randomized controlled trials followed up beyond three months: one had baseline imbalances, which would lead to an overestimate of the observed effect, and both used MDA regimens that are not under consideration today (pyrimethamine). Consequently, despite the large effect seen, we graded this evidence as low quality.
The majority of studies of MDA have been conducted in high‐transmission settings, where there is again moderate quality evidence from non‐randomized controlled studies of large and consistent effects on parasitaemia prevalence during MDA programmes. However, only a single uncontrolled before‐and‐after study from Cambodia demonstrated effects lasting beyond three months post‐intervention.
Potential biases in the review process
As with all reviews, there are risks of introducing bias at all stages in the review process. Several steps were taken in an attempt to reduce this bias. Throughout the review process, two authors independently assessed eligibility for inclusion of studies, and carried out data extraction. Discrepancies were resolved by a third author. All foreign language papers were included.
Assessing the true impact of MDA programmes can be a challenge for many MDA studies, including those investigating simultaneous vector control efforts and lacking proper control groups. Furthermore, the impact of MDA on transmission is difficult to measure; most studies reported post‐intervention effects for too short a time after the MDA to estimate adequately its impact on long‐term transmission. Furthermore, the studies did not directly assess the potential of MDA to induce or promote drug resistance; however, a few studies (Jones 1954 KEN; Jones 1958 KEN; Ricosse 1959 BFA) did report on the development of drug resistance following the use of pyrimethamine monotherapy.
Agreements and disagreements with other studies or reviews
Antimalarial drug use for MDA has been reviewed previously (Greenwood 2004; von Seidlein 2003). Thirteen of the studies in this current review (Cavalie 1962 CMR; De Zulueta 1961 UGA; De Zulueta 1964 UGA; Escudie 1962 BFA; Garfield 1983 NIC; Hii 1987 MYS; Kaneko 2000 VUT; Kondrashin 1985 IND; Molineaux 1980 NGA; Najera 1973 NGA; Roberts 1964 KEN; Singh 1953 IND; von Seidlein 2003 GMB) were also included in a review of MDA of antimalarial drugs published in 2003. However, several studies included in the von Seidlein 2003 review were excluded from this review. The main reasons for exclusion were: 1) inadequate treatment doses (Barber 1932; Dola 1974; MacCormack 1983; Onori 1972; Strangeways‐Dixon 1950); 2) individually randomized (Doi 1989); 3) insufficient information on outcomes of interest (Yip 1998); and 4) insufficient information on drug administration (Baukapur 1984; Lakshmanacharyulu 1968; Sehgal 1968).
In this review, we agree with the conclusion of von Seidlein 2003 that MDA was generally unsuccessful in interrupting transmission but had a marked effect on parasite prevalence and on the incidence of clinical malaria in some cases. The von Seidlein 2003 review also proposed a role for MDA in the control of epidemics and in the control of malaria in areas with a short transmission season, which this current review did not specifically address. Rather, this review used a systematic approach to demonstrate and quantify the differential impact of MDA on parasitaemia prevalence and incidence and on gametocytaemia prevalence depending on the timing of the post‐MDA outcome measurement. Furthermore, this review assessed the addition of 8‐aminoquinoline drugs into MDA regimens, as well as the differential impact of MDA on different plasmodium species (ie P. falciparum vsP. vivax), which no other review to date has attempted.
The findings of this review also appear to agree with other more recent modelling that suggests MDA could potentially eliminate transmission, and that the probability of this occurring goes up with lower baseline transmission, increased frequency of MDA and the addition of vector control measures (Okell 2011). Furthermore, the findings demonstrate that a single round of MDA will have only short‐term effects in higher transmission settings. Theoretically, multiple rounds of optimally‐timed MDA in a small, isolated community with low baseline transmission could eliminate malaria.
Another model using data from Song 2010 KHM demonstrated that in order to achieve malaria elimination a combination of different strategies is required (Maude 2012). Specifically, MDA with artemisinin‐piperaquine can significantly reduce parasite prevalence in the short term (< 1 year), especially multiple rounds during the low transmission season. The model predicted that the addition of primaquine might enhance the effect of artemisinin‐based combination therapies in controlling or eliminating malaria, but this was not evident from this review. The addition of long‐lasting ITNs further accelerated elimination efforts.
While this review does not completely reconcile the controversies that surround the use of MDA, it summarizes evidence showing that this strategy can reduce malaria burden and transmission in various settings. It also helps to identify gaps in the data and in our understanding of MDA, and can help to guide future antimalarial MDA interventions and their evaluation.
Authors' conclusions
Implications for practice.
MDA of antimalarials using therapeutic doses has an immediate and short‐term impact on parasitaemia prevalence and incidence and on gametocytaemia prevalence in all transmission settings. Although no cluster‐randomized trial showed a sustained impact on these outcomes, a few non‐randomized controlled studies and uncontrolled before‐and‐after studies did show sustained impact lasting beyond six months of follow‐up. Studies with sustained impact were conducted in low or moderate transmission settings and on small islands or in highland areas. There is evidence that MDA produces larger reductions in parasitaemia prevalence for malaria caused by P. falciparum compared to P. vivax. The impact of adding an 8‐aminoquinoline drug remains unclear, although no obvious benefit in moderate and high transmission areas was noted. No study directly compared MDA regimens that included an 8‐aminoquinoline with regimens that did not. Several studies in this review that reported adverse events included an 8‐aminoquinoline drug, with two studies reporting cases of haemolysis.
Still, the optimum transmission scenarios and drug intervention regimens for producing a sustained impact with MDA remain largely unknown. In addition, ensuring high coverage requires overcoming many logistical challenges; in order to achieve high levels of coverage, a target drug profile for MDA must be extremely safe, acceptable and efficacious. Even in settings with highly efficacious drugs, the overall field effectiveness of MDA will be greatly compromised if high coverage of the target population is not achieved.
Significant progress in malaria control has been made in several settings with an associated reduction in parasitaemia prevalence; however, with the limitations of currently available diagnostic tools, the elimination of all parasites may pose a challenge. MDA may be able to achieve the elimination of remaining parasite reservoirs among asymptomatic carriers. However, careful consideration should be given before attempting this approach, especially in light of increasing concern over the emergence and possible spread of artemisinin resistance by falciparum malaria. Geographically isolated areas (ie islands) where importation risk is lower and/or those with seasonal or lower transmission (ie highlands) may be more suited to MDA.
Implications for research.
While most analyses demonstrate favourable short‐term outcomes for MDA, additional high quality, cluster‐randomized trials are required. These should have clearly defined objectives (eg to interrupt transmission, to reduce transmission or to impact malaria morbidity) and include participants of all age‐groups. They also need to be conducted in a variety of transmission and seasonal settings with different epidemiological and socio‐cultural determinants, in order to assess adequately the long‐term impact of MDA on malaria transmission. Specifically, the deficiencies in design of many early studies have complicated the task of summarizing the effect of MDA on transmission. In addition, few studies have adequately assessed transmission endpoints. Rather, most studies use relatively standardized measures for parasitaemia prevalence or incidence. It remains unclear from current studies whether longer beneficial effects would be seen in settings of lower transmission. Studies that use a cluster‐randomized design, with multiple rounds of MDA and a longer duration of follow up, are required for adequately assessing the nature of the effect of MDA on transmission. Furthermore, steps towards standardized approaches for measuring and reporting parasitaemia incidence, adverse events and other secondary outcomes would greatly improve comparability between studies.
The optimal number and interval timing of rounds of MDA also needs to be determined, as does the conditions under which MDA would yield the greatest benefit in terms of malaria endemicity and degree of other control measures. The design of the MDA intervention needs to be adapted for its purpose during initial stages of malaria control programmes, in order to aim for large reductions in parasitaemia prevalence, or during latter stages to clear remaining infections. Also, although there are theoretical benefits to decreasing gametocyte carriage and thus transmission with the use of an 8‐aminoquinoline, the actual benefits of adding it to a blood schizonticide, especially an ACT, need to be carefully studied. Lastly, resistance monitoring should be integrated into future MDA studies to understand better the impact of MDA on the development of drug resistance, especially if used in a setting of already failing drugs.
Acknowledgements
The editorial base for the Cochrane Infectious Diseases Group is funded by the UK Department for International Development (DFID) for the benefit of developing countries. The review is funded by the US Centers of Disease Control and Prevention.
We would like to thank our academic editors (Dr Joseph Okebe, Dr Patricia Graves and Professor Paul Garner) and external reviewers (Brian Greenwood, Roly Gosling, and Peter Olumese) for their help in editing the review at various stages. We thank Sarah Donegan for providing statistical support.
We furthermore thank Christy Cechman for her invaluable support in conducting the literature searches. We would also like to thank Dr Lorenz von Seidlein and Dr Akira Kaneko for providing additional data. Further thanks to Ya‐Ping Shi and others for translating the foreign language papers.
Appendices
Appendix 1. Search strategy
MEDLINE+
A. Anti‐Malarials
exp Antimalarials/ or exp Malaria/ or antimalarial* or anti‐malarial* or ((schizonticidal* or gametocidal* or hypnozoiticidal* or drug* or treatment) and (malaria*))
B. Mass Administration
((mass or coordinate*) adj5 (administ* or distribut* or applicat* or "use" or therap* or treatment*))
EMBASE
A. Anti‐Malarials
exp antimalarial agent/ or exp malaria/ or antimalarial* or anti‐malarial* or ((schizonticidal* or gametocidal* or hypnozoiticidal* or drug* or treatment) and (malaria*))
B. Mass Administration
((mass or coordinate*) adj5 (administ* or distribut* or applicat* or "use" or therap* or treatment*))
COCHRANE LIBRARY
A. Anti‐Malarials
(Must run each MeSH term separately. Ovid syntax used for recording purposes.)
exp Antimalarials/ or exp Malaria/ or antimalarial* or anti‐malarial* or ((schizonticidal* or gametocidal* or hypnozoiticidal* or drug* or treatment) and (malaria*))
B. Mass Administration
((mass or coordinate*) near/5 (administ* or distribut* or applicat* or "use" or therap* or treatment*))
CAB DIRECT
A. Anti‐Malarials
ti=(antimalarial* or anti‐malarial* or ((schizonticidal* or gametocidal* or hypnozoiticidal* or drug* or treatment) and (malaria*))) or ab=(antimalarial* or anti‐malarial* or ((schizonticidal* or gametocidal* or hypnozoiticidal* or drug* or treatment) and (malaria*))) or de="antimalarials"
B. Mass Administration
(mass) and (administ* or distribut* or applicat*)
LILACS
A. Anti‐Malarials
antimalarial* or anti‐malarial* or ((schizonticidal* or gametocidal* or hypnozoiticidal* or drug* or treatment) and (malaria*))
Data and analyses
Comparison 1. MDA versus no MDA in areas of low endemicity (Stratified by study design).
| Outcome or subgroup title | No. of studies | No. of participants | Statistical method | Effect size |
|---|---|---|---|---|
| 1 Parasitaemia Prevalence: Cluster‐randomized trials | 1 | Risk Ratio (M‐H, Random, 95% CI) | Subtotals only | |
| 1.1 At baseline | 1 | 496 | Risk Ratio (M‐H, Random, 95% CI) | 0.0 [0.0, 0.0] |
| 1.2 <1 month post MDA | 1 | 484 | Risk Ratio (M‐H, Random, 95% CI) | 0.0 [0.0, 0.0] |
| 1.3 1‐3 months post MDA | 1 | 794 | Risk Ratio (M‐H, Random, 95% CI) | 0.0 [0.0, 0.0] |
| 1.4 4‐6 months post MDA | 1 | 660 | Risk Ratio (M‐H, Random, 95% CI) | 0.0 [0.0, 0.0] |
| 2 Parasitaemia Prevalence: Uncontrolled before‐and‐after studies | 1 | Risk Ratio (M‐H, Random, 95% CI) | Subtotals only | |
| 2.1 <1 month post MDA | 1 | 3039 | Risk Ratio (M‐H, Random, 95% CI) | 0.27 [0.14, 0.50] |
| 2.2 >12 months post MDA | 1 | 3509 | Risk Ratio (M‐H, Random, 95% CI) | 0.02 [0.00, 0.12] |
| 3 Gametocytaemia Prevalence: Cluster randomized trials | 1 | Risk Ratio (M‐H, Random, 95% CI) | Subtotals only | |
| 3.1 At baseline | 1 | 496 | Risk Ratio (M‐H, Random, 95% CI) | 0.0 [0.0, 0.0] |
| 3.2 < 1 month post MDA | 1 | 484 | Risk Ratio (M‐H, Random, 95% CI) | 0.0 [0.0, 0.0] |
| 3.3 1‐3 months post MDA | 1 | 794 | Risk Ratio (M‐H, Random, 95% CI) | 0.0 [0.0, 0.0] |
| 3.4 4‐6 months post MDA | 1 | 660 | Risk Ratio (M‐H, Random, 95% CI) | 0.0 [0.0, 0.0] |
Comparison 2. MDA versus no MDA in areas of moderate endemicity (Stratified by study design).
| Outcome or subgroup title | No. of studies | No. of participants | Statistical method | Effect size |
|---|---|---|---|---|
| 1 Parasitaemia Prevalence: Non‐randomized controlled studies | 4 | Risk Ratio (M‐H, Random, 95% CI) | Subtotals only | |
| 1.1 At baseline | 4 | 3123 | Risk Ratio (M‐H, Random, 95% CI) | 0.73 [0.43, 1.24] |
| 1.2 During MDA | 1 | 47014 | Risk Ratio (M‐H, Random, 95% CI) | 0.27 [0.25, 0.28] |
| 1.3 < 1 month post MDA | 3 | 1934 | Risk Ratio (M‐H, Random, 95% CI) | 0.03 [0.01, 0.08] |
| 1.4 1‐3 months post MDA | 2 | 1557 | Risk Ratio (M‐H, Random, 95% CI) | 0.15 [0.10, 0.23] |
| 1.5 4‐6 months post MDA | 2 | 1610 | Risk Ratio (M‐H, Random, 95% CI) | 0.18 [0.10, 0.33] |
| 1.6 7‐12 months post MDA | 1 | 600 | Risk Ratio (M‐H, Random, 95% CI) | 0.19 [0.11, 0.33] |
| 2 Parasitaemia Prevalence: Uncontrolled before‐and‐after studies | 7 | Risk Ratio (M‐H, Random, 95% CI) | Subtotals only | |
| 2.1 During MDA | 2 | 7965 | Risk Ratio (M‐H, Random, 95% CI) | 0.17 [0.02, 1.47] |
| 2.2 <1 month post MDA | 3 | 3096 | Risk Ratio (M‐H, Random, 95% CI) | 0.29 [0.17, 0.48] |
| 2.3 1‐3 months post MDA | 4 | 7925 | Risk Ratio (M‐H, Random, 95% CI) | 0.16 [0.08, 0.31] |
| 2.4 4‐6 months post MDA | 2 | 3797 | Risk Ratio (M‐H, Random, 95% CI) | 1.75 [0.41, 7.41] |
| 3 Gametocytaemia Prevalence: Non‐randomized controlled studies | 2 | Risk Ratio (M‐H, Random, 95% CI) | Subtotals only | |
| 3.1 At baseline | 2 | 1622 | Risk Ratio (M‐H, Random, 95% CI) | 1.40 [0.76, 2.57] |
| 3.2 During MDA | 1 | 47014 | Risk Ratio (M‐H, Random, 95% CI) | 0.48 [0.42, 0.54] |
| 3.3 <1 month post MDA | 1 | 433 | Risk Ratio (M‐H, Random, 95% CI) | 0.28 [0.10, 0.82] |
| 3.4 1‐3 months post MDA | 1 | 357 | Risk Ratio (M‐H, Random, 95% CI) | 0.17 [0.03, 0.86] |
| 3.5 4‐6 months post MDA | 1 | 410 | Risk Ratio (M‐H, Random, 95% CI) | 0.52 [0.24, 1.11] |
| 4 Gametocytaemia Prevalence: Uncontrolled before‐and‐after studies | 3 | Risk Ratio (M‐H, Random, 95% CI) | Subtotals only | |
| 4.1 <1 month post MDA | 3 | 3096 | Risk Ratio (M‐H, Random, 95% CI) | 0.47 [0.25, 0.87] |
| 4.2 1‐3 months post MDA | 1 | 294 | Risk Ratio (M‐H, Random, 95% CI) | 0.36 [0.12, 1.12] |
| 4.3 4‐6 months post MDA | 1 | 204 | Risk Ratio (M‐H, Random, 95% CI) | 0.35 [0.12, 1.01] |
Comparison 3. MDA versus no MDA in areas of high endemicity (Stratified by study design).
| Outcome or subgroup title | No. of studies | No. of participants | Statistical method | Effect size |
|---|---|---|---|---|
| 1 Parasitaemia Prevalence: Cluster‐randomized trials | 1 | Risk Ratio (M‐H, Random, 95% CI) | Subtotals only | |
| 1.1 At baseline | 1 | 1376 | Risk Ratio (M‐H, Random, 95% CI) | 0.97 [0.86, 1.10] |
| 1.2 1‐3 months post MDA | 1 | 1800 | Risk Ratio (M‐H, Random, 95% CI) | 0.82 [0.67, 1.01] |
| 1.3 4‐6 months post MDA | 1 | 1089 | Risk Ratio (M‐H, Random, 95% CI) | 1.16 [0.93, 1.44] |
| 2 Parasitaemia Prevalence: Non‐randomized controlled studies | 3 | Risk Ratio (M‐H, Random, 95% CI) | Subtotals only | |
| 2.1 At baseline | 3 | 9395 | Risk Ratio (M‐H, Random, 95% CI) | 0.84 [0.70, 1.00] |
| 2.2 During MDA | 3 | 12561 | Risk Ratio (M‐H, Random, 95% CI) | 0.17 [0.11, 0.27] |
| 2.3 1‐3 months post MDA | 2 | 7197 | Risk Ratio (M‐H, Random, 95% CI) | 0.52 [0.33, 0.81] |
| 3 Parasitaemia Prevalence: Uncontrolled before‐and‐after studies | 7 | Risk Ratio (M‐H, Random, 95% CI) | Subtotals only | |
| 3.1 During MDA | 2 | 2011 | Risk Ratio (M‐H, Random, 95% CI) | 0.10 [0.03, 0.34] |
| 3.2 <1 month post MDA | 4 | 3863 | Risk Ratio (M‐H, Random, 95% CI) | 0.37 [0.28, 0.49] |
| 3.3 1‐3 months post MDA | 4 | 5132 | Risk Ratio (M‐H, Random, 95% CI) | 0.35 [0.15, 0.84] |
| 3.4 4‐6 months post MDA | 3 | 2979 | Risk Ratio (M‐H, Random, 95% CI) | 0.41 [0.24, 0.72] |
| 3.5 7‐12 months post MDA | 1 | 75 | Risk Ratio (M‐H, Random, 95% CI) | 0.72 [0.43, 1.20] |
| 3.6 >12 months post MDA | 1 | 2375 | Risk Ratio (M‐H, Random, 95% CI) | 0.10 [0.07, 0.12] |
| 4 Parasitaemia Incidence: Cluster‐randomized trials | 1 | Rate Ratio (Random, 95% CI) | 0.84 [0.53, 1.32] | |
| 4.1 < 1 month post MDA | 1 | Rate Ratio (Random, 95% CI) | 0.41 [0.23, 0.74] | |
| 4.2 1‐3 months post MDA | 1 | Rate Ratio (Random, 95% CI) | 1.03 [0.75, 1.41] | |
| 4.3 4‐6 months post MDA | 1 | Rate Ratio (Random, 95% CI) | 1.11 [0.84, 1.45] | |
| 5 Gametocytaemia Prevalence: Cluster‐randomized trials | 1 | Risk Ratio (M‐H, Random, 95% CI) | Subtotals only | |
| 5.1 At baseline | 1 | 1376 | Risk Ratio (M‐H, Random, 95% CI) | 0.66 [0.33, 1.29] |
| 5.2 4‐6 months post MDA | 1 | 1414 | Risk Ratio (M‐H, Random, 95% CI) | 1.07 [0.62, 1.85] |
| 6 Gametocytaemia Prevalence: Non‐randomized controlled studies | 3 | Risk Ratio (M‐H, Random, 95% CI) | Subtotals only | |
| 6.1 At baseline | 3 | 9395 | Risk Ratio (M‐H, Random, 95% CI) | 0.72 [0.55, 0.95] |
| 6.2 During MDA | 3 | 12561 | Risk Ratio (M‐H, Random, 95% CI) | 0.17 [0.10, 0.28] |
| 6.3 1‐3 months post MDA | 2 | 7197 | Risk Ratio (M‐H, Random, 95% CI) | 0.55 [0.28, 1.07] |
| 7 Gametocytaemia Prevalence: Uncontrolled before‐and‐after studies | 5 | Risk Ratio (M‐H, Random, 95% CI) | Subtotals only | |
| 7.1 During MDA | 2 | 2011 | Risk Ratio (M‐H, Random, 95% CI) | 0.35 [0.09, 1.40] |
| 7.2 <1 month post MDA | 3 | 2582 | Risk Ratio (M‐H, Random, 95% CI) | 0.38 [0.13, 1.08] |
| 7.3 1‐3 months post MDA | 2 | 1199 | Risk Ratio (M‐H, Random, 95% CI) | 1.14 [0.64, 2.01] |
| 7.4 4‐6 months post MDA | 2 | 2789 | Risk Ratio (M‐H, Random, 95% CI) | 0.35 [0.10, 1.28] |
| 7.5 7‐12 months post MDA | 1 | 75 | Risk Ratio (M‐H, Random, 95% CI) | 0.86 [0.41, 1.79] |
| 7.6 >12 months post MDA | 1 | 2269 | Risk Ratio (M‐H, Random, 95% CI) | 0.09 [0.05, 0.15] |
| 8 Anaemia Prevalence: Cluster‐randomized trials | 1 | Risk Ratio (M‐H, Random, 95% CI) | Subtotals only | |
| 8.1 4‐6 months post MDA | 1 | 1414 | Risk Ratio (M‐H, Random, 95% CI) | 0.84 [0.75, 0.93] |
| 9 Mortality: Cluster‐randomized trials | 1 | Risk Ratio (M‐H, Random, 95% CI) | Subtotals only | |
| 9.1 4‐6 months post MDA | 1 | 3655 | Risk Ratio (M‐H, Random, 95% CI) | 1.43 [0.34, 5.96] |
Comparison 4. MDA + vector control versus no intervention in areas of moderate endemicity (Stratified by study design).
| Outcome or subgroup title | No. of studies | No. of participants | Statistical method | Effect size |
|---|---|---|---|---|
| 1 Parasitaemia Prevalence: Non‐randomized controlled studies | 1 | Risk Ratio (M‐H, Random, 95% CI) | Subtotals only | |
| 1.1 At baseline | 1 | 1080 | Risk Ratio (M‐H, Random, 95% CI) | 2.09 [1.48, 2.98] |
| 1.2 >12 months post MDA | 1 | 1331 | Risk Ratio (M‐H, Random, 95% CI) | 0.10 [0.05, 0.20] |
| 2 Parasitaemia Prevalence: Uncontrolled before‐and‐after studies | 4 | Risk Ratio (M‐H, Random, 95% CI) | Subtotals only | |
| 2.1 During MDA | 2 | 2336 | Risk Ratio (M‐H, Random, 95% CI) | 0.12 [0.02, 0.62] |
| 2.2 <1 month post MDA | 3 | 5006 | Risk Ratio (M‐H, Random, 95% CI) | 0.06 [0.01, 0.33] |
| 2.3 1‐3 months post MDA | 3 | 4724 | Risk Ratio (M‐H, Random, 95% CI) | 0.14 [0.04, 0.57] |
| 2.4 4‐6 months post MDA | 1 | 939 | Risk Ratio (M‐H, Random, 95% CI) | 0.57 [0.39, 0.85] |
| 2.5 >12 months post MDA | 1 | 1758 | Risk Ratio (M‐H, Random, 95% CI) | 0.00 [0.00, 0.03] |
| 3 Gametocytaemia Prevalence: Uncontrolled before‐and‐after studies | 2 | Risk Ratio (M‐H, Random, 95% CI) | Subtotals only | |
| 3.1 During MDA | 2 | 4425 | Risk Ratio (M‐H, Random, 95% CI) | 0.13 [0.06, 0.27] |
| 3.2 < 1 month post MDA | 1 | 1907 | Risk Ratio (M‐H, Random, 95% CI) | 0.01 [0.00, 0.16] |
| 3.3 1‐3 months post MDA | 1 | 1941 | Risk Ratio (M‐H, Random, 95% CI) | 0.22 [0.11, 0.41] |
Comparison 5. MDA + vector control versus no intervention in areas of high endemicity (Stratified by study design).
| Outcome or subgroup title | No. of studies | No. of participants | Statistical method | Effect size |
|---|---|---|---|---|
| 1 Parasitaemia Prevalence: Non‐randomized controlled studies | 3 | Risk Ratio (M‐H, Random, 95% CI) | Subtotals only | |
| 1.1 At baseline | 3 | 8042 | Risk Ratio (M‐H, Random, 95% CI) | 0.56 [0.37, 0.84] |
| 1.2 During MDA | 3 | 9493 | Risk Ratio (M‐H, Random, 95% CI) | 0.10 [0.06, 0.16] |
| 1.3 1‐3 months post MDA | 2 | 4455 | Risk Ratio (M‐H, Random, 95% CI) | 0.12 [0.06, 0.23] |
| 1.4 7‐12 months post MDA | 1 | 3154 | Risk Ratio (M‐H, Random, 95% CI) | 0.60 [0.55, 0.67] |
| 1.5 >12 months post MDA | 1 | 3261 | Risk Ratio (M‐H, Random, 95% CI) | 0.77 [0.70, 0.84] |
| 2 Parasitaemia Prevalence: Uncontrolled before‐and‐after studies | 2 | Risk Ratio (M‐H, Random, 95% CI) | Subtotals only | |
| 2.1 During MDA | 2 | 5437 | Risk Ratio (M‐H, Random, 95% CI) | 0.17 [0.09, 0.31] |
| 2.2 1‐3 months post MDA | 2 | 5440 | Risk Ratio (M‐H, Random, 95% CI) | 0.13 [0.01, 2.51] |
| 2.3 4‐6 months post MDA | 1 | 415 | Risk Ratio (M‐H, Random, 95% CI) | 0.83 [0.66, 1.04] |
| 2.4 7‐12 months post MDA | 1 | 412 | Risk Ratio (M‐H, Random, 95% CI) | 0.93 [0.75, 1.16] |
| 3 Gametocytaemia Prevalence: Non‐randomized controlled studies | 3 | Risk Ratio (M‐H, Random, 95% CI) | Subtotals only | |
| 3.1 At baseline | 3 | 8042 | Risk Ratio (M‐H, Random, 95% CI) | 0.53 [0.31, 0.90] |
| 3.2 During MDA | 3 | 9493 | Risk Ratio (M‐H, Random, 95% CI) | 0.08 [0.03, 0.20] |
| 3.3 1‐3 months post MDA | 2 | 4455 | Risk Ratio (M‐H, Random, 95% CI) | 0.08 [0.05, 0.14] |
| 3.4 7‐12 months post MDA | 1 | 3154 | Risk Ratio (M‐H, Random, 95% CI) | 0.87 [0.73, 1.05] |
| 3.5 > 12 months post MDA | 1 | 3261 | Risk Ratio (M‐H, Random, 95% CI) | 0.96 [0.81, 1.14] |
| 4 Gametocytaemia Prevalence: Uncontrolled before‐and‐after studies | 1 | Risk Ratio (M‐H, Random, 95% CI) | Subtotals only | |
| 4.1 During MDA | 1 | 437 | Risk Ratio (M‐H, Random, 95% CI) | 0.29 [0.17, 0.50] |
| 4.2 1‐3 months post MDA | 1 | 440 | Risk Ratio (M‐H, Random, 95% CI) | 0.52 [0.34, 0.80] |
| 4.3 4‐6 months post MDA | 1 | 415 | Risk Ratio (M‐H, Random, 95% CI) | 0.76 [0.52, 1.12] |
| 4.4 7‐12 months post MDA | 1 | 412 | Risk Ratio (M‐H, Random, 95% CI) | 0.93 [0.65, 1.33] |
Comparison 6. Parasitaemia Incidence studies.
| Outcome or subgroup title | No. of studies | No. of participants | Statistical method | Effect size |
|---|---|---|---|---|
| 1 MDA versus no MDA: Uncontrolled before‐and‐after studies | 4 | Rate Ratio (Random, 95% CI) | Subtotals only | |
| 1.1 During MDA | 3 | Rate Ratio (Random, 95% CI) | 0.29 [0.07, 1.14] | |
| 1.2 < 1 month post MDA | 4 | Rate Ratio (Random, 95% CI) | 0.21 [0.05, 0.84] | |
| 1.3 1‐3 months post MDA | 4 | Rate Ratio (Random, 95% CI) | 0.61 [0.26, 1.40] | |
| 1.4 4‐6 months post MDA | 1 | Rate Ratio (Random, 95% CI) | 0.65 [0.41, 1.02] | |
| 1.5 7‐12 months post MDA | 1 | Rate Ratio (Random, 95% CI) | 0.15 [0.07, 0.34] | |
| 1.6 >12 months post MDA | 1 | Rate Ratio (Random, 95% CI) | 0.48 [0.42, 0.55] | |
| 2 MDA + vector control versus no MDA: Uncontrolled before‐and‐after studies | 2 | Rate Ratio (Random, 95% CI) | Subtotals only | |
| 2.1 During MDA | 2 | Rate Ratio (Random, 95% CI) | 0.92 [0.49, 1.75] | |
| 2.2 < 1 month post MDA | 2 | Rate Ratio (Random, 95% CI) | 0.04 [0.00, 1.54] | |
| 2.3 1‐3 months post MDA | 2 | Rate Ratio (Random, 95% CI) | 0.08 [0.01, 0.98] | |
| 2.4 4‐6 months post MDA | 2 | Rate Ratio (Random, 95% CI) | 0.11 [0.01, 1.97] | |
| 2.5 7‐12 months post MDA | 2 | Rate Ratio (Random, 95% CI) | 0.16 [0.01, 3.10] | |
| 2.6 > 12 months post MDA | 1 | Rate Ratio (Random, 95% CI) | 0.04 [0.03, 0.07] |
Comparison 7. MDA versus no MDA in areas of moderate and high endemicity (Stratified by study design; subgrouped by 8‐aminoquinoline).
| Outcome or subgroup title | No. of studies | No. of participants | Statistical method | Effect size |
|---|---|---|---|---|
| 1 Parasitaemia Prevalence during MDA | 4 | Risk Ratio (M‐H, Random, 95% CI) | Subtotals only | |
| 1.1 Non‐randomized controlled studies ‐ with 8‐aminoquinoline | 2 | 6634 | Risk Ratio (M‐H, Random, 95% CI) | 0.20 [0.12, 0.32] |
| 1.2 Non‐randomized controlled studies ‐ without 8‐aminoquinoline | 2 | 52941 | Risk Ratio (M‐H, Random, 95% CI) | 0.16 [0.08, 0.31] |
| 2 Parasitaemia Prevalence 1‐3 months post MDA | 4 | Risk Ratio (M‐H, Random, 95% CI) | Subtotals only | |
| 2.1 Non‐randomized controlled studies ‐ with 8‐aminoquinoline | 2 | 7197 | Risk Ratio (M‐H, Random, 95% CI) | 0.52 [0.33, 0.81] |
| 2.2 Non‐randomized controlled studies ‐ without 8‐aminoquinoline | 2 | 1557 | Risk Ratio (M‐H, Random, 95% CI) | 0.15 [0.10, 0.23] |
| 3 Parasitaemia Prevalence during MDA | 4 | Risk Ratio (M‐H, Random, 95% CI) | Subtotals only | |
| 3.1 Uncontrolled before‐and‐after studies ‐ with 8‐aminoquinoline | 1 | 2965 | Risk Ratio (M‐H, Random, 95% CI) | 0.06 [0.03, 0.10] |
| 3.2 Uncontrolled before‐and‐after studies ‐ without 8‐aminoquinoline | 3 | 7011 | Risk Ratio (M‐H, Random, 95% CI) | 0.17 [0.06, 0.51] |
| 4 Parasitaemia Prevalence <1 month post MDA | 7 | Risk Ratio (M‐H, Random, 95% CI) | Subtotals only | |
| 4.1 Uncontrolled before‐and‐after studies ‐ with 8‐aminoquinoline | 3 | 2650 | Risk Ratio (M‐H, Random, 95% CI) | 0.42 [0.29, 0.61] |
| 4.2 Uncontrolled before‐and‐after studies ‐ without 8‐aminoquinoline | 4 | 4309 | Risk Ratio (M‐H, Random, 95% CI) | 0.29 [0.22, 0.38] |
| 5 Parasitaemia Prevalence 1‐3 months post MDA | 7 | Risk Ratio (M‐H, Fixed, 95% CI) | Subtotals only | |
| 5.1 Uncontrolled before‐and‐after studies ‐ with 8‐aminoquinoline | 1 | 98 | Risk Ratio (M‐H, Fixed, 95% CI) | 0.65 [0.41, 1.01] |
| 5.2 Uncontrolled before‐and‐after studies ‐ without 8‐aminoquinoline | 6 | 12959 | Risk Ratio (M‐H, Fixed, 95% CI) | 0.32 [0.29, 0.34] |
| 6 Parasitaemia Prevalence 4‐6 months post MDA | 5 | Risk Ratio (M‐H, Random, 95% CI) | Subtotals only | |
| 6.1 Uncontrolled before‐and‐after studies ‐ with 8‐aminoquinoline | 3 | 2979 | Risk Ratio (M‐H, Random, 95% CI) | 0.41 [0.24, 0.72] |
| 6.2 Uncontrolled before‐and‐after studies ‐ without 8‐aminoquinoline | 2 | 3797 | Risk Ratio (M‐H, Random, 95% CI) | 1.75 [0.41, 7.41] |
Comparison 8. MDA versus no MDA for all endemicity levels (Stratified by study design; subgrouped by plasmodium species).
| Outcome or subgroup title | No. of studies | No. of participants | Statistical method | Effect size |
|---|---|---|---|---|
| 1 Parasitaemia Prevalence at baseline | 2 | Risk Ratio (M‐H, Random, 95% CI) | Subtotals only | |
| 1.1 Non‐randomized controlled studies ‐ falciparum | 2 | 1537 | Risk Ratio (M‐H, Random, 95% CI) | 1.34 [1.03, 1.74] |
| 1.2 Non‐randomized controlled studies ‐ vivax | 2 | 1537 | Risk Ratio (M‐H, Random, 95% CI) | 3.84 [1.33, 11.04] |
| 2 Parasitaemia Prevalence during MDA | 2 | Risk Ratio (M‐H, Random, 95% CI) | Subtotals only | |
| 2.1 Uncontrolled before‐and‐after studies ‐ falciparum | 2 | 5561 | Risk Ratio (M‐H, Random, 95% CI) | 0.40 [0.08, 1.97] |
| 2.2 Uncontrolled before‐and‐after studies ‐ vivax | 2 | 5561 | Risk Ratio (M‐H, Random, 95% CI) | 0.60 [0.40, 0.90] |
| 3 Parasitaemia Prevalence <1 month post MDA | 5 | Risk Ratio (M‐H, Random, 95% CI) | Subtotals only | |
| 3.1 Non‐randomized controlled studies ‐ falciparum | 1 | 433 | Risk Ratio (M‐H, Random, 95% CI) | 0.02 [0.00, 0.08] |
| 3.2 Non‐randomized controlled studies ‐ vivax | 1 | 433 | Risk Ratio (M‐H, Random, 95% CI) | 0.05 [0.00, 0.82] |
| 3.3 Uncontrolled before‐and‐after studies ‐ falciparum | 4 | 7367 | Risk Ratio (M‐H, Random, 95% CI) | 0.22 [0.18, 0.29] |
| 3.4 Uncontrolled before‐and‐after studies ‐ vivax | 4 | 7367 | Risk Ratio (M‐H, Random, 95% CI) | 0.50 [0.41, 0.61] |
| 4 Parasitaemia Prevalence 1‐3 months post MDA | 3 | Risk Ratio (M‐H, Random, 95% CI) | Subtotals only | |
| 4.1 Non‐randomized controlled studies ‐ falciparum | 1 | 357 | Risk Ratio (M‐H, Random, 95% CI) | 0.03 [0.01, 0.12] |
| 4.2 Non‐randomized controlled studies ‐ vivax | 1 | 357 | Risk Ratio (M‐H, Random, 95% CI) | 1.37 [0.46, 4.11] |
| 4.3 Uncontrolled before‐and‐after studies ‐ falciparum | 2 | 5754 | Risk Ratio (M‐H, Random, 95% CI) | 0.22 [0.09, 0.51] |
| 4.4 Uncontrolled before‐and‐after studies ‐ vivax | 2 | 5754 | Risk Ratio (M‐H, Random, 95% CI) | 0.49 [0.32, 0.76] |
| 5 Parasitaemia Prevalence 4‐6 months post MDA | 3 | Risk Ratio (M‐H, Random, 95% CI) | Subtotals only | |
| 5.1 Non‐randomized controlled studies ‐ falciparum | 1 | 410 | Risk Ratio (M‐H, Random, 95% CI) | 0.22 [0.14, 0.33] |
| 5.2 Non‐randomized controlled studies ‐ vivax | 1 | 410 | Risk Ratio (M‐H, Random, 95% CI) | 0.81 [0.31, 2.08] |
| 5.3 Uncontrolled before‐and‐after studies ‐ falciparum | 2 | 3642 | Risk Ratio (M‐H, Random, 95% CI) | 0.40 [0.13, 1.23] |
| 5.4 Uncontrolled before‐and‐after studies ‐ vivax | 2 | 3642 | Risk Ratio (M‐H, Random, 95% CI) | 0.31 [0.24, 0.39] |
| 6 Parasitaemia Prevalence >12 months post MDA | 3 | Risk Ratio (M‐H, Random, 95% CI) | Subtotals only | |
| 6.1 Non‐randomized controlled studies ‐ falciparum | 1 | 1331 | Risk Ratio (M‐H, Random, 95% CI) | 0.01 [0.00, 0.13] |
| 6.2 Non‐randomized controlled studies ‐ vivax | 1 | 1331 | Risk Ratio (M‐H, Random, 95% CI) | 0.36 [0.15, 0.86] |
| 6.3 Uncontrolled before‐and‐after studies ‐ falciparum | 2 | 5884 | Risk Ratio (M‐H, Random, 95% CI) | 0.06 [0.04, 0.09] |
| 6.4 Uncontrolled before‐and‐after studies ‐ vivax | 2 | 5884 | Risk Ratio (M‐H, Random, 95% CI) | 0.17 [0.12, 0.24] |
8.2. Analysis.
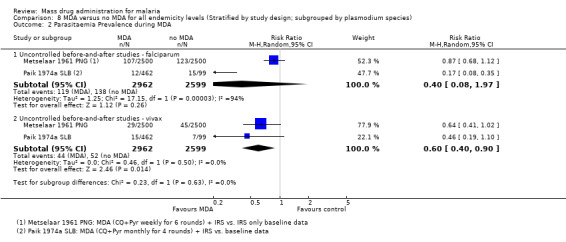
Comparison 8 MDA versus no MDA for all endemicity levels (Stratified by study design; subgrouped by plasmodium species), Outcome 2 Parasitaemia Prevalence during MDA.
8.6. Analysis.
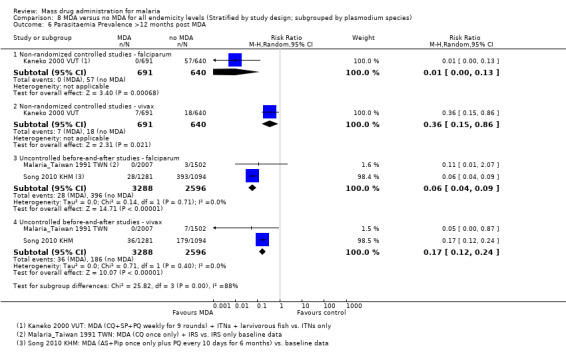
Comparison 8 MDA versus no MDA for all endemicity levels (Stratified by study design; subgrouped by plasmodium species), Outcome 6 Parasitaemia Prevalence >12 months post MDA.
Characteristics of studies
Characteristics of included studies [ordered by study ID]
Archibald 1960 NGA.
| Methods | Dates of study: 1957‐1959 Location of study: Nigeria Malaria endemicity (prevalence): Intervention group 1 (Arugungu ‐ June 1958): 28% in children 1‐10 years; 29% in children 0‐15 years [Moderate]. Intervention group 1 (Gulmare and Koei ‐ October 1957): 64% in children 1‐10 years; 58.3% in children 0‐15 years [High]. Transmission season: June to October Malaria species: P. falciparum, P. malariae Vector species: A. gambiae, A. funestus Study design: Uncontrolled before‐and‐after study Evaluation design: Cross‐sectional surveys |
|
| Participants | Age groups included: All ages Sample size Intervention group 1 (mean): 10,000 Intervention group 2 (mean): 1300 |
|
| Interventions | Intervention group 1 (Arugungu): MDA to all persons with chloroquine 600 mg and pyrimethamine 25 mg given monthly from June to October 1958. Coverage not specified. Co‐intervention with IRS. Intervention group 2 (Gulmare and Koei): MDA to all persons with chloroquine 600 mg and pyrimethamine 25 mg given every six months (November 1957, May 1958, November 1958 and March 1959). Coverage not specified. Co‐intervention with IRS. |
|
| Outcomes | Parasitaemia prevalence Gametocytaemia prevalence No adverse event surveillance conducted Adverse events reported: "There were substantial difficulties with toddlers taking chloroquine and a number of them vomited that drug." |
|
| Notes | MDA added to IRS programme. The outcomes for intervention groups 1 and 2 were assessed in a sub‐sample of the treated population. A third intervention group received only pyrimethamine 25 mg but was not included in the meta‐analysis due to reports of rapid development of resistance. | |
| Risk of bias | ||
| Bias | Authors' judgement | Support for judgement |
| Random sequence generation (selection bias) | High risk | No comparison group |
| Allocation concealment (selection bias) | High risk | No comparison group |
| Baseline imbalance (selection bias) | High risk | No comparison group |
| Contamination protection | High risk | No comparison group |
| Blinding of participants and personnel (performance bias) All outcomes | High risk | No comparison group |
| Blinding of outcome assessment (detection bias) All outcomes | High risk | No comparison group |
| Incomplete outcome data (attrition bias) All outcomes | Low risk | The highest number of confirmed absentees reported by the investigators in September 1958 in Argungu was only 625 (6%). |
| Selective reporting (reporting bias) | High risk | The number of children examined varied greatly between surveys without any explanation and a very small number of children were examined in Arugungu. |
| Other bias | High risk | Anecdotes of ill effects began to circulate and there was evidence of 'palming' of tablets. |
Cavalie 1962 CMR.
| Methods | Dates of study: 1960‐1961 Location of study: Cameroon Malaria endemicity (prevalence): Intervention group 1: 20% in children 2‐9 years [Moderate]; 13% in all ages. Intervention group 2: 76% in children 2‐9 years; 65% in all ages [High]. Transmission season: May to June, November to December Malaria species: P. falciparum, P. malariae Vector species: A. gambiae, A. funestus Study design: Uncontrolled before‐and‐after study Evaluation design: Cross‐sectional surveys |
|
| Participants | Age groups included: Ages > 3 months Sample size Intervention group 1 (mean): 22,500 Intervention group 2 (mean): 7000 |
|
| Interventions | Intervention group 1 (Secteur Sud): MDA administered to all persons aged > 3 months with chloroquine 600 mg and pyrimethamine 50 mg once for two rounds in July and November 1960. Coverage 76‐92%. Co‐intervention with IRS using DDT. Intervention group 2 (Secteur Nord): MDA administered to all persons aged > 3 months with chloroquine 600 mg and pyrimethamine 50 mg once for one round in November 1960. Coverage approximately 100%. Co‐intervention with IRS using DDT. |
|
| Outcomes | Parasitaemia prevalence No adverse event surveillance conducted No adverse events reported |
|
| Notes | Data presented in Table XV was used in the meta‐analysis. Parasitaemia prevalence results only presented for children > 3 months to 9 years of age; meta‐analysis includes only first round data. Only 13 mixed infections of P. falciparum and P. malariae were found. The remaining were P. falciparum infections only. | |
| Risk of bias | ||
| Bias | Authors' judgement | Support for judgement |
| Random sequence generation (selection bias) | High risk | No comparison group |
| Allocation concealment (selection bias) | High risk | No comparison group |
| Baseline imbalance (selection bias) | High risk | No comparison group |
| Contamination protection | High risk | No comparison group |
| Blinding of participants and personnel (performance bias) All outcomes | High risk | No comparison group |
| Blinding of outcome assessment (detection bias) All outcomes | High risk | No comparison group |
| Incomplete outcome data (attrition bias) All outcomes | Unclear risk | Insufficient reporting of attrition/exclusions to permit judgement. No reasons for missing data provided. |
| Selective reporting (reporting bias) | Unclear risk | Insufficient information to permit judgement |
| Other bias | Low risk | No other bias detected |
Comer 1971 PAN.
| Methods | Dates of study: 1965‐1968 Location of study: Panama Malaria endemicity (prevalence): 17.4% in all ages [Moderate] Transmission season: Rainy season late May to late December Malaria species: P. falciparum, P. vivax Vector species: Not specified Study design: Uncontrolled before‐and‐after study Evaluation design: Cross‐sectional surveys |
|
| Participants | Age groups included: Ages > 6 months Sample size Intervention group 1 mean (range): 1709 (1548 ‐ 1908) |
|
| Interventions | Intervention group 1 (Valle del Rio Sambu): MDA to all persons aged > 6 months with pyrimethamine 50 mg (cycles 1‐25)/ 75 mg (cycles 26‐49) and primaquine 40 mg given every 2 weeks for 2 years from August 1966 to April 1968. Coverage 61‐87%. No co‐interventions. | |
| Outcomes | Parasitaemia prevalence No adverse event surveillance conducted Adverse events reported: The acceptance of drugs by the population was excellent. Complaints of nausea and headache were reported, but no other serious side effects were described. None of the people who complained of headaches or nausea refused to take the medicine in subsequent cycles. The number of people who refused to take the medicine was < 1% of the population covered by the programme. |
|
| Notes | No post‐intervention data | |
| Risk of bias | ||
| Bias | Authors' judgement | Support for judgement |
| Random sequence generation (selection bias) | High risk | No comparison group |
| Allocation concealment (selection bias) | High risk | No comparison group |
| Baseline imbalance (selection bias) | High risk | No comparison group |
| Contamination protection | High risk | No comparison group |
| Blinding of participants and personnel (performance bias) All outcomes | High risk | No comparison group |
| Blinding of outcome assessment (detection bias) All outcomes | High risk | No comparison group |
| Incomplete outcome data (attrition bias) All outcomes | Low risk | Coupon system used to track patients; all persons included in the surveys. |
| Selective reporting (reporting bias) | Low risk | All intended outcomes reported |
| Other bias | Low risk | No other bias detected |
Cáceres Garcia 2008 VEN.
| Methods | Dates of study: 2002‐2007 Location of study: Venezuela Malaria endemicity (incidence): 22/1000 monthly incidence in all ages Transmission season: November Malaria species: P. vivax Vector species: Not specified Study design: Uncontrolled before‐and‐after study Evaluation design: Passive surveillance |
|
| Participants | Age groups included: Ages > 6 months; non‐pregnant Sample size Intervention group 1: 25,722 |
|
| Interventions | Intervention group 1 (6 municipalities in Estado Sucre): MDA to all non‐pregnant persons aged >6 months with chloroquine 25 mg/kg administered over 3 days and primaquine 3.5 mg/kg administered over 7 days in November 2002. Coverage 77% (of census)/ 86% (of included). No co‐intervention specified. | |
| Outcomes | Parasitaemia incidence No adverse event surveillance conducted No adverse events reported |
|
| Notes | MDA done in setting of an outbreak | |
| Risk of bias | ||
| Bias | Authors' judgement | Support for judgement |
| Random sequence generation (selection bias) | High risk | No comparison group |
| Allocation concealment (selection bias) | High risk | No comparison group |
| Baseline imbalance (selection bias) | High risk | No comparison group |
| Contamination protection | High risk | No comparison group |
| Blinding of participants and personnel (performance bias) All outcomes | High risk | No comparison group |
| Blinding of outcome assessment (detection bias) All outcomes | High risk | No comparison group |
| Incomplete outcome data (attrition bias) All outcomes | Low risk | Passive surveillance of large municipalities after one round of treatment |
| Selective reporting (reporting bias) | Low risk | No evidence of selective reporting |
| Other bias | Low risk | No other bias detected |
De Zulueta 1961 UGA.
| Methods | Dates of study: 1959‐1960 Location of study: Uganda Malaria endemicity (prevalence): 34% in children 2‐9 years; 17% in all ages [Moderate] Transmission season: Rainy season April to May, August to November Malaria species: P. falciparum, P. malariae Vector species: A. gambiae, A. funestus Study design: Uncontrolled before‐and‐after study Evaluation design: Cross‐sectional surveys |
|
| Participants | Age groups included: All ages Sample size Intervention group 1 mean (range): 30,384 (10,303 ‐ 59,605) |
|
| Interventions | Intervention group 1 (North Kigezi): MDA administered to all persons with chloroquine 600 mg and pyrimethamine 50 mg every three months for four rounds at the time of IRS application from May 1959 to May 1960. Coverage 80%. Co‐intervention with IRS. | |
| Outcomes | Parasitaemia prevalence Gametocytaemia prevalence No adverse event surveillance conducted No adverse events reported |
|
| Notes | Outcomes assessed in a sub‐sample of the treated population. | |
| Risk of bias | ||
| Bias | Authors' judgement | Support for judgement |
| Random sequence generation (selection bias) | High risk | No comparison group |
| Allocation concealment (selection bias) | High risk | No comparison group |
| Baseline imbalance (selection bias) | High risk | No comparison group |
| Contamination protection | High risk | No comparison group |
| Blinding of participants and personnel (performance bias) All outcomes | High risk | No comparison group |
| Blinding of outcome assessment (detection bias) All outcomes | High risk | No comparison group |
| Incomplete outcome data (attrition bias) All outcomes | Low risk | Cooperation of the local inhabitants was remarkably good and not a single dwelling was left unsprayed |
| Selective reporting (reporting bias) | Low risk | Increased number of samples from hyperendemic areas in the post‐intervention survey |
| Other bias | Low risk | No other bias detected |
De Zulueta 1964 UGA.
| Methods | Dates of study: 1960 Location of study: Uganda Malaria endemicity (prevalence): 23% in children 2‐9 years; 21% in all ages [Moderate] Transmission season: Rainy season April to May, August to November Malaria species: P. falciparum, P. malariae Vector species: A. gambiae Study design: Uncontrolled before‐and‐after study Evaluation design: Cross‐sectional surveys |
|
| Participants | Age groups included: Ages > 3 months Sample size Intervention group 1 (mean): 16,000 |
|
| Interventions | Intervention group 1 (Lake Bunyonyi): MDA to all persons aged > 3 months with chloroquine 600 mg and pyrimethamine 50 mg once per round for two rounds (April to May 1960 and September to October 1960). Coverage approximately 50% in the first round. Co‐intervention with IRS. | |
| Outcomes | Parasitaemia prevalence No adverse event surveillance conducted No adverse events reported |
|
| Notes | Outcomes assessed in a sub‐sample of the treated population. A. funestus disappeared after one year of spraying and no new malaria cases were noted two years later. | |
| Risk of bias | ||
| Bias | Authors' judgement | Support for judgement |
| Random sequence generation (selection bias) | High risk | No comparison group |
| Allocation concealment (selection bias) | High risk | No comparison group |
| Baseline imbalance (selection bias) | High risk | No comparison group |
| Contamination protection | High risk | No comparison group |
| Blinding of participants and personnel (performance bias) All outcomes | High risk | No comparison group |
| Blinding of outcome assessment (detection bias) All outcomes | High risk | No comparison group |
| Incomplete outcome data (attrition bias) All outcomes | Unclear risk | Insufficient detail, but the total number surveyed differs greatly between surveys |
| Selective reporting (reporting bias) | Low risk | All relevant outcomes were measured |
| Other bias | High risk | Only about half of the population was given MDA during the first round |
Escudie 1962 BFA.
| Methods | Dates of study: 1960‐1961 Location of study: Burkina Faso Malaria endemicity (prevalence): Comparison group 1: 56.1% in children 0‐10 years [High] Transmission season: June to December Malaria species: P. falciparum, P. ovale, P. malariae Vector species: A. gambiae, A. funestus, A. nili Study design: Non‐randomized controlled study Evaluation design: Cross‐sectional surveys |
|
| Participants | Age group included: All ages Sample size Intervention group 1 (mean): 1890 Intervention group 2 (mean): 2560 Intervention group 3 (mean): 5400 Intervention group 4 (mean): 3490 Comparison group 1 (mean): Not described Comparison group 2 (mean): Not described |
|
| Interventions | Intervention group 1: MDA to all persons with a single dose of either chloroquine‐primaquine (600 mg/15 mg) or amodiaquine‐primaquine (600 mg/15 mg) every 28 days from June to December 1960. Coverage 75.2 to 91.2%. No co‐interventions. Intervention group 2: MDA to all persons with a single dose of either chloroquine‐primaquine (600 mg/15 mg) or amodiaquine‐primaquine (600 mg/15 mg) every 14 days from June to December 1960. Coverage 84.1 to 96.5%. No co‐interventions. Intervention group 3: MDA to all persons with a single dose of either chloroquine‐primaquine (600 mg/15 mg) or amodiaquine‐primaquine (600 mg/15 mg) every 28 days from June to December 1960. Coverage 80.9 to 91.8%. Co‐intervention with IRS using DDT annually. Intervention group 4: MDA to all persons with a single dose of either chloroquine‐primaquine (600 mg/15 mg) or amodiaquine‐primaquine (600 mg/15 mg) every 14 days from June to December 1960. Coverage 82.1 to 93.8%. Co‐intervention with IRS using DDT annually. Comparison group 1: Control villages. No co‐interventions. Comparison group 2: Villages sprayed with IRS using DDT annually. No other co‐interventions. |
|
| Outcomes | Parasitaemia prevalence Gametocytaemia prevalence No adverse event surveillance conducted No adverse events reported |
|
| Notes | Outcomes assessed in a sub‐sample of the treated population (children 0‐10 years). Baseline data from June 1960 survey. Ninety percent of cases are P. falciparum infections; P. ovale is rare and P. malariae is very rare. | |
| Risk of bias | ||
| Bias | Authors' judgement | Support for judgement |
| Random sequence generation (selection bias) | High risk | Assignment to MDA was not randomized although drug assignment was randomized |
| Allocation concealment (selection bias) | High risk | Non‐randomized controlled study |
| Baseline imbalance (selection bias) | High risk | Baseline parasitaemia estimates are not balanced between the intervention groups and the comparison groups. Also, there was large variability in endemicity between comparison group 1 villages. |
| Contamination protection | Unclear risk | Insufficient information to permit judgement |
| Blinding of participants and personnel (performance bias) All outcomes | Unclear risk | Participants and personnel aware of treatment, but unclear if this impacted outcomes |
| Blinding of outcome assessment (detection bias) All outcomes | Unclear risk | Not blinded, but unclear if this impacted outcomes |
| Incomplete outcome data (attrition bias) All outcomes | Low risk | Adults included in MDA, but not in the evaluation. Only children 0‐10 years of age were examined in the malaria surveys before, during and after MDA. |
| Selective reporting (reporting bias) | Low risk | All pre‐specified outcomes of interest are reported |
| Other bias | Unclear risk | Atypical seasonal changes experienced in 1959‐1960, but it is unclear if these changes impacted outcomes. |
Gabaldon 1959 VEN.
| Methods | Dates of study: 1956‐1957 Location of study: Venezuela Malaria endemicity (incidence): 0.4/1000 baseline monthly incidence Transmission season: May to November Malaria species: P. vivax Vector species: A. aquasalis, A. nuneztovari Study design: Uncontrolled before‐and‐after study Evaluation design: Active and passive surveillance |
|
| Participants | Age groups included: Ages > 1 month Sample size Intervention group 1 (mean): 111,995 |
|
| Interventions | Intervention group 1: Eastern Venezuela (174 localities, 3084 houses, 16,416 persons) and Western Venezuela (735 localities, 17,638 houses, 95,579 persons): MDA to all persons aged > 1 month with pyrimethamine 50 mg per week for 24 weeks from July 1957 to December 1957. Coverage not specified. Co‐intervention with IRS. | |
| Outcomes | Parasitaemia incidence No adverse event surveillance conducted No adverse events reported |
|
| Notes | MDA added to IRS program | |
| Risk of bias | ||
| Bias | Authors' judgement | Support for judgement |
| Random sequence generation (selection bias) | High risk | No comparison group |
| Allocation concealment (selection bias) | High risk | No comparison group |
| Baseline imbalance (selection bias) | High risk | No comparison group |
| Contamination protection | High risk | No comparison group |
| Blinding of participants and personnel (performance bias) All outcomes | High risk | No comparison group |
| Blinding of outcome assessment (detection bias) All outcomes | High risk | No comparison group |
| Incomplete outcome data (attrition bias) All outcomes | Low risk | All houses numbered. Envelope system for drug dispensers and slide collectors. Cooperation of the people was excellent. Active search for all infections and passive search at all medical dispensaries in the area. |
| Selective reporting (reporting bias) | Low risk | Most persons received more than 19 treatments; however, the actual figures are not reported due to "lack of mechanical tabulation of the data". The number of persons with relapses who had less than 19 treatments demonstrated similar trends to those who received 19 or more treatments. |
| Other bias | Low risk | No other bias detected |
Garfield 1983 NIC.
| Methods | Dates of study: 1981‐1982 Location of study: Nicaragua Malaria endemicity (incidence): 0.4/1000 baseline monthly incidence Transmission season: November to March Malaria species: P. falciparum, P. vivax Vector species: A. albimanus Study design: Uncontrolled before‐and‐after study Evaluation design: Passive surveillance |
|
| Participants | Age groups included: Ages > 1 year Sample size Intervention group 1 (mean): 2,300,000 |
|
| Interventions | Intervention group 1: MDA administered to all persons aged > 1 year with chloroquine 1500 mg and primaquine 45 mg over three days given once to the entire population of Nicaragua in November 1981. Coverage 70‐80%. Co‐intervention with larviciding using large scale application of temephos to peridomiciliary breeding sites targeting Aedes aegypti, but likely to have an effect on anophelines. | |
| Outcomes | Parasitaemia incidence No adverse event surveillance conducted Adverse events reported: Common side effects included dizziness, nausea, vomiting and diarrhoea. Occasional cases of psychomotor disturbance, temporary psychological abnormalities and haemolysis. |
|
| Notes | Data used in the meta‐analysis was extrapolated from graphs presented in the text; baseline MDA estimates were determined using monthly surveillance data from 1974‐1981. | |
| Risk of bias | ||
| Bias | Authors' judgement | Support for judgement |
| Random sequence generation (selection bias) | High risk | No comparison group |
| Allocation concealment (selection bias) | High risk | No comparison group |
| Baseline imbalance (selection bias) | High risk | No comparison group |
| Contamination protection | High risk | No comparison group |
| Blinding of participants and personnel (performance bias) All outcomes | High risk | No comparison group |
| Blinding of outcome assessment (detection bias) All outcomes | High risk | No comparison group |
| Incomplete outcome data (attrition bias) All outcomes | Low risk | Single treatment episode after conducting a census, door‐to‐door education and promotion of community participation. |
| Selective reporting (reporting bias) | Low risk | National passive surveillance |
| Other bias | Low risk | No other bias detected |
Gaud 1953 MAR.
| Methods | Dates of study: 1952 Location of study: Morocco Malaria endemicity (prevalence): 41.5% in all ages (baseline) [High] Transmission season: June to October Malaria species: P. falciparum, P. vivax Vector species: Not specified Study design: Uncontrolled before‐and‐after study Evaluation design: Cross‐sectional surveys |
|
| Participants | Age groups included: All ages Sample size: Intervention group 1 (mean): 3000 |
|
| Interventions | Intervention group 1: MDA administered to all persons with amodiaquine 600 mg given once in the summer of 1952. Coverage not specified. No co‐interventions. | |
| Outcomes | Parasitaemia prevalence No adverse event surveillance conducted No adverse events reported |
|
| Notes | ||
| Risk of bias | ||
| Bias | Authors' judgement | Support for judgement |
| Random sequence generation (selection bias) | High risk | No comparison group |
| Allocation concealment (selection bias) | High risk | No comparison group |
| Baseline imbalance (selection bias) | High risk | No comparison group |
| Contamination protection | High risk | No comparison group |
| Blinding of participants and personnel (performance bias) All outcomes | High risk | No comparison group |
| Blinding of outcome assessment (detection bias) All outcomes | High risk | No comparison group |
| Incomplete outcome data (attrition bias) All outcomes | Unclear risk | Insufficient information to permit judgement |
| Selective reporting (reporting bias) | Unclear risk | Insufficient information to permit judgement |
| Other bias | Low risk | No other bias detected |
Hii 1987 MYS.
| Methods | Dates of study: 1984‐1985 Location of study: Malaysia Malaria endemicity (prevalence): Intervention group 1 (December 1984 baseline survey): 46.3% in children 0‐8 years [High]; Intervention group 2 (December 1984 baseline survey): 55.6% in children 0‐8 years [High] Transmission season: Perennial Malaria species: P. falciparum, P. malariae, P. vivax Vector species: A. balabacensis Study design: Uncontrolled before‐and‐after study Evaluation design: Cross‐sectional surveys and active surveillance |
|
| Participants | Age groups included: All ages Sample size Intervention group 1 (mean): 754 Intervention group 2 (mean): 148 |
|
| Interventions | Intervention group 1: MDA administered to all persons (139 households in five villages) with sulfadoxine‐pyrimethamine (1500 mg/75 mg) and primaquine 30 mg once in December 1984 to January 1985. Coverage 87%. Co‐intervention with permethrin‐impregnated bed nets to all households. Intervention group 2: MDA administered to all persons (nine households in one village) with sulfadoxine‐pyrimethamine (1500 mg/75 mg) and primaquine 30 mg once in December 1984 to January 1985. Coverage 76%. No co‐interventions. |
|
| Outcomes | Parasitaemia prevalence Parasitaemia incidence Gametocytaemia prevalence No adverse event surveillance conducted No adverse events reported |
|
| Notes | Though the entire population was treated, thick and thin blood films were collected during eight surveys on a population of 286 children aged 0‐8 years. Only data for these children were reported and therefore used in the meta‐analysis. Furthermore, because the study design included a comparison group that received MDA, the intervention and comparison groups will be treated as two intervention groups and each intervention group will be analyzed in the meta‐analysis as a separate uncontrolled before‐and‐after study. Lastly, due to insufficient information to extract incidence data, parasitaemia incidence was not included as an outcome in the meta‐analysis. | |
| Risk of bias | ||
| Bias | Authors' judgement | Support for judgement |
| Random sequence generation (selection bias) | High risk | No comparison group |
| Allocation concealment (selection bias) | High risk | No comparison group |
| Baseline imbalance (selection bias) | High risk | No comparison group |
| Contamination protection | High risk | No comparison group |
| Blinding of participants and personnel (performance bias) All outcomes | High risk | No comparison group |
| Blinding of outcome assessment (detection bias) All outcomes | High risk | No comparison group |
| Incomplete outcome data (attrition bias) All outcomes | High risk | Though the entire population was treated, thick and thin blood films were collected during eight surveys on a population of 286 children aged 0‐8 years. Only 29.7% of children were present at every one of the eight sessions. |
| Selective reporting (reporting bias) | High risk | The study report fails to include results on P. vivax infections that would be expected to have been reported for such a study. The study methods indicate that thick blood films will be classified as "positive or negative for asexual and/or sexual parasites of either P. falciparum, P. vivax, P. malariae, or mixed infections". Only parasitological findings for P. falciparum are described and presented in detail. |
| Other bias | Low risk | With the exception of two study villages, which are both intervention group 1 sites, the study villages are "well separated and demarcated". Therefore, it is unlikely that contamination between sites occurred. All villages also received the same treatment dose and schedule. However, it should be noted that in the meta‐analysis, the two interventions were analyzed as two separate uncontrolled before‐and‐after studies. |
Houel 1954 MAR.
| Methods | Dates of study: 1953 Location of study: Morocco Malaria endemicity (prevalence): 14.3%, children only (August 1953 baseline survey) [Moderate] Transmission season: July to November Malaria species: P. falciparum, P. malariae, P. vivax Vector species: Not specified Study design: Uncontrolled before‐and‐after study Evaluation design: Cross‐sectional surveys |
|
| Participants | Age groups included: All ages Sample size Intervention group 1 (mean): 9999 |
|
| Interventions | Intervention group 1: MDA administered to all persons with pyrimethamine 100 mg once in June 1953 to September 1953. Coverage not specified. Co‐intervention with IRS prior to MDA. | |
| Outcomes | Parasitaemia prevalence Gametocytaemia prevalence No adverse event surveillance conducted No adverse events reported |
|
| Notes | Only results from the 147 children examined were included in the meta‐analysis. | |
| Risk of bias | ||
| Bias | Authors' judgement | Support for judgement |
| Random sequence generation (selection bias) | High risk | No comparison group |
| Allocation concealment (selection bias) | High risk | No comparison group |
| Baseline imbalance (selection bias) | High risk | No comparison group |
| Contamination protection | High risk | No comparison group |
| Blinding of participants and personnel (performance bias) All outcomes | High risk | No comparison group |
| Blinding of outcome assessment (detection bias) All outcomes | High risk | No comparison group |
| Incomplete outcome data (attrition bias) All outcomes | High risk | While adults were included in MDA, only a subset of children were included in the evaluation. |
| Selective reporting (reporting bias) | Unclear risk | Insufficient information to permit judgement |
| Other bias | High risk | No data on coverage of intervention |
Jones 1954 KEN.
| Methods | Dates of study: 1952‐1953 Location of study: Kenya Malaria endemicity (prevalence): 34.8% (baseline survey in a random sample of adults and infants); 32.6% (baseline survey in school children) [Moderate] Transmission season: January to March, May to August Malaria species: P. falciparum, P. malariae Vector species: A. gambiae, A. funestus Study design: Uncontrolled before‐and‐after study Evaluation design: Cross‐sectional surveys |
|
| Participants | Age groups included: All ages Sample size Intervention group 1 (mean): 3721 (including 297 school children) |
|
| Interventions | Intervention group 1: MDA administered to all persons in Makueni with pyrimethamine 100 mg once for three rounds in September 1952, March 1953 and September 1953. Coverage not specified. No co‐interventions. | |
| Outcomes | Parasitaemia prevalence No adverse event surveillance conducted No adverse events reported |
|
| Notes | Following the first MDA round, blood smears were taken from random samples of the adult and infant (< 5 years) population and from all school children for a year. Due to the high degree of resistance that developed following two MDA rounds, parasitaemia prevalence results in the meta‐analysis reflect only first round MDA results for infants and adults. | |
| Risk of bias | ||
| Bias | Authors' judgement | Support for judgement |
| Random sequence generation (selection bias) | High risk | No comparison group |
| Allocation concealment (selection bias) | High risk | No comparison group |
| Baseline imbalance (selection bias) | High risk | No comparison group |
| Contamination protection | High risk | No comparison group |
| Blinding of participants and personnel (performance bias) All outcomes | High risk | No comparison group |
| Blinding of outcome assessment (detection bias) All outcomes | High risk | No comparison group |
| Incomplete outcome data (attrition bias) All outcomes | Low risk | Individual data kept of all school children and of all subjects with malaria attending the dispensary |
| Selective reporting (reporting bias) | Low risk | Blood smears collected from random samples of adults and infants and of all school children monthly for a year following the first MDA round. All pre‐specified outcomes have been reported. |
| Other bias | High risk | Complicated by resistance |
Jones 1958 KEN.
| Methods | Dates of study: 1952‐1953 Location of study: Kenya Malaria endemicity (prevalence): Intervention group 1 (September 1952): 60% in school‐age children; Comparison group 1 (September 1953): 34% in school‐age children [Moderate] Transmission season: January to March, May to August Malaria species: P. falciparum, P. malariae, P. vivax Vector species: A. gambiae, A. funestus Study design: Non‐randomized controlled study Evaluation design: Cross‐sectional surveys |
|
| Participants | Age groups included: All ages; school‐age children Sample size Intervention group 1 (range): 3721‐4500 Comparison group 1: Not specified |
|
| Interventions | Intervention group 1: MDA administered to all school children in Makueni with pyrimethamine 100 mg for three rounds in September 1952, March 1953 and September 1953. Coverage not specified. No co‐interventions. Comparison group 1: School children in Okia used as a comparison arm. No co‐interventions. |
|
| Outcomes | Parasitaemia prevalence Gametocytaemia prevalence No adverse event surveillance conducted No adverse events reported |
|
| Notes | Outcome data for the intervention group is a subset of the Jones 1954 KEN study. The meta‐analysis only included first‐round results. Gametocytaemia prevalence data is forP. falciparum only. | |
| Risk of bias | ||
| Bias | Authors' judgement | Support for judgement |
| Random sequence generation (selection bias) | High risk | Non‐randomized controlled study |
| Allocation concealment (selection bias) | High risk | Non‐randomized controlled study |
| Baseline imbalance (selection bias) | High risk | Baseline parasitaemia estimates are not balanced between the intervention group and the comparison group. |
| Contamination protection | Unclear risk | Although the comparison group site was 13 miles from the intervention group site, there is no indication whether the control group was adequately protected against contamination. It is quite possible that the control group received the intervention. |
| Blinding of participants and personnel (performance bias) All outcomes | Unclear risk | Participants and personnel aware of treatment, but unclear if this impacted outcomes |
| Blinding of outcome assessment (detection bias) All outcomes | Unclear risk | Not blinded, but unclear if this impacted outcomes |
| Incomplete outcome data (attrition bias) All outcomes | Low risk | Individual data kept of all school‐age children and of all subjects with malaria attending the dispensary. No antimalarials were sold in local shops. At the end of the 12th month of evaluation, 221 children remained out of the original 297 children. |
| Selective reporting (reporting bias) | Low risk | Blood smears from random samples and all school‐age children. Over the course of the study, the school population rose by 178 children. To avoid confusion, the investigators excluded these additional children from the figures used to compile prevalence and only reported data from the original 297 children. |
| Other bias | High risk | Complicated by drug resistance |
Kaneko 2000 VUT.
| Methods | Dates of study: 1991‐1999 Location of study: Vanuatu Malaria endemicity (prevalence): Intervention group 1 (January ‐ September 1991): 15.7% in all ages; Comparison group 1 (May 1990): 28.8% in all ages [Moderate]. Transmission season: December to April Malaria species:P. falciparum, P. vivax Vector species: A. farauti Study design: Non‐randomized controlled study Evaluation design: Cross‐sectional surveys |
|
| Participants | Age groups included: All ages Sample size Intervention group 1 (mean): 718 Comparison group 1 (mean): 19,289 |
|
| Interventions | Intervention group 1: MDA administered to all persons in Aneityum weekly for nine weeks with chloroquine 600 mg and sulfadoxine‐pyrimethamine 1500 mg/75 mg and primaquine 45 mg once a week in weeks 1, 5, and 9; chloroquine 300 mg and primaquine 45 mg once a week in weeks 2, 3, 4, 6, 7, and 8 in September 1991 to November 1991. Coverage 79 to 92%. Co‐intervention with larvivorous fish in several identified breeding sites and universal coverage with insecticide treated bed nets (about 0.94 nets per villager). Comparison group 1: Persons living in Malakula Island. Co‐intervention with bed nets (approximately 20% coverage). |
|
| Outcomes | Parasitaemia prevalence No adverse event surveillance conducted Adverse events reported: Some villagers reported vomiting after taking the tablets. |
|
| Notes | Another village on Futana island was included in the study for comparison; however, because no parasitaemia was detected in the two surveys on Futuna, it was excluded from the meta‐analysis. The meta‐analysis only included data from Aneityum for the months of January and September 1991 (before MDA) and March 1998 (post‐MDA). | |
| Risk of bias | ||
| Bias | Authors' judgement | Support for judgement |
| Random sequence generation (selection bias) | High risk | Non‐randomized controlled study |
| Allocation concealment (selection bias) | High risk | Non‐randomized controlled study |
| Baseline imbalance (selection bias) | Low risk | According to investigators, "the parasite rates were initially similar on Aneityum and Malakula islands and in general, decreased with age". |
| Contamination protection | Low risk | The comparison group was a village from Malakula, an adjacent island; therefore, it is unlikely that the comparison group received the intervention. |
| Blinding of participants and personnel (performance bias) All outcomes | Unclear risk | Not blinded, but unclear if this impacted outcomes |
| Blinding of outcome assessment (detection bias) All outcomes | Unclear risk | Not blinded, but unclear if this impacted outcomes |
| Incomplete outcome data (attrition bias) All outcomes | Low risk | Only 7.9% of doses unable to be administered and only 3.8% doses were not properly reported and could not be confirmed. The overall calculated compliance rate of the remaining doses was 88.3%. |
| Selective reporting (reporting bias) | High risk | Of the 13 surveys, two covered only school children whereas the other 11 surveys covered the entire population of Aneityum. |
| Other bias | Low risk | No other bias detected |
Kligler 1931 PSE.
| Methods | Dates of study: 1930 Location of study: Palestine (known as British Mandate Palestine at the time of the study's publication) Malaria endemicity (prevalence): 35% in all ages; 67% in children 2‐10 years [High] Transmission season: October to December Malaria species:P. falciparum, P. malariae, P. vivax Vector species: A. elutus Study design: Uncontrolled before‐and‐after study Evaluation design: Cross‐sectional surveys and active surveillance |
|
| Participants | Age groups included: All ages Sample size Intervention group 1 mean (range): 953 (899‐993) |
|
| Interventions | Intervention group 1: MDA administered to all persons in five selected villages with plasmochine 30 mg plus quinine 900 mg twice daily for five days every three weeks for three rounds between September and November 1930. Coverage 78.8%. No co‐interventions. | |
| Outcomes | Parasitaemia prevalence Gametocytaemia prevalence Adverse event surveillance conducted (active during the course of the treatment) Adverse events reported: No ill results were noted during the entire course of treatment. |
|
| Notes | Noted that repeated treatments tended to increase resistance. | |
| Risk of bias | ||
| Bias | Authors' judgement | Support for judgement |
| Random sequence generation (selection bias) | High risk | No comparison group |
| Allocation concealment (selection bias) | High risk | No comparison group |
| Baseline imbalance (selection bias) | High risk | No comparison group |
| Contamination protection | High risk | No comparison group |
| Blinding of participants and personnel (performance bias) All outcomes | High risk | No comparison group |
| Blinding of outcome assessment (detection bias) All outcomes | High risk | No comparison group |
| Incomplete outcome data (attrition bias) All outcomes | High risk | There was a large drop in the number of villages surveyed from baseline to post‐survey without any explanation. |
| Selective reporting (reporting bias) | High risk | Five villages were treated but only select villages reported outcome data. |
| Other bias | Low risk | No other bias detected |
Kondrashin 1985 IND.
| Methods | Dates of study: 1981 Location of study: India Malaria endemicity (incidence): 4/1000 baseline monthly incidence Transmission season; April to August Malaria species: P. falciparum, P. vivax Vector species: Not specified Study design: Uncontrolled before‐and‐after study Evaluation design: Passive surveillance |
|
| Participants | Age groups included: All ages Sample size Intervention group 1 (mean): 51,325 |
|
| Interventions | Intervention group 1: MDA administered to all persons with chloroquine 600 mg (plus primaquine 45 mg in falciparum areas only) for one round in March to May 1981 in four primary health centres and two rounds in February to March 1981 and June to September 1981 in four other primary health centres. Coverage 85%. Co‐intervention with IRS. | |
| Outcomes | Parasitaemia incidence No adverse event surveillance conducted No adverse events reported |
|
| Notes | ||
| Risk of bias | ||
| Bias | Authors' judgement | Support for judgement |
| Random sequence generation (selection bias) | High risk | No comparison group |
| Allocation concealment (selection bias) | High risk | No comparison group |
| Baseline imbalance (selection bias) | High risk | No comparison group |
| Contamination protection | High risk | No comparison group |
| Blinding of participants and personnel (performance bias) All outcomes | High risk | No comparison group |
| Blinding of outcome assessment (detection bias) All outcomes | High risk | No comparison group |
| Incomplete outcome data (attrition bias) All outcomes | Low risk | Only 1 or 2 rounds of treatment with 85% coverage |
| Selective reporting (reporting bias) | Unclear risk | No mention of the thoroughness of passive surveillance |
| Other bias | High risk | A likely increase inP. falciparum due to labour movement into treated area |
Malaria_Taiwan 1991 TWN.
| Methods | Dates of study: 1955 Location of study: Taiwan Malaria endemicity (prevalence): 4.12% in all ages (May 1955 survey); 2.93% in all ages (November 1955) [Low] Transmission season: Not described Malaria species: P. falciparum, P. malariae, P. vivax Vector species: A. maculatus, A. minimus, A. sinensis Study design: Uncontrolled before‐and‐after study Evaluation design: Cross‐sectional surveys and passive surveillance |
|
| Participants | Age groups included: All ages, except infants Sample size Intervention group 1 mean (range): 1520 (1502‐1537) |
|
| Interventions | Intervention group 1: MDA administered to all persons, except infants, in Lanyu with a single dose of chloroquine (12 mg/kg) in November 1955. Coverage not specified. Co‐intervention with IRS using DDT. | |
| Outcomes | Parasitaemia prevalence No adverse event surveillance conducted No adverse events reported |
|
| Notes | Post‐MDA (> 12 months) estimated using survey data from April‐May 1957 and April 1960 | |
| Risk of bias | ||
| Bias | Authors' judgement | Support for judgement |
| Random sequence generation (selection bias) | High risk | No comparison group |
| Allocation concealment (selection bias) | High risk | No comparison group |
| Baseline imbalance (selection bias) | High risk | No comparison group |
| Contamination protection | High risk | No comparison group |
| Blinding of participants and personnel (performance bias) All outcomes | High risk | No comparison group |
| Blinding of outcome assessment (detection bias) All outcomes | High risk | No comparison group |
| Incomplete outcome data (attrition bias) All outcomes | Unclear risk | Insufficient reporting of attrition/exclusions to permit judgement |
| Selective reporting (reporting bias) | Low risk | The first three malariometric baseline surveys reported consisted of only a portion of the entire population on the island. Subsequent surveys examined all inhabitants. While these disproportionate samples could result in a certain bias when compared to the remaining surveys that comprised the entire population, the investigators weighted the first three surveys according to the natural distribution of the population. |
| Other bias | Low risk | No other bias detected |
Metselaar 1961 PNG.
| Methods | Dates of study: 1958‐1959 Location of study: Papua New Guinea Malaria endemicity (prevalence): 46‐80% in children 2‐11 years; 46% in all ages before spraying [High]; During spraying 13‐21% in children 2‐11 years; 12% in all ages [Moderate] Transmission season: Not described Malaria species: P. falciparum, P. malariae, P. vivax Vector species: A. punctulatus, A. farauti, A. koliensis Study design: Uncontrolled before‐and‐after study Evaluation design: Cross‐sectional surveys |
|
| Participants | Age groups included: All ages Sample size Intervention group 1 (mean): 2500 |
|
| Interventions | Intervention group 1 (Sentani): MDA administered to all persons in sprayed areas with chloroquine 450 mg plus pyrimethamine 50 mg at weekly intervals for five rounds in 1958 and for one round in 1959. Two villages with high absolute parasite rates received an additional round of treatment in 1959. In addition, during all rounds, positives received chloroquine for an additional three successive days, completing a full course (1350 mg base for adults). Coverage 90%. Co‐intervention with IRS. | |
| Outcomes | Parasite prevalence No adverse event surveillance conducted No adverse events reported |
|
| Notes | Baseline data from 1958 survey | |
| Risk of bias | ||
| Bias | Authors' judgement | Support for judgement |
| Random sequence generation (selection bias) | High risk | No comparison group |
| Allocation concealment (selection bias) | High risk | No comparison group |
| Baseline imbalance (selection bias) | High risk | No comparison group |
| Contamination protection | High risk | No comparison group |
| Blinding of participants and personnel (performance bias) All outcomes | High risk | No comparison group |
| Blinding of outcome assessment (detection bias) All outcomes | High risk | No comparison group |
| Incomplete outcome data (attrition bias) All outcomes | Low risk | 90% coverage, but no further description |
| Selective reporting (reporting bias) | Unclear risk | Selection for inclusion in surveys not described |
| Other bias | Low risk | No other bias detected |
Molineaux 1980 NGA.
| Methods | Dates of study: 1970‐1975 Location of study: Nigeria Malaria endemicity (prevalence): 46% in all ages [High] Transmission season: April to October Malaria species: P. falciparum, P. malariae, P. ovale Vector species: A. gambiae, A. funestus Study design: Non‐randomized controlled study Evaluation design: Cross‐sectional surveys and active surveillance |
|
| Participants | Age groups included: All ages, but infants not included in MDA until their first malaria episode. Sample size Intervention group 1 (mean): 14,129 Intervention group 2 (mean): 1810 Comparison group 1 (mean): 32,828 Comparison group 2 (mean): ND |
|
| Interventions | Intervention group 1 (Low frequency MDA+IRS group): MDA administered to all ages, except for infants who have not had their first malaria episode, with sulfalene‐pyrimethamine 500 mg/25 mg every 10 weeks from April 1972 to October 1973. Coverage 85%. Co‐intervention with IRS using propoxur 3‐4 rounds per year. Intervention group 2 (High frequency MDA+IRS group): MDA administered to all ages, except for infants who have not had their first malaria episode, with sulfalene‐pyrimethamine 500 mg/25 mg every two weeks during the wet season and every 10 weeks during the dry season from April 1972 to October 1973. Coverage 85%. Co‐intervention with IRS using propoxur 3‐4 rounds per year. Comparison group 1: IRS using propoxur 3‐4 rounds per year. Comparison group 2: No interventions. |
|
| Outcomes | Parasitaemia prevalence Gametocytaemia prevalence Mortality No adverse event surveillance conducted No adverse events reported |
|
| Notes | ||
| Risk of bias | ||
| Bias | Authors' judgement | Support for judgement |
| Random sequence generation (selection bias) | High risk | Non‐randomized controlled study |
| Allocation concealment (selection bias) | High risk | Non‐randomized controlled study |
| Baseline imbalance (selection bias) | Low risk | Similiar malaria characteristics between groups |
| Contamination protection | Low risk | It was desirable to allocate contiguous areas to the same treatment and also to reduce the effect of migrations by having similarly treated buffer zones around the evaluation villages. |
| Blinding of participants and personnel (performance bias) All outcomes | Unclear risk | Not mentioned but unclear if this impacted outcomes |
| Blinding of outcome assessment (detection bias) All outcomes | Low risk | Independent reexamination of slides |
| Incomplete outcome data (attrition bias) All outcomes | Low risk | Operation aimed for total coverage |
| Selective reporting (reporting bias) | Low risk | The surveys covered the total de facto population of selected village clusters and all possible outcomes measured and reported. |
| Other bias | Low risk | No other bias detected |
Najera 1973 NGA.
| Methods | Dates of study: 1966‐1968 Location of study: Nigeria Malaria endemicity (prevalence): Comparison group 1: 28.9% in all ages [Moderate] Transmission season: May to September Malaria species: P. falciparum Vector species: A. gambiae, A. funestus Study design: Non‐randomized controlled study (no post‐intervention measurements) Evaluation design: Cross‐sectional surveys |
|
| Participants | Age groups included: Ages > 3 months Sample size Intervention 1 mean (range): 52,000 (52,060 to 53,897) Comparison 1 mean: 11,500 |
|
| Interventions | Intervention group 1: MDA administered to all persons aged > 3 months with chloroquine 450 mg and pyrimethamine 45 mg every 60 days for 11 rounds from November 1966 to August 1968. Coverage 78 to 92%. Co‐intervention with IRS. Comparison group 1: Co‐intervention with IRS only. Coverage not described. |
|
| Outcomes | Parasitaemia prevalence Gametocytaemia prevalence Active adverse event surveillance conducted Adverse events reported: Direct observation of 5003 treatments during MDA rounds 9 and 10 revealed 2% vomiting immediately after taking the drug. When a subset of the population was asked about vomiting, 9% reported this symptom. |
|
| Notes | Data collected during rounds 2 to 11 are summarized as during MDA results. This is problematic as the initial decline and later rise of cases during the two years of drug administration is aggregated. Evaluation conducted in a subset of treated population. | |
| Risk of bias | ||
| Bias | Authors' judgement | Support for judgement |
| Random sequence generation (selection bias) | High risk | Non‐randomized controlled study |
| Allocation concealment (selection bias) | High risk | Non‐randomized controlled study |
| Baseline imbalance (selection bias) | High risk | The comparison area was not comparable to the intervention area in terms of entomologic or parasitological parameters. |
| Contamination protection | Low risk | Treated large peripheral zone, but evaluation done in central zone only |
| Blinding of participants and personnel (performance bias) All outcomes | Unclear risk | Not blinded, but unclear if this impacted outcomes |
| Blinding of outcome assessment (detection bias) All outcomes | Unclear risk | Not mentioned, but unclear if this impacted outcomes |
| Incomplete outcome data (attrition bias) All outcomes | Low risk | Recorded census and population movement without large loss to follow‐up |
| Selective reporting (reporting bias) | Low risk | Random sampling of clusters of 200 people for the parasitological surveys |
| Other bias | Low risk | No other bias detected |
Paik 1974a SLB.
| Methods | Dates of study: 1972 Location of study: Solomon Islands (known as British Solomon Islands at the time of the study's publication) Malaria endemicity (prevalence): 27.8% all ages (May 1972 survey) [Moderate] Transmission season: Rainy season December to April Malaria species: P. falciparum, P. vivax Vector species:A. farauti Study design: Uncontrolled before‐and‐after study Evaluation design: Cross‐sectional surveys, passive surveillance and active surveillance |
|
| Participants | Age groups included: All ages Sample size Intervention group 1 (mean): Not specified |
|
| Interventions | Intervention group 1 (Nggela archipelago): MDA administered to all persons with chloroquine 600 mg and pyrimethamine 50 mg monthly for four months from July to October 1972. Coverage 90%. Co‐intervention with IRS. | |
| Outcomes | Parasitaemia prevalence (includes both passive and active case detection for the period during and after the intervention) Parasitaemia incidence (population size not given) No adverse event surveillance conducted No adverse events reported |
|
| Notes | ||
| Risk of bias | ||
| Bias | Authors' judgement | Support for judgement |
| Random sequence generation (selection bias) | High risk | No comparison group |
| Allocation concealment (selection bias) | High risk | No comparison group |
| Baseline imbalance (selection bias) | High risk | No comparison group |
| Contamination protection | High risk | No comparison group |
| Blinding of participants and personnel (performance bias) All outcomes | High risk | No comparison group |
| Blinding of outcome assessment (detection bias) All outcomes | High risk | No comparison group |
| Incomplete outcome data (attrition bias) All outcomes | Unclear risk | Insufficient reporting of attrition/exclusions to permit judgement |
| Selective reporting (reporting bias) | High risk | Only 50% of children 2‐9 years old included in the pre‐MDA and post‐MDA household surveys |
| Other bias | High risk | Baseline surveillance did not include active case detection |
Paik 1974b SLB.
| Methods | Dates of study: 1972‐1973 Location of study: Solomon Islands (known as British Solomon Islands at the time of the study's publication) Malaria endemicity (incidence): 15/1000 baseline monthly incidence Transmission season: Rainy season December to April Malaria species: P. vivax, P. malariae Vector species: A. farauti Study design: Uncontrolled before‐and‐after study Evaluation design: Passive surveillance |
|
| Participants | Age groups included: All ages Sample size Intervention group 1 (mean): 1200 |
|
| Interventions | Intervention group 1 (Wagina and Shortland): MDA administered to all persons with chloroquine 1500 mg and primaquine 75 mg over five days every three months for three rounds from October 1972 to March 1973. Coverage 90%. No co‐interventions. | |
| Outcomes | Parasitaemia incidence No adverse event surveillance conducted No adverse events reported |
|
| Notes | ||
| Risk of bias | ||
| Bias | Authors' judgement | Support for judgement |
| Random sequence generation (selection bias) | High risk | No comparison group |
| Allocation concealment (selection bias) | High risk | No comparison group |
| Baseline imbalance (selection bias) | High risk | No comparison group |
| Contamination protection | High risk | No comparison group |
| Blinding of participants and personnel (performance bias) All outcomes | High risk | No comparison group |
| Blinding of outcome assessment (detection bias) All outcomes | High risk | No comparison group |
| Incomplete outcome data (attrition bias) All outcomes | Unclear risk | Insufficient information to permit judgement |
| Selective reporting (reporting bias) | Unclear risk | Insufficient information to permit judgement |
| Other bias | Low risk | No other bias detected |
Ricosse 1959 BFA.
| Methods | Dates of study: 1958‐1959 Location of study: Burkina Faso Malaria endemicity (prevalence): Intervention group 1 (March‐May 1958 baseline survey): 15.3% in children 0‐9 years [Moderate]; Intervention group 2 (March to May 1958 baseline survey): 56.0% in children 0‐9 years [High] Transmission season: June to October Malaria species: P. falciparum, P. malariae Vector species: A. gambiae, A. funestus Study design: Uncontrolled before‐and‐after study Evaluation design: Cross‐sectional surveys |
|
| Participants | Age groups included: All ages Sample size Intervention group 1 (mean): 5000 Intervention group 2 (mean): 3000 |
|
| Interventions | Intervention group 1 (Zone A): MDA administered to all persons with pyrimethamine 50 mg every two weeks for eight rounds in June to September 1958. Coverage 82‐91%. Co‐intervention with IRS using DDT. Intervention group 2 (Zone B): MDA administered to all persons with pyrimethamine 50 mg every two weeks for eight rounds in June to September 1958. Coverage 82‐91%. No co‐interventions. |
|
| Outcomes | Parasitaemia prevalence Gametocytaemia prevalence No adverse event surveillance conducted No adverse events reported |
|
| Notes | Outcomes assessed in sub‐sample of treated population (0‐9 years). Data presented in Table 1 was used in the meta‐analysis. | |
| Risk of bias | ||
| Bias | Authors' judgement | Support for judgement |
| Random sequence generation (selection bias) | High risk | No comparison group |
| Allocation concealment (selection bias) | High risk | No comparison group |
| Baseline imbalance (selection bias) | High risk | No comparison group |
| Contamination protection | High risk | No comparison group |
| Blinding of participants and personnel (performance bias) All outcomes | High risk | No comparison group |
| Blinding of outcome assessment (detection bias) All outcomes | High risk | No comparison group |
| Incomplete outcome data (attrition bias) All outcomes | High risk | In Zone B, pyrimethamine distribution stopped on September 20th and resumed in October, so the study was unable to follow the entire evolution of resistance that apparently began during the fourth month of distribution. Also, the method of selection of children 2‐9 years is unclear. They took monthly blood samples in all children 0‐23 months, but due to the large sample size selected only a proportion of children 2‐9 years to examine. |
| Selective reporting (reporting bias) | Unclear risk | Insufficient information to permit judgement |
| Other bias | High risk | Complicated by resistance in the fourth month of MDA |
Roberts 1964 KEN.
| Methods | Dates of study: 1953‐1954 Location of study: Kenya Malaria endemicity (prevalence): 28% in 1953 [Moderate] and 22% in 1954 [Moderate] in all ages in Tiriki Transmission season: May to July Malaria species:P. falciparum, P. malariae Vector species: A. gambiae, A. funestus Study design: Non‐randomized controlled study Evaluation design: Cross‐sectional surveys |
|
| Participants | Age groups included: All ages Sample size Intervention group 1 (mean): 101,000 Intervention group 2 (mean): 99,000 Comparison group 1 (mean): Not specified Comparison group 2 (mean): Not specified |
|
| Interventions | Intervention group 1 (Nandi District 1953): MDA administered to all persons with pyrimethamine 50 mg once in May 1953. Coverage 95%. No co‐intervention. Intervention group 2 (Nandi District 1954): MDA administered to all persons with pyrimethamine 50 mg once in May 1954. Coverage 95%. No co‐intervention. Comparison group 1 (Tiriki control area 1953): No interventions Comparison group 2 (Tiriki control area 1954): No interventions |
|
| Outcomes | Parasitaemia prevalence No adverse event surveillance conducted No adverse events reported |
|
| Notes | Intended to control epidemics. In the methods, it states: "one hundred thick blood films were taken in treated and untreated areas from persons in each of the age groups 0‐10 years, 11‐20 years, and 21 years and older". Therefore, we assumed that the number of total patients examined was 300 for both intervention and comparison groups to determine the number of cases identified in our calculations for parasitaemia prevalence. Outcomes were assessed in a sub‐sample of the treated population. |
|
| Risk of bias | ||
| Bias | Authors' judgement | Support for judgement |
| Random sequence generation (selection bias) | High risk | Non‐randomized controlled study |
| Allocation concealment (selection bias) | High risk | Non‐randomized controlled study |
| Baseline imbalance (selection bias) | High risk | Higher baseline parasitaemia in the control area |
| Contamination protection | Low risk | Not described but trial area was very large |
| Blinding of participants and personnel (performance bias) All outcomes | Unclear risk | Not blinded but unclear if this impacted outcomes |
| Blinding of outcome assessment (detection bias) All outcomes | Unclear risk | Not mentioned but unclear if this impacted outcomes |
| Incomplete outcome data (attrition bias) All outcomes | Low risk | All inhabitants living in the selected area received treatment |
| Selective reporting (reporting bias) | Unclear risk | Unclear who or how many were included in the malaria surveys |
| Other bias | Low risk | No other bias detected |
Schneider 1961 BFA.
| Methods | Dates of study: 1960‐1961 Location of study: Burkina Faso Malaria endemicity (prevalence): Comparison group 1 (baseline survey): 59.4% in children 2‐9 years [High] Transmission season: August to September Malaria species: P. falciparum, P. vivax Vector species: Not described Study design: Non‐randomized controlled study (no pre‐intervention measurements) Evaluation design: Cross‐sectional surveys |
|
| Participants | Age groups included: All ages Sample size Intervention group 1 (mean): 2500 Intervention group 2 (mean): 3535 Comparison group 1 (mean): Not specified |
|
| Interventions | Intervention group 1: MDA administered to all persons with a combination of 600 mg base chloroquine or amodiaquine and 15 mg base primaquine every 14 days in June to December 1960 for 15 rounds. No co‐intervention. Coverage 90%. Intervention group 2: MDA administered to all persons with 600 mg base amodiaquine and 15 mg base primaquine every 14 days in June to December 1960 for eight rounds. Coverage not specified. Co‐intervention with IRS using DDT once a year in May 1960. Comparison group 1: Control zone free of any intervention (house spraying or treatment). Coverage not specified. |
|
| Outcomes | Parasitaemia prevalence Gametocytaemia prevalence No adverse event surveillance conducted No adverse events reported |
|
| Notes | Data on children 0‐9 years were reported; however, data could only be abstracted for 2‐9 years to draw appropriate comparisons. In addition, data for during MDA for the intervention groups were estimated using only October 1960 survey data; during MDA data for the comparison group was only provided for October 1960. Intervention sample size is based on the 2500 inhabitants of the three villages surveyed; half were randomized to receive amodiaquine and primaquine while the other half received chloroquine and primaquine. A third intervention group was treated with a combination of 600 mg base chloroquine or amodiaquine and 15 mg base primaquine every 14 days in June to December 1960; however, due to lack of detailed data presented, this group was not included in the meta‐analysis. |
|
| Risk of bias | ||
| Bias | Authors' judgement | Support for judgement |
| Random sequence generation (selection bias) | High risk | Non‐randomized controlled study |
| Allocation concealment (selection bias) | High risk | Non‐randomized controlled study |
| Baseline imbalance (selection bias) | Low risk | Patient outcomes were measured prior to the intervention. According to investigators, no important differences were present across study groups. |
| Contamination protection | Unclear risk | Insufficient information to permit judgement |
| Blinding of participants and personnel (performance bias) All outcomes | Unclear risk | Insufficient information to permit judgement |
| Blinding of outcome assessment (detection bias) All outcomes | Unclear risk | Insufficient information to permit judgement |
| Incomplete outcome data (attrition bias) All outcomes | High risk | Adults were treated during MDA, but were not included in the evaluation. |
| Selective reporting (reporting bias) | High risk | A monthly distribution schedule was also administered in the study; however due to the poor quality data, minimal results were described. |
| Other bias | Unclear risk | Insufficient information to permit judgement |
Shekalaghe 2011 TZA.
| Methods | Dates of study: 2008 Location of study: Tanzania Malaria endemicity (prevalence): 0% in all ages [Low] Transmission season: March to May, October to November Malaria species: P. falciparum Vector species: Not described Study design: Cluster‐randomized trial Unit of randomization: Geographical clusters of households Adjusted analyses for clustering: Yes Adjustment method: Generalized estimating equations ICC: Not described Numbers of clusters: 16 Number of people: 3457 Average cluster size: 216 Evaluation design: Cross‐sectional surveys, passive surveillance and active surveillance in children |
|
| Participants | Age groups included: Ages > 1 year, but individuals who had received a full dose of ACT in the two weeks before the intervention were excluded. Sample size Intervention group 1 (mean): 1110 Comparison group 1 (mean): 2347 |
|
| Interventions | Intervention group 1: MDA administered to all persons in eight clusters in four villages in Lower Moshi with sulphadoxine‐pyrimethamine (25 mg + 1.25 mg/kg as a single dose on the first day) plus artesunate (4 mg/kg/day for three days) plus primaquine (0.75 mg/kg as a single dose on the third day). Pregnant women received sulphadoxine‐pyrimethamine (25 mg + 1.25 mg/kg 25 mg + 1.25 mg/kg as a single dose on the first day) plus amodiaquine (10 mg/kg once daily for three days). Anaemic individuals received sulphadoxine‐pyrimethamine (25 mg + 1.25 mg/kg 25 mg + 1.25 mg/kg as a single dose on the first day) plus artesunate (4 mg/kg/day for three days). Coverage 93%. Co‐intervention with background bed net use (25.1% to 36.1%) and a single treatment campaign for trachoma with azithromycin was undertaken by a non‐governmental organisation. Comparison group 1: Placebo administered to all persons in eight clusters once daily over three days. Coverage not described. Co‐intervention with background bed net use (25.1% to 36.1%) and a single treatment campaign for trachoma with azithromycin was undertaken by a non‐governmental organisation. |
|
| Outcomes | Parasitaemia prevalence Gametocytaemia prevalence Active adverse event surveillance with haemoglobin monitoring conducted in a subset of the population Adverse events reported: One individual was diagnosed with a severe skin reaction in the week following MDA. Upon review, it was determined that the event was drug related. A second individual presented with skin hyperpigmentation on the face, which was determined unrelated to drug treatment. Both individuals were treated with steroids and monitored until symptoms disappeared. In those given primaquine, moderate anaemia (Hb level of <8 g/dL) was observed in 40% (6/15 individuals) of the G6PD A‐, 11.1% (3/27 individuals) of the G6PD A, and 4.5% (18/399 individuals) of the G6PD B individuals; one case of severe anaemia (Hb level of <5 g/dL) was observed. |
|
| Notes | The prevalence outcomes were assessed in a sub‐sample of the treated population. | |
| Risk of bias | ||
| Bias | Authors' judgement | Support for judgement |
| Random sequence generation (selection bias) | Low risk | Randomized using computer generated randomization tables |
| Allocation concealment (selection bias) | Low risk | Not described, but low risk with the randomization of a small number of clusters presumably by the investigator |
| Baseline imbalance (selection bias) | Low risk | Baseline demographic and malaria characteristics were similar |
| Contamination protection | Low risk | Households that were located between clusters (ie within 1 km distance from the boundary of intervention and/or control clusters) were considered as buffer zones. Members of these households received the intervention in order to minimize contamination. |
| Blinding of participants and personnel (performance bias) All outcomes | Low risk | Placebo was used in the comparison arm |
| Blinding of outcome assessment (detection bias) All outcomes | Low risk | The measurement of outcomes for intervention and comparison arms were identical. |
| Incomplete outcome data (attrition bias) All outcomes | Low risk | High coverage of intervention and population movement monitored |
| Selective reporting (reporting bias) | Low risk | For each cross‐sectional survey, individuals were randomly selected from computer‐generated random tables. All planned outcome measures were reported. |
| Other bias | Low risk | No other bias detected |
Simeons 1938 IND.
| Methods | Dates of study: 1935 Location of study: India Malaria endemicity (incidence): 156 cases/1000 baseline monthly incidence in all age groups Transmission season: March to August Malaria species: P. vivax Vector species: A. culicifacies Study design: Uncontrolled before‐and‐after study Evaluation design: Passive surveillance |
|
| Participants | Age groups included: All ages Sample size Intervention group 1 (mean): 5650 |
|
| Interventions | Intervention group 1 (Mill Area): MDA administered to all persons with atebrin intramuscular 300 mg daily for 2 days and plasmochin simplex 60 mg daily for three days once in May to June 1935. Coverage 100%. Co‐intervention with oiling for larval control after MDA. | |
| Outcomes | Parasitaemia incidence Passive event surveillance conducted Adverse events reported: Haemoglobinuria occurred in 4 cases (2 severe and died; 2 mild); three of the cases were from the same household and all were taking treatment for syphilis. Fatal cases known to have syphilis and unlikely to be associated with atebrin; although potentially associated with plasmochin. Abcesses reported in 49 small children and weak adults. "Giddiness" reported with atebrin. |
|
| Notes | Baseline monthly incidence was estimated using survey data from May 1934 to April 1935 prior to MDA. Data used in the meta‐analysis was extrapolated from graphs presented in the text. | |
| Risk of bias | ||
| Bias | Authors' judgement | Support for judgement |
| Random sequence generation (selection bias) | High risk | No comparison group |
| Allocation concealment (selection bias) | High risk | No comparison group |
| Baseline imbalance (selection bias) | High risk | No comparison group |
| Contamination protection | High risk | No comparison group |
| Blinding of participants and personnel (performance bias) All outcomes | High risk | No comparison group |
| Blinding of outcome assessment (detection bias) All outcomes | High risk | No comparison group |
| Incomplete outcome data (attrition bias) All outcomes | Low risk | Every person in the Mill Area was treated; extensive propaganda was carried out to bring every fever case to the doctor. |
| Selective reporting (reporting bias) | Low risk | Passive surveillance data for the entire population was reported |
| Other bias | Low risk | No other bias detected |
Singh 1953 IND.
| Methods | Dates of study: 1952‐1953 Location of study: India Malaria endemicity (prevalence): 22% in all ages [Moderate] Transmission season: September to November Malaria species: P. falciparum Vector species: Not described Study design: Non‐randomized controlled study Evaluation design: Cross‐sectional surveys and active surveillance |
|
| Participants | Age groups included: All ages Sample size Intervention group 1 (mean): 125 Comparison group 1 (mean): 55 Comparison group 2 (mean): 121 |
|
| Interventions | Intervention group 1: MDA administered to all persons with amodiaquine 600 mg every two weeks for ten weeks starting in September 1952. Coverage not specified. No co‐interventions. Comparison group 1 (comparison groups 1 and 2 combined): Neighboring control area. No co‐interventions. |
|
| Outcomes | Parasitaemia prevalence No adverse event surveillance conducted No adverse events reported |
|
| Notes | ||
| Risk of bias | ||
| Bias | Authors' judgement | Support for judgement |
| Random sequence generation (selection bias) | High risk | Non‐randomized controlled study |
| Allocation concealment (selection bias) | High risk | Non‐randomized controlled study; selection of villages were made after initial survey. Communication facilities were taken into place to decide on the intervention. |
| Baseline imbalance (selection bias) | High risk | Baseline malaria characteristics were similar to comparison group 2 but not to comparison group 1. |
| Contamination protection | High risk | Incidence of malaria was so high that every week large numbers of labourers were being repatriated to their own villages. |
| Blinding of participants and personnel (performance bias) All outcomes | Unclear risk | Not blinded, but unclear if this impacted outcomes |
| Blinding of outcome assessment (detection bias) All outcomes | Unclear risk | Not blinded, but unclear if this impacted outcomes |
| Incomplete outcome data (attrition bias) All outcomes | High risk | No description of intervention coverage |
| Selective reporting (reporting bias) | Low risk | Entire population surveyed |
| Other bias | Low risk | No other bias detected |
Song 2010 KHM.
| Methods | Dates of study: 2003‐2006 Location of study: Cambodia Malaria endemicity (prevalence): 55.8% in children < 16 years; 52.3% in all ages [High] Transmission season: Not described Malaria species: P. falciparum, P. malariae, P. vivax Vector species: Not described Study design: Uncontrolled before‐and‐after study Evaluation design: Cross‐sectional surveys |
|
| Participants | Age groups included: All ages Sample size Intervention group 1 (mean): 3653 Intervention group 2 (mean): 2387 |
|
| Interventions | Intervention group 1 (Kampong Speu, 17 villages, single round): MDA administered to all ages with artesunate 125 mg daily for two days, piperaquine 750 mg daily for two days and primaquine 9 mg every 10 days for six months starting in December 2003. Coverage not specified. No co‐interventions. Intervention group 2 (Kampot, nine villages, two rounds on days 0 and 42): MDA administered to all ages with artesunate 125 mg daily for two days and piperaquine 750 mg daily for two days given on days 0 and 42 and primaquine 9 mg every 10 days for six months starting in December 2003 . Coverage not specified. No co‐interventions. |
|
| Outcomes | Parasitaemia prevalence Gametocytaemia prevalence Passive event surveillance conducted Adverse events reported: No adverse reactions reported to village malaria volunteers. |
|
| Notes | Kampot data was not included in meta‐analysis as the denominator of children for the outcome data was not provided. The outcomes were assessed in a sub‐sample of the treated population. |
|
| Risk of bias | ||
| Bias | Authors' judgement | Support for judgement |
| Random sequence generation (selection bias) | High risk | No comparison group |
| Allocation concealment (selection bias) | High risk | No comparison group |
| Baseline imbalance (selection bias) | High risk | No comparison group |
| Contamination protection | High risk | No comparison group |
| Blinding of participants and personnel (performance bias) All outcomes | High risk | No comparison group |
| Blinding of outcome assessment (detection bias) All outcomes | High risk | No comparison group |
| Incomplete outcome data (attrition bias) All outcomes | High risk | One village missing data from one year |
| Selective reporting (reporting bias) | High risk | Monitoring was different for the different villages. Some villages had missing data. |
| Other bias | Low risk | No other bias detected |
van Dijk 1961 PNG.
| Methods | Dates of study: 1960 Location of study: Papua New Guinea Malaria endemicity (prevalence): 38.6% in children 2‐9 years (1959 survey); 18% in all ages (1959 and 1960 surveys) [Moderate] Transmission season: Not described Malaria species:P. falciparum, P. malariae, P. vivax Vector species: A. farauti Study design: Uncontrolled before‐and‐after study Evaluation design: Cross‐sectional surveys |
|
| Participants | Age groups included: All ages Sample size Intervention group 1 (mean): 1250 |
|
| Interventions | Intervention group 1: MDA administered to all persons with chloroquine (450 mg) once every four weeks for 11 rounds. Coverage 97.2% (range 93.1% to 100%). Co‐intervention with mass treatment of filariasis with diethylcarbamazine. | |
| Outcomes | Parasitaemia prevalence Gametocytaemia prevalence No adverse event surveillance conducted No adverse events reported |
|
| Notes | Before MDA estimates include data from June 1959 and January 1960 surveys (Tables I and II). For intervention group 1, outcome estimates come from Table V. | |
| Risk of bias | ||
| Bias | Authors' judgement | Support for judgement |
| Random sequence generation (selection bias) | High risk | No comparison group |
| Allocation concealment (selection bias) | High risk | No comparison group |
| Baseline imbalance (selection bias) | High risk | No comparison group |
| Contamination protection | High risk | No comparison group |
| Blinding of participants and personnel (performance bias) All outcomes | High risk | No comparison group |
| Blinding of outcome assessment (detection bias) All outcomes | High risk | No comparison group |
| Incomplete outcome data (attrition bias) All outcomes | High risk | Nine positives were not included in the 0‐1 month post‐MDA survey; they were not present during the last distribution. |
| Selective reporting (reporting bias) | Low risk | All pre‐specified outcomes of interest have been reported |
| Other bias | Unclear risk | Visitors to the village were also treated with the group to which they were most closely related. Persons who stayed only a few days were not treated. However, it is unclear whether this introduced bias. |
von Seidlein 2003 GMB.
| Methods | Dates of study: 1999 Location of study: Gambia Malaria endemicity: 42.9% in children ≤ 5 years [High]; describes 17‐19% in all ages but this data was not from this study. Transmission season: June to December Malaria species: P. falciparum Vector species: Not described Study design: Cluster‐randomized trial Unit of randomization: Villages Adjusted analyses for clustering: Yes Adjustment method: Poisson regression model adjusting for population size ICC: Not described Number of clusters: 18 villages Number of people: 3655 Average cluster size: 203 Feature: Matched villages Evaluation design: Cross‐sectional surveys, active surveillance and passive surveillance |
|
| Participants | Age groups included: Ages > 6 months old; non‐pregnant A total of 16,442 people, of which 14,017 people (85%) where treated (placebo or MDA) including the buffer zone Sample size (of number evaluated) Intervention group 1 (mean): 1969 Comparison group 1 (mean): 1686 |
|
| Interventions | Intervention group 1: MDA administered to all non‐pregnant persons aged > 6 months with sulfadoxine‐pyrimethamine 1500 mg/75 mg and artesunate 200 mg once in June 1999. Coverage 89% in total population (90.8% in evaluated group). No co‐interventions. Comparison group 1: Placebo administered to all non‐pregnant persons aged > 6 months once in June 1999. Coverage 89% in total population (89.6% in evaluated group). No co‐interventions. |
|
| Outcomes | Parasitaemia prevalence Parasitaemia incidence Gametocytaemia prevalence Anaemia prevalence (defined as hematocrit < 33%) Mortality Passive and active adverse event surveillance conducted Adverse events reported (passive surveillance system): 1 episode of pruritus Adverse events reported (active surveillance system): 25 of 75 individuals remembered one or more complaints within 2 days of taking the drug including dizziness (13), fever (6), diarrhoea (5), vomiting (5) and itching (4). |
|
| Notes | Incidence, gametocyte prevalence, anaemia prevalence and mortality reported for children only | |
| Risk of bias | ||
| Bias | Authors' judgement | Support for judgement |
| Random sequence generation (selection bias) | Low risk | While the study is a cluster‐randomized, double blind, placebo‐controlled trial, the method of randomization is not described. Author correspondence revealed that randomization was computer generated. |
| Allocation concealment (selection bias) | Low risk | Drugs allocated to each of the 18 study villages were delivered to the study site in identical containers. One nurse was aware of the identity of the drugs, administered the drugs in the study villages and then left the study area. |
| Baseline imbalance (selection bias) | Low risk | Intervention and control villages did not differ appreciably in the demographic of malaria transmission characteristics. |
| Contamination protection | Low risk | All inhabitants of the non‐randomized controlled villages in the study area were treated, to minimize possible dilution of the effect of the intervention. |
| Blinding of participants and personnel (performance bias) All outcomes | Low risk | Cluster‐randomized, double blind, placebo‐controlled trial; neither study personnel nor the study population were aware of which villages received placebo. |
| Blinding of outcome assessment (detection bias) All outcomes | Low risk | Cluster‐randomized, double blind, placebo‐controlled trial |
| Incomplete outcome data (attrition bias) All outcomes | Low risk | All children in the surveillance villages were visited weekly; all 18 study villages that were randomized were analyzed. |
| Selective reporting (reporting bias) | Low risk | All primary and secondary endpoints reported |
| Other bias | Low risk | No other bias detected |
Characteristics of excluded studies [ordered by study ID]
| Study | Reason for exclusion |
|---|---|
| Abraham 1944 | Inadequate treatment dose |
| Afridi 1959 | Inadequate treatment dose |
| Ahorlu 2009 | Treatment not administered to entire population; intermittent preventive treatment for children (IPTc) study |
| Ahorlu 2011 | Treatment not administered to entire population; intermittent preventive treatment for children (IPTc) study |
| Aikins 1993 | Inadequate treatment dose; knowledge, attitudes, and prevention component of an individually randomized study |
| Alicata 1955 | Inadequate treatment dose; individually randomized study |
| Aliev 2000 | Inadequate treatment dose |
| Aliev 2001 | Inadequate treatment dose |
| Allen 1990 | Inadequate treatment dose |
| Alonso 1993a | Inadequate treatment dose; individually randomized study |
| Alonso 1993b | Inadequate treatment dose; individually randomized study |
| Alving 1952 | Individually randomized study; study participants did not remain in endemic area |
| Amangel'diev 2001 | Inadequate treatment dose; testing conducted prior to treatment; insufficient information on drug administration |
| Annual Report 1932 | Inadequate treatment dose |
| Archambeault 1954 | Study participants did not remain in endemic area |
| Archibald 1956 | Individually randomized study |
| Babione 1966 | Insufficient information on drug administration |
| Banerjea 1949 | Inadequate treatment dose |
| Barber 1932 | Inadequate treatment dose |
| Barger 2009 | Individually randomized study |
| Baukapur 1984 | Insufficient information on drug administration |
| Berberian 1948 | Testing conducted prior to treatment |
| Berny 1936 | Inadequate treatment dose |
| Bloch 1982 | Insufficient information on drug administration |
| Bojang 2009 | Insufficient information on outcomes reported |
| Bojang 2010 | Individually randomized study |
| Bojang 2011 | Insufficient information on outcomes reported |
| Boulanger 2009 | Individually randomized study |
| Boulanger 2010 | Individually randomized study |
| Brink 1958 | Inadequate treatment dose |
| Butler 1943 | Insufficient information on drug administration |
| Canet 1936 | Inadequate treatment dose |
| Canet 1939 | Insufficient information on outcomes reported |
| Canet 1949 | Insufficient information on drug administration; insufficient information on outcomes reported (no outcome of interest reported) |
| Canet 1952 | Inadequate treatment dose |
| Canet 1953 | Inadequate treatment dose |
| Capponi 1953 | Inadequate treatment dose |
| Celli 1914 | Insufficient information on drug administration |
| Charles 1958 | Individually randomized study; testing conducted prior to treatment |
| Charles 1960 | Inadequate treatment dose |
| Charles 1962 | Inadequate treatment dose |
| Chaudhuri 1950 | Inadequate treatment dose |
| Chen 1999 | Insufficient information on outcomes reported; treatment not administered to entire population |
| Cisse 2006 | Individually randomized study |
| Cisse 2009 | Treatment not administered to entire population; intermittent preventive treatment for children (IPTc) study |
| Ciuca 1937 | Mixed curative and prophylactic dosing |
| Clark 1942 | Testing conducted prior to treatment |
| Clarke 2008 | Treatment not administered to entire population; intermittent preventive treatment for children (IPTc) study |
| Clyde 1958 | Insufficient information on drug administration |
| Clyde 1961a | Insufficient information on outcomes reported |
| Clyde 1961b | Insufficient information on outcomes reported |
| Clyde 1962 | Inadequate treatment dose |
| Coutinho 1962 | Inadequate treatment dose |
| D'Anfreville 1930 | Insufficient information on drug administration; insufficient information on outcomes reported (no outcome of interest reported) |
| Danquah 2009 | Individually randomized study |
| Dapeng 1996 | Insufficient information on drug administration; insufficient information on outcomes reported |
| de Mello 1938 | Inadequate treatment dose |
| Decourt 1935 | Inadequate treatment dose; individually randomized study |
| Decourt 1936 | Inadequate treatment dose |
| Delmont 1981 | Inadequate treatment dose; individually randomized study |
| Desowitz 1987 | Insufficient information on drug administration |
| Diallo 1977 | Inadequate treatment dose |
| Diallo 1983 | Treatment not administered to entire population; intermittent preventive treatment in children (IPTc) study |
| Dicko 2008 | Individually randomized study; testing conducted prior to treatment |
| Dicko 2011 | Individually randomized study |
| Dixon 1950 | Inadeqaute treatment dose |
| Doi 1989 | Individually randomized study; testing conducted prior to treatment |
| Dola 1974 | Inadequate treatment dose |
| Doucet 1947 | Inadequate treatment dose |
| Downs 1946 | Study participants did not remain in endemic area |
| Dupoux 1937 | Insufficient information on outcomes reported |
| Dupoux 1939 | Inadequate treatment dose |
| Edeson 1957 | Inadequate treatment dose |
| Farinaud 1934 | Insufficient information on drug administration |
| Farinaud 1950 | Inadequate treatment dose |
| Gaud 1949 | Inadequate treatment dose |
| Gilroy 1952 | Inadequate treatment dose |
| Gomez Mendoza 1960 | Insufficient information on outcomes reported |
| Gribben 1933 | Inadequate treatment dose |
| Gruer 1962 | Insufficient information on drug administration; insufficient information on outcomes of interest |
| Gunther 1951 | Inadequate treatment dose |
| Gunther 1952 | Mixed curative and prophylactic dosing |
| Gusmao 1970 | Inadequate treatment dose; individually randomized study |
| Han 2006 | Inadequate treatment dose |
| Harwin 1973 | Individually randomized study |
| Henderson 1934 | Mixed curative and prophylactic dosing |
| Ho 1965 | Insufficient information on outcomes reported (no outcome of interest reported) |
| Houel 1954b | Treatment not administered to entire population (children only) |
| Huehne 1971 | Post‐only outcomes reported |
| Janssens 1950 | Inadequate treatment dose |
| Joncour 1956 | Inadequate treatment dose |
| Kaneko 2010 | Insufficient information on drug administration; insufficient information on outcomes reported. |
| Karimov 2008 | Inadequate treatment dose |
| Kingsbury 1931 | Inadequate treatment dose |
| Klopfer 1949 | Inadequate treatment dose |
| Komp 1935 | Testing conducted prior to treatment |
| Konate 2011 | Individually randomized study |
| Kweku 2008 | Individually randomized study |
| Kweku 2009 | Insufficient information on outcomes reported; comparison of delivery strategies; treatment not administered to entire population (both arms included intermittent preventive treatment in children (IPTc)) |
| Lacroix 1952 | Inadequate treatment dose |
| Lahon 1960 | Inadequate treatment dose |
| Laing 1970 | Testing conducted prior to treatment |
| Laing 1984 | Inadequate treatment dose |
| Lakshmanacharyulu 1968 | Insufficient information on drug administration |
| Levenson 1943 | Mixed curative and prophylactic dosing |
| Liljander 2010 | Individually randomized study |
| Lui 1986 | Mixed curative and prophylactic dosing |
| Lysenko 1960 | Mixed curative and prophylactic dosing |
| MacCormack 1983 | Inadequate treatment dose |
| Mackerras 1954 | Inadequate treatment dose |
| Maiga 2009 | Individually randomized study |
| Malaria_Army 1934 | Inadequate treatment dose; insufficient information on outcomes reported |
| Mason 1973 | Insufficient information on drug administration |
| Mason 1977 | Insufficient information on drug administration |
| Mastbaum 1957a | Inadequate treatment dose |
| Mastbaum 1957b | Inadequate treatment dose |
| McGregor 1966 | Individually randomized study; testing conducted prior to treatment |
| Melik‐Adamian 1938 | Testing conducted prior to treatment |
| Mendez Galvan 1984 | Insufficient information on drug administration; insufficient information on outcomes reported |
| Mercier 1953 | Inadequate treatment dose |
| Merle 1955 | Inadequate treatment dose; treatment not administered to entire population (eg intermittent preventive treatment for children (IPTc)) |
| Mezincesco 1935 | Inadequate treatment dose |
| Miller 1955 | Inadequate treatment dose; individually randomized study; treatment not administered to entire population |
| Monteny 1960 | Inadequate treatment dose |
| Mühlens 1913 | Insufficient information on drug administration; insufficient information on outcomes of interest |
| Nakibuuka 2009 | Individually randomized study; testing conducted prior to treatment |
| Nankabirwa 2010 | Individually randomized study |
| Nave 1973 | Insufficient information on outcomes reported |
| Norman 1952 | Inadequate treatment dose; insufficient information on outcomes of interest |
| Ntab 2007 | Individually randomized study; insufficient information on outcomes reported |
| Omer 1978 | Inadequate treatment dose |
| Onori 1972 | Inadequate treatment dose |
| Ossi 1967 | Insufficient information on outcomes reported |
| Ouedraogo 2010 | Individually randomized study |
| Parrot 1937 | Inadequate treatment dose |
| Parrot 1943 | Inadequate treatment dose |
| Parrot 1944 | Inadequate treatment dose |
| Parrot 1946 | Inadequate treatment dose |
| Peters 1962 | Inadequate treatment dose |
| Phillips 1954 | Inadequate treatment dose |
| Pikul 1934 | Insufficient information on outcomes reported |
| Pribadi 1986 | Inadequate treatment dose |
| Prokopenko 1945 | Inadequate treatment dose |
| Rachou 1965 | Inadequate treatment dose |
| Rafi 1951 | Inadequate treatment dose |
| Ray 1948 | Inadequate treatment dose |
| Robin 1946 | Testing conducted prior to treatment |
| Rodríguez 1994 | Testing conducted prior to treatment |
| Rohner 2010 | Individually randomized study |
| Saarinen 1987 | Mixed curative and prophylactic dosing |
| Salako 1990 | Individually randomized study; testing conducted prior to treatment |
| Salihu 2000 | Inadequate treatment dose |
| Santos 1993 | Inadequate treatment dose |
| Schliessmann 1973 | Insufficient information on outcomes reported |
| Schneider 1948a | Inadequate treatment dose |
| Schneider 1948b | Inadequate treatment dose |
| Schneider 1958 | Inadequate treatment dose |
| Schneider 1962 | Individually randomized study; treatment not administered to entire population (eg intermittent preventive treatment for children (IPTc)) |
| Seckinger 1935 | Inadequate treatment dose |
| Sehgal 1968 | Insufficient information on drug administration |
| Sergent 1913 | Inadequate treatment dose; insufficient information on outcomes reported |
| Sesay 2011 | Individually randomized study |
| Shanks 1992 | Inadequate treatment dose; individually randomized study; testing conducted prior to treatment |
| Shanks 1993 | Individually randomized study; study participants did not remain in endemic area |
| Shanks 1995a | Inadequate treatment dose; study participants did not remain in endemic area |
| Shanks 1995b | Study participants did not remain in endemic area |
| Sheinker 1945 | Testing conducted prior to treatment |
| Singh 1968 | Insufficient information on outcomes reported |
| Snowden 2006 | Insufficient information on drug administration; insufficient information on outcomes reported |
| Sokhna 2008 | Individually randomized study |
| Sorel 1913 | Insufficient information on drug administration |
| Srivastava 1950 | Inadequate treatment dose |
| Strangeways‐Dixon 1950 | Inadequate treatment dose |
| Strickland 1986 | Testing conducted prior to treatment |
| Swellengrebel 1931 | Inadequate treatment dose |
| Tagbor 2011 | Treatment not administered to entire population; intermittent preventive treatment for children (IPTc) study |
| Tine 2011 | Treatment not administered to entire population; intermittent preventive treatment for children (IPTc) study |
| Turner 1977 | Insufficient information on outcomes reported |
| Usenbaev 2006 | Insufficient information on drug administration |
| Usenbaev 2008 | Insufficient information on drug administration |
| Van Dijk 1958 | Inadequate treatment dose |
| Van Goor 1950 | Inadequate treatment dose |
| Verhoef 2002 | Individually randomized study |
| Villegas 2010 | Testing conducted prior to treatment |
| Wallace 1936 | Mixed curative and prophylactic dosing |
| Wallace 1954 | Insufficient information on drug administration |
| Watkins 1987 | Individually randomized; mixed curative and prophylactic dosing |
| White 1934 | Inadequate treatment dose |
| White 1937 | Mixed curative and prophylactic dosing |
| Winter 1934 | Insufficient information on outcomes reported |
| Wone 1967 | Inadequate treatment dose |
| Yip 1998 | Insufficient information on outcomes reported |
Differences between protocol and review
Authors and contact person
Since the initial publication of our protocol, there have been changes in the order of authorship and in the designated contact person. Jimee Hwang will now act as the contact person for this review, to whom correspondence about the review should be addressed. Order of authorship has changed, with Jimee Hwang as senior author and Jacek Skarbinski listed as second author.
Study Design
Clinical illness was not assessed as an outcome measure, as initially planned in the original protocol. However, the methods for extracting and analyzing all other primary and secondary outcomes followed the methods outlined in the protocol.
Adjustments for cluster randomized trials were not attempted and estimates were individually analyzed.
Methodological quality was assessed using the Cochrane Collaboration’s risk of bias tool (Higgins 2011) and suggested risk of bias criteria for Effective Practice and Organisation of Care (EPOC) reviews. A GRADE assessment was also added.
Measures of treatment effect
Due to the few high‐quality trials and the heterogeneity of our studies, funnel plots were not created to examine study effect by plotting relative measures of treatment effect on a logarithmic scale against the standard error (and its inverse).
We did not categorize our outcomes as early outcome measures (< 6 months after MDA) versus late outcome measures (≥ 6 months after MDA). Instead, we created smaller time intervals (eg during, within 1 month, 1‐3 months, 4‐6 months, 7‐12 months, and >12 months post‐intervention) due to the heterogeneity of our studies and early outcome measures.
Due to the small number of studies in our proposed subgroup analyses, we did not carry out analyses assessing high and moderate quality studies only, or review the use of MDA with chloroquine/primaquine for control of P. vivax.
Contributions of authors
EP, JH and JS reviewed the literature and abstracted the data. EP, JH, JS and DS conducted the analyses. EP, JH and DS drafted the manuscript. All authors contributed to the design of the review and reviewed the manuscript.
Sources of support
Internal sources
Centers for Disease Control and Prevention, USA.
External sources
Department for International Development, UK.
Declarations of interest
All authors report no known conflicts of interest.
Unchanged
References
References to studies included in this review
Archibald 1960 NGA {published data only}
- Archibald HM. Field trials of mass administration of antimalarial drugs in Northern Nigeria. World Health Organization 1960, (262):1‐11. [Google Scholar]
Cáceres Garcia 2008 VEN {published data only}
- Cáceres Garcia JL. Eficacia de la cura radical masiva en la incidencia malárica del Municipio Mariño, Estado Sucre. Boletin de Malariologia y Salud Ambiental 2004;44(1):45‐9. [Google Scholar]
- Cáceres Garcia JL. Estado Sucre: El éxito antimalárico de Venezuela en el año 2003. Boletin de Malariologia y Salud Ambiental 2004;44(1):51‐5. [Google Scholar]
- Cáceres Garcia JL. Malaria antes y después de la cura radical masiva en el estado Sucre Venezuela. Boletin de Malariologia y Salud Ambiental 2008;48(1):83‐90. [Google Scholar]
- Cáceres Garcia JL, Nelsón P, Franklin VA, Pérez W, Rojas JG, Mora JD, et al. Impacto de la Cura Radical Masiva sobre la incidencia malárica del estado Sucre, Venezuela. Boletin de Malariologia y Salud Ambiental 2005;45(1):27‐36. [Google Scholar]
Cavalie 1962 CMR {published data only}
- Cavalie Ph, Mouchet J. Les Campagnes Experimentales d'eradication du paludisme dans le nord de la Republique du Cameroun. Medicine Tropicale 1962;22(1):95‐118. [Google Scholar]
Comer 1971 PAN {published data only}
- Comer RD, Young MD, Johnson CM, Babione RW. Mass drug trial of pyrimethamine and primaquine for the eradication of malaria in Sambu, Republic of Panama. Boletin de la Oficina Sanitaria Panamericana 1971;70(3):226‐33. [PubMed] [Google Scholar]
De Zulueta 1961 UGA {published data only}
- Zulueta J, Kafuko GW, Cullen JR, Pedersen CK. The results of the first year of a malaria eradication pilot project in Northern Kigezi (Uganda). East African Medical Journal 1961;38(1):1‐26. [PubMed] [Google Scholar]
De Zulueta 1964 UGA {published data only}
- Zulueta J, Kafuko GW, McCrae AWR, Cullen JR, Pedersen CK, Wasswa DFB. A malaria eradication experiment in the highlands of Kigezi (Uganda). East African Medical Journal 1964;41(3):102‐20. [PubMed] [Google Scholar]
Escudie 1962 BFA {published data only}
- Escudie A, Hamon J, Schneider J. Results of mass antimalarial chemoprophylaxis with a combination of 4‐aminoquinoline and 8‐aminoquinoline under rural African conditions in the region of Bobo‐Dioulasso (Upper Volta) 1960. Comparative study in a zone treated with DDT and outside this zone. Medecine Tropicale 1962;22(2):268‐305. [Google Scholar]
Gabaldon 1959 VEN {published data only}
- Gabaldon A, Guerrero L. An attempt to eradicate malaria by the weekly administration of pyrimethamine in areas of out‐of‐doors transmission in Venezuela. American Journal of Tropical Medicine and Hygiene 1959;8(4):433‐9. [DOI] [PubMed] [Google Scholar]
Garfield 1983 NIC {published data only}
- Bruce‐Chwatt LJ, Bruce‐Chwatt LJ. Mass drug administration for control of malaria. The Lancet 1983;2(8351):688. [DOI] [PubMed] [Google Scholar]
- Foll C, Foll C. Mass drug administration for control of malaria. The Lancet 1983;2(8357):1022. [DOI] [PubMed] [Google Scholar]
- Garfield R. Malaria control in Nicaragua: social and political influences on disease transmission and control activities. The Lancet 1999;354:414‐8. [DOI] [PubMed] [Google Scholar]
- Garfield RM, Vermund SH. Malaria in Nicaragua: an update. The Lancet 1984;1(8386):1125. [DOI] [PubMed] [Google Scholar]
- Garfield RM, Vermund SH, Garfield RM, Vermund SH. Changes in malaria incidence after mass drug administration in Nicaragua. Lancet 1983;2(8348):500‐3. [DOI] [PubMed] [Google Scholar]
- Garfield RM, Vermund SH, Garfield RM, Vermund SH. Health education and community participation in mass drug administration for malaria in Nicaragua. Social Science & Medicine 1986;22(8):869‐77. [DOI] [PubMed] [Google Scholar]
Gaud 1953 MAR {published data only}
- Gaud J, Houel G. Individual and mass treatment of malaria by a single dose of Flavoquine (amodiaqulne). Bulletin de la Societe de Pathologie Exotique 1953;46(4):565‐71. [PubMed] [Google Scholar]
Hii 1987 MYS {published data only}
- Hii JL, Vun YS, Chin KF, Chua R, Tambakau S, Binisol ES, et al. The influence of permethrin‐impregnated bednets and mass drug administration on the incidence of Plasmodium falciparum malaria in children in Sabah, Malaysia. Medical and Veterinary Entomology 1987;1(4):397‐407. [DOI] [PubMed] [Google Scholar]
Houel 1954 MAR {published data only}
- Houel G. A note on the treatment of epidemic‐malaria with a single dose of pyrimethamine [Note sur le traitement du paludisme épidémique par une dose unique de pyriméthamine]. Bulletin de la Societe de Pathologie Exotique 1954;47(2):262‐4. [PubMed] [Google Scholar]
Jones 1954 KEN {published data only}
- Jones SA, Jones SA. Resistance of P. falciparum and P. malariae to pyrimethamine (daraprim) following mass treatment with this drug; a preliminary note. East African Medical Journal 1954;31(2):47‐9. [PubMed] [Google Scholar]
Jones 1958 KEN {published data only}
- Jones SA, Jones SA. Mass treatment with pyrimethamine; a study of resistance and cross resistance resulting from a field trial in the hyperendemic malarious area of Makueni, Kenya. September 1952‐September 1953. Transactions of the Royal Society of Tropical Medicine & Hygiene 1958;52(6):547‐61. [DOI] [PubMed] [Google Scholar]
Kaneko 2000 VUT {published data only}
- Kaneko A, Taleo G, Kalkoa M, Yamar S, Kobayakawa T, Bjorkman A. Malaria eradication on islands. Lancet 2000;356(9241):1560‐4. [DOI] [PubMed] [Google Scholar]
- Kaneko A, Taleo GK, Rieckmann KH. Island malaria control in eastern Melanesia: 1. Malaria eliminated from a small island by 9‐week mass drug administration and impregnated bednets. Japanese Journal of Parasitology 1994;43(5):358‐70. [Google Scholar]
Kligler 1931 PSE {published data only}
- Kligler IJ, Mer G. Periodic intermittent treatment with Chinoplasmine as a measure of malaria control in a hyperendemic area. Rivista di Malariologia 1931;10(4):425‐438. [Google Scholar]
Kondrashin 1985 IND {published data only}
- Kondrashin AV, Sanyal MC, Kondrashin AV, Sanyal MC. Mass drug administration in Andhra Pradesh in areas under Plasmodium falciparum containment programme. Journal of Communicable Diseases 1985;17(4):293‐9. [PubMed] [Google Scholar]
Malaria_Taiwan 1991 TWN {published data only}
- Department of Health, The Executive Yuan Republic of China. Malaria eradication in Lanyu. Malaria Eradication in Taiwan. 1991:245‐62. [Google Scholar]
Metselaar 1961 PNG {published data only}
- Metselaar D. Seven years' malaria research and residual house spraying in Netherlands New Guinea. The American Journal of Tropical Medicine and Hygiene 1961;10(3):327‐34. [DOI] [PubMed] [Google Scholar]
Molineaux 1980 NGA {published data only}
- Cornille Brogger R, Mathews HM, Storey J, Ashkar TS, Brogger S, Molineaux L. Changing patterns in the humoral immune response to malaria before, during and after the application of control measures: a longitudinal study in the West African savanna. Bulletin of the World Health Organization 1978;56(4):579‐600. [PMC free article] [PubMed] [Google Scholar]
- Molineaux L, Cornille‐Brogger R, Mathews HM, Storey J, Ashkar TS. Longitudinal serological study of malaria in infants in the West African savanna. Comparisons in infants exposed to, or protected from, transmission from birth. Bulletin of the World Health Organisation 1978;56(4):573‐8. [PMC free article] [PubMed] [Google Scholar]
- Molineaux L, Gramiccia G. The Garki Project. Research on the epidemiology and control of malaria in the Sudan Savanna of West Africa. Geneva: World Health Organization, 1980. [Google Scholar]
- Molineaux L, Storey J, Cohen JE, Thomas A. A longitudinal study of human malaria in the West African savanna in the absence of control measures: relationships between different Plasmodium species, in particular P. falciparum and P. malariae. The American Journal of Tropical Medicine and Hygiene 1980;29(5):725‐37. [DOI] [PubMed] [Google Scholar]
Najera 1973 NGA {published data only}
- Najera JA, Shidrawi GR, Storey J, Lietaert PEA. Mass drug administration and DDT indoor‐spraying as antimalarial measures in the northern savanna of Nigeria. World Health Organization 1973;73(817):1‐34. [Google Scholar]
Paik 1974a SLB {published data only}
- Paik. Focus on malaria. Papua New Guinea Medical Journal 1974;17(1):1‐115. [Google Scholar]
Paik 1974b SLB {published data only}
- Paik. Focus on Malaria. Papua New Guinea Medical Journal 1974;17(1):1‐115. [Google Scholar]
Ricosse 1959 BFA {published data only}
- Ricosse J, Bailly‐Choumara H, Adam JP, Hamon J. Results of pyrimethamine chemoprophylaxis in a pilot antimalarial prevention study in Bobo‐Dioulasso [Resultats d'une experimentation de chimioprophylaxie par la pyrimethamine dans la zone pilote de lutte antipaludique de Bobo‐Diolasso]. Bulletin de la Societe de Pathologie Exotique 1959;52:516‐35. [Google Scholar]
Roberts 1964 KEN {published data only}
- Roberts JMD. Pyrimethamine (Daraprim) in the control of epidemic malaria. The American Journal of Tropical Medicine and Hygiene 1956;59:201‐8. [PubMed] [Google Scholar]
- Roberts JMD. The control of epidemic malaria in the highlands of Western Kenya. Part I. Before the campaign. The American Journal of Tropical Medicine and Hygiene 1964;67(7):161‐8. [PubMed] [Google Scholar]
- Roberts JMD. The control of epidemic malaria in the highlands of Western Kenya. Part II. The campaign. The American Journal of Tropical Medicine and Hygiene 1964;67(8):191‐9. [PubMed] [Google Scholar]
- Roberts JMD. The control of epidemic malaria in the highlands of Western Kenya. Part III. After the campaign. The American Journal of Tropical Medicine and Hygiene 1964;67(9):230‐37. [PubMed] [Google Scholar]
Schneider 1961 BFA {published data only}
- Schneider J, Escudie A, Hamon J. Eradication of malaria and chemotherapy. Results obtained with the association amino‐4 quinoline + amino‐8 quinoline in the pilot area of Bobo‐Dioulasso (Haute‐ Volta) [Eradication du paludisme et chimiotherapie resultats d'un essai de l'association: <<amino‐4 quinoleine>>/<<amino‐8 quinoleine>> dans la <<zone pilote>> de Bobo‐Dioulasso (Haute Volta)]. Bulletin de la Societe de Pathologie Exotique 1961;54(5):1012‐25. [PubMed] [Google Scholar]
Shekalaghe 2011 TZA {published data only}
- Shekalaghe SA, Drakeley C, Bosch S, ter Braak R, Bikilaardt W, Mwanziva C, et al. A cluster‐randomized trial of mass drug administration with a gametocytocidal drug combination to interrupt malaria transmission in a low endemic area in Tanzania. Malaria Journal 2011;10:247. [DOI] [PMC free article] [PubMed] [Google Scholar]
- Shekalaghe SA, ter Braak R, Daou M, Kavishe R, Bijilaardt W, Bosch S, et al. In Tanzania, hemolysis after a single dose of primaquine coadministered with an artemisinin is not restricted to glucose‐6‐phosphate dehydrogenase‐deficient (G6PD A) individuals. Antimicrobial Agents and Chemotherapy 2010;54(5):1762‐8. [DOI] [PMC free article] [PubMed] [Google Scholar]
Simeons 1938 IND {published data only}
- Simeons ATW. Follow‐up of a mass treatment with injectable atebrin. Indian Medical Gazette 1938;73(12):713‐5. [PMC free article] [PubMed] [Google Scholar]
- Simeons ATW. Mass treatment with injectable atebrin. Indian Medical Gazette 1936;71(3):132‐7. [PMC free article] [PubMed] [Google Scholar]
Singh 1953 IND {published data only}
- Singh J, Misra BG, Ray AP. Suppressive treatment with amodlaquln. Indian Journal of Malariology 1953;7(1):27‐31. [PubMed] [Google Scholar]
Song 2010 KHM {published data only}
- Song J, Socheat D, Tan B, Dara P, Deng C, Sokynthea S, et al. Rapid and effective malaria control in Cambodia through mass administration of artemisinin‐piperaquine. Malaria Journal 2010;9:57. [DOI] [PMC free article] [PubMed] [Google Scholar]
van Dijk 1961 PNG {published data only}
- Dijk W, Dijk W. Mass treatment of malaria with chloroquine. Results of a trial in Inanwatan. Tropical & Geographical Medicine 1961;13:351‐6. [PubMed] [Google Scholar]
von Seidlein 2003 GMB {published data only}
- Martin S, Seidlein L, Deen JL, Pinder M, Walraven G, Greenwood B, et al. Community perceptions of a mass administration of an antimalarial drug combination in The Gambia. Tropical Medicine & International Health 2001;6(6):442‐8. [DOI] [PubMed] [Google Scholar]
- Seidlein L, Walraven G, Milligan PJ, Alexander N, Manneh F, Deen JL, et al. The effect of mass administration of sulfadoxine‐pyrimethamine combined with artesunate on malaria incidence: a double‐blind, community‐randomized, placebo‐controlled trial in The Gambia. Transactions of the Royal Society of Tropical Medicine & Hygiene 2003;97(2):217‐25. [DOI] [PubMed] [Google Scholar]
References to studies excluded from this review
Abraham 1944 {published data only}
- Abraham AC, Samuels RD. Epidemiology of malaria in the Nizam‐ sagar Ayacut Area, Niz'amabad District, Hyderabad State. Journal of the Malaria Institute of India 1944;5(3):305‐18. [Google Scholar]
Afridi 1959 {published data only}
- Afridi MK, Rahim A. Further observation on the interruption of malaria transmission with single dose of pyrimethamine (Daraprim). Rivista di Parassitologia 1959;20(4):229‐42. [Google Scholar]
Ahorlu 2009 {published data only}
- Ahorlu CK, Koram KA, Seakey AK, Weiss MG, Ahorlu Collins K, Koram Kwadwo A, et al. Effectiveness of combined intermittent preventive treatment for children and timely home treatment for malaria control. Malaria Journal 2009;8:292. [DOI] [PMC free article] [PubMed] [Google Scholar]
Ahorlu 2011 {published data only}
- Ahorlu CK, Koram KA, Seake‐Kwawu A, Weiss MG. Two‐year evaluation of intermittent preventive treatment for children (IPTc) combined with timely home treatment for malaria control in Ghana. Malaria Journal 2011;10:127. [DOI] [PMC free article] [PubMed] [Google Scholar]
Aikins 1993 {published data only}
- Aikins MK, Pickering H, Alonso PL, D'Alessandro U, Lindsay SW, Todd J, Greenwood BM. A malarial control trial using insecticide‐treated bed nets and targeted chemoprophylaxis in a rural area of The Gambia, West Africa. 4. Perceptions of the causes of malaria and of its treatment and prevention in the study area. Transactions of the Royal Society of Tropical Medicine and Hygiene 1993;87(Supplement 3):25‐30. [DOI] [PubMed] [Google Scholar]
Alicata 1955 {published data only}
- Alicata JE, Dajani S W. Observation of pyrimethamine (Daraprim) as a suppressant of malaria in a small village in Jordan. The American Journal of Tropical Medicine and Hygiene 1955;4(6):1006‐8. [DOI] [PubMed] [Google Scholar]
Aliev 2000 {published data only}
- Aliev SP, Aliev SP. Malaria in the Republic of Tajikistan. Meditsinskaia Parazitologiia i Parazitarnye Bolezni 2000, (2):27‐9. [PubMed] [Google Scholar]
Aliev 2001 {published data only}
- Aliev S, Saparova N, Aliev S, Saparova N. Current malaria situation and its control in Tadjikistan. Meditsinskaia Parazitologiia i Parazitarnye Bolezni 2001, (1):35‐7. [PubMed] [Google Scholar]
Allen 1990 {published data only}
- Allen SJ, Otoo LN, Cooke G, O'Donnell A, Greenwood BM. Sensitivity of Plasmodium falciparum to Maloprim after five years of targeted chemoprophylaxis in a rural area of The Gambia. Transactions of the Royal Society of Tropical Medicine and Hygiene 1990;84(5):666‐7. [DOI] [PubMed] [Google Scholar]
Alonso 1993a {published data only}
- Alonso PL, Lindsay SW, Armstrong Schellenberg JRM, Konteh M, Keita K, Marshall C, et al. A malaria control trial using insecticide‐treated bed nets and targeted chemoprophylaxis in a rural area of The Gambia, West Africa. 5. Design and implementation of the trial. Transactions of the Royal Society of Tropical Medicine and Hygiene 1993;87(Supplement 2):31‐6. [DOI] [PubMed] [Google Scholar]
Alonso 1993b {published data only}
- Alonso PL, Lindsay SW, Armstrong Schellenberg JRM, Keita K, Gomez P, Shenton FC, et al. A malaria control trial using insecticide‐treated bed nets and targeted chemoprophylaxis in a rural area of The Gambia, West Africa. 6. The impact of the interventions on mortality and morbidity from malaria. Transactions of the Royal Society of Tropical Medicine and Hygiene 1993;87(Supplement 2):37‐44. [DOI] [PubMed] [Google Scholar]
Alving 1952 {published data only}
- Alving AS, Arnold J, Robinson DH, Alving AS, Arnold J, Robinson DH. Mass therapy of subclinical vivax malaria with primaquine. Journal of the American Medical Association 1952;149(17):1558‐62. [DOI] [PubMed] [Google Scholar]
Amangel'diev 2001 {published data only}
- Amangel'diev KA, Amangel'diev KA. Current malaria situation in Turkmenistan. Meditsinskaia Parazitologiia i Parazitarnye Bolezni 2001, (1):37‐9. [PubMed] [Google Scholar]
Annual Report 1932 {published data only}
- Annual Report of the Institute for Medical Research for the Year 1932. Kuala Lumpur: Govt. Press. Kuala Lumpur : Govt. Press, 1933:100.
Archambeault 1954 {published data only}
- Archambeault CP. Mass antimalarial therapy in veterans returning from Korea. JAMA 1954;154(17):1411‐5. [DOI] [PubMed] [Google Scholar]
Archibald 1956 {published data only}
- Archibald HM, Bruce‐Chwatt LJ. Suppression of malaria with pyrimethamine in Nigerian schoolchildren. Bulletin World Health Organization 1956;15:775‐84. [PMC free article] [PubMed] [Google Scholar]
Babione 1966 {published data only}
- Babione RW. Epidemiology of malaria eradication. II. Epidemiology of malaria eradication in Central America: A study of technical problems. American Journal of Public Health 1966;56(1):76‐90. [DOI] [PMC free article] [PubMed] [Google Scholar]
Banerjea 1949 {published data only}
- Banerjea R. The control of malaria in a rural area of West Bengal. Indian Journal of Malariology 1949;3(4):371‐86. [Google Scholar]
Barber 1932 {published data only}
- Barber MA, Rice JB, Brown JY. Malaria studies on the firestone rubber plantation in Liberia, West Africa. The American Journal of Hygiene 1932;15(3):601‐33. [Google Scholar]
Barger 2009 {published data only}
- Barger B, Maiga H, Traore OB, Tekete M, Tembine I, Dara A, et al. Intermittent preventive treatment using artemisinin‐based combination therapy reduces malaria morbidity among school‐aged children in Mali. Tropical Medicine & International Health 2009;14(7):784‐91. [DOI] [PMC free article] [PubMed] [Google Scholar]
Baukapur 1984 {published data only}
- Baukapur SN, Babu CJ. A focal outbreak of malaria in Valsad District, Gujarat State. Journal of Communicable Diseases 1984;16(4):268‐72. [PubMed] [Google Scholar]
Berberian 1948 {published data only}
- Berberian DA, Dennis EW. Field experiments with chloroquine diphosphate. American Journal of Tropical Medicine 1948;28(6):755‐76. [DOI] [PubMed] [Google Scholar]
Berny 1936 {published data only}
- Berny P, Nicolas L. Prophylaxis of malaria with Quinacrine and Rhodoquine in French Guiana. Bulletin de la Societe de Pathologie Exotique 1936;29(8):870‐2. [Google Scholar]
Bloch 1982 {published data only}
- Bloch M. Teachings of the antimalarial campaign in El Salvador, Central America. Revista del Instituto de Investigaciones Medicas 1982; Vol. 11, issue 2:119‐24.
Bojang 2009 {published data only}
- Bojang KA, Sesay S, Sowe M, Conway D, Milligan P, Greenwood B. A study of intermittent preventive treatment and home based management of malaria in a rural area of The Gambia. The American Journal of Tropical Medicine and Hygiene 2009;81(5 SUPPL. 1):145. [Google Scholar]
Bojang 2010 {published data only}
- Bojang K, Akor F, Bittaye O, Conway D, Bottomley C, Milligan P, et al. A randomised trial to compare the safety, tolerability and efficacy of three drug combinations for intermittent preventive treatment in children. PLoS One 2010;5(6):e11225. [DOI] [PMC free article] [PubMed] [Google Scholar]
Bojang 2011 {published data only}
- Bojang KA, Akor F, Conteh L, Webb E, Bittaye O, Conway DJ. Two strategies for the delivery of IPTc in an area of seasonal malaria transmission in the Gambia: a randomised controlled trial. PLoS Medicine 2011;8(2):e1000409. [DOI] [PMC free article] [PubMed] [Google Scholar]
Boulanger 2009 {published data only}
- Boulanger D, Sarr JB, Fillol F, Cisse B, Sokhna C, Riveau G, et al. Intermittent preventive treatment of malaria decreases the anti‐Plasmodium schizont antibody response of Senegalese children. Tropical Medicine and International Health 2009;14(suppl. 4):31. [Google Scholar]
Boulanger 2010 {published data only}
- Boulanger DJ, Sarr JB, Fillol F, Sokhna C, Cisse B, Schacht AM, et al. Immunological consequences of intermittent preventive treatment in Senegalese preschool children. Malaria Journal 2010;9(363). [DOI] [PMC free article] [PubMed] [Google Scholar]
Brink 1958 {published data only}
- Brink CJH. Malaria control in the Northern Transvaal. South African Medical Journal 1958;32(32):800‐9. [PubMed] [Google Scholar]
Butler 1943 {published data only}
- Butler FA. Malaria control program on a South Pacific base. Naval Medical Bulletin 1943;41(6):1603‐12. [Google Scholar]
Canet 1936 {published data only}
- Canet J. Prevention of malaria by the administration of synthetic drugs in the rubber plantations [Prophylaxie collective par medicaments synthetiques sur les plantation des terres rouges (1934‐1936)]. 1936.
Canet 1939 {published data only}
- Canet J. Results of four years mass prophylaxis with synthetic drugs in plantations in North Cochin‐China. Bulletin de la Societe de Pathologie Exotique 1939;32(1):58‐69. [Google Scholar]
Canet 1949 {published data only}
- Canet J. First trials in southern Indo‐China of mass prophylaxis of malaria with Nivaquine B (resoqulne) and with Paludrine. Bulletin de la Societe de Pathologie Exotique 1949;42(5/6):165‐8. [Google Scholar]
Canet 1952 {published data only}
- Canet J, Farinaud E. First trials of mass prophylaxis of malaria in Indo‐China by Daraprim. Bulletin de la Societe de Pathologie Exotique 1952;45(5):645‐52. [PubMed] [Google Scholar]
Canet 1953 {published data only}
- Canet J. Proguanil resistance during mass prophylaxis of hyperendemic P. falciparum malaria in Indo‐China. Bulletin de la Societe de Pathologie Exotique 1953;46(2):230‐45. [PubMed] [Google Scholar]
Capponi 1953 {published data only}
- Capponi M. Note on malaria In Douala. Medecine Tropicale 1953;13(3):361‐4. [PubMed] [Google Scholar]
Celli 1914 {published data only}
- Celli A. [English title not available]. Ann. d'Igiene 1914;24(2):177‐243. [Google Scholar]
Charles 1958 {published data only}
- Charles LJ. Comparative assessment of chloroquine and amodiaquine as malaria suppressive in Nigeria. Annals of Tropical Medicine and Parasitology 1958;52(67):55‐67. [DOI] [PubMed] [Google Scholar]
Charles 1960 {published data only}
- Charles LJ. Aftermath of a field trial in self‐administered pyrimethamine in a Ghanian community: the appearance of P. falciparum resistance. World Health Organization 1960; Vol. WHO/Mal/260.
Charles 1962 {published data only}
- Charles LJ, Kaay HJ, Vincke IH, Brady J. The appearance of pyrimethamine resistance in Plasmodium falciparum following self‐medication by a rural community in Ghana. Bulletin of the World Health Organization 1962;26(1):103‐8. [PMC free article] [PubMed] [Google Scholar]
Chaudhuri 1950 {published data only}
- Chaudhuri RN. Suppressive treatment of malaria, with statistical analysis by S. J. POTI. Indian Journal of Malariology 1950;4(2):115‐33. [PubMed] [Google Scholar]
Chen 1999 {published data only}
- Chen W, Wu K, Lin M, Tang L, Gu Z, Wang S, et al. A pilot study on malaria control by using a new strategy of combining strengthening infection source treatment and health education in mountainous areas of Hainan province. Chinese Journal of Parasitology & Parasitic Diseases 1999;17(1):1‐4. [PubMed] [Google Scholar]
Cisse 2006 {published data only}
- Cisse B, Sokhna C, Boulanger D, Milet J, Ba el H, Richardson K, et al. Seasonal intermittent preventive treatment with artesunate and sulfadoxine‐pyrimethamine for prevention of malaria in Senegalese children: a randomised, placebo‐controlled, double‐blind trial. The Lancet 2006;367(9511):659‐67. [DOI] [PubMed] [Google Scholar]
Cisse 2009 {published data only}
- Cisse B, Cairns M, Faye E, NDiaye O, Faye B, Cames C, et al. Randomized trial of piperaquine with sulfadoxine‐pyrimethamine or dihydroartemisinin for malaria intermittent preventive treatment in children. PLoS ONE [Electronic Resource] 2009;4(9):e7164. [DOI] [PMC free article] [PubMed] [Google Scholar]
Ciuca 1937 {published data only}
- Ciuca M, Balteanu I, Alexa I. Experimental control of malaria with synthetic drugs. Archives Roumaines de Pathologie Experimentale et de Microbiologie 1937;10(3):295‐306. [Google Scholar]
Clark 1942 {published data only}
- Clark HC, Komp WHW, Jobbins DM. A tenth year's observations on malaria in Panama, with reference to the occurrence of variations in the parasite index, during continued treatment with atabrine and plasmochine. American Journal of Tropical Medicine 1942;22:191‐216. [Google Scholar]
Clarke 2008 {published data only}
- Clarke SE, Jukes MC, Njagi JK, Khasakhala L, Cundill B, Otido J, et al. Effect of intermittent preventive treatment of malaria on health and education in schoolchildren: a cluster‐randomised, double‐blind, placebo‐controlled trial. The Lancet 2008;372(9633):127‐38. [DOI] [PMC free article] [PubMed] [Google Scholar]
Clyde 1958 {published data only}
- Clyde DF, Webbe G, Shute GT. Single dose pyrimethamine treatment of Africans during a malaria epidemic in Tanganyika. East African Medical Journal 1958;35(1):23‐9. [PubMed] [Google Scholar]
Clyde 1961a {published data only}
- Clyde DF. Malaria control in Tanganyika under the German administration. Part I. East African Medical Journal 1961;38(1):27‐42. [PubMed] [Google Scholar]
Clyde 1961b {published data only}
- Clyde DF. Malaria control in Tanganyika under the German administration. Part II. Mass chemoprophylaxis in Dar es Salaam. East African Medical Journal 1961;38(2):69‐82. [PubMed] [Google Scholar]
Clyde 1962 {published data only}
- Clyde DF. Mass administration of an antimalarial drug combining 4‐aminoquinoline and 8‐aminoquinoline in Tanganyika. Bulletin of the World Health Organization 1962;27(2):203‐12. [PMC free article] [PubMed] [Google Scholar]
Coutinho 1962 {published data only}
- Coutinho Da Costa F, Viana De Meira L. Malaria and anti‐malarial campaign in Bissau. Boletim Cultural da Guine Portuguesa 1962;17(65):119‐165. [Google Scholar]
D'Anfreville 1930 {published data only}
- D'Anfreville De La Salle L. A method of dealing with malaria in Morocco. Bulletin de la Societe de Pathologie Exotique 1930;23(1):53‐8. [Google Scholar]
Danquah 2009 {published data only}
- Danquah I, Dietz E, Zanger P, Reither K, Ziniel P, Bienzle U, et al. Reduced efficacy of intermittent preventive treatment of malaria in malnourished children. Antimicrobial Agents & Chemotherapy 2009;53(5):1753‐9. [DOI] [PMC free article] [PubMed] [Google Scholar]
Dapeng 1996 {published data only}
- Dapeng L, Leyuan S, Xili L, Xiance Y. A successful control programme for falciparum malaria in Xinyang, China. Transactions of the Royal Society of Tropical Medicine and Hygiene 1996;90:100‐2. [DOI] [PubMed] [Google Scholar]
Decourt 1935 {published data only}
- Decourt P. Mixed drug prophylaxis in Malaria. Bulletin de la Societe de Pathologie Exotique 1935;28(4):255‐61. [Google Scholar]
Decourt 1936 {published data only}
- Decourt Ph, Dupoux R, Belfort, Henry Ch. Mass prophylaxis of malaria in Tunisia. Bulletin de la Societe de Pathologie Exotique 1936;29(5):487‐93. [Google Scholar]
Delmont 1981 {published data only}
- Delmont J, Ranque P, Balique H, Tounkara A, Soula G, Quilici M, et al. Influence of antimalarial chemoprophylaxis on the health status of a rural community in West Africa. Preliminary results. Bulletin de la Societe de Pathologie Exotique 1981;74(6):600‐10. [PubMed] [Google Scholar]
de Mello 1938 {published data only}
- Mello IF. Anti‐malaria measures in rural areas of Portuguese India. Rivista di Malariologia 1938;17(3):208‐24. [Google Scholar]
Desowitz 1987 {published data only}
- Desowitz RS, Spark RA. Malaria in the Maprik area of the Sepik region, Papua New Guinea: 1957‐1984. Transactions of the Royal Society of Tropical Medicine and Hygiene 1987;81(1):175‐6. [DOI] [PubMed] [Google Scholar]
Diallo 1977 {published data only}
- Diallo S, Coulibaly A, Konate M, Samba O. Chloroquine prophylaxis and the prevalence of malaria. Medecine d'Afrique Noire 1977;24(2):117‐25. [Google Scholar]
Diallo 1983 {published data only}
- Diallo S, Diouf F, Bah IB, N'Dir O, Victorius A. Clinical consequences of chloroquine prophylaxis and of its discontinuation in an hyperendemic malarial region. Dakar Medical 1983;28(1):43‐65. [PubMed] [Google Scholar]
Dicko 2008 {published data only}
- Dicko A, Sagara I, Sissoko MS, Guindo O, Diallo AI, Kone M, et al. Impact of intermittent preventive treatment with sulphadoxine‐pyrimethamine targeting the transmission season on the incidence of clinical malaria in children in Mali. Malaria Journal 2008;7:123. [DOI] [PMC free article] [PubMed] [Google Scholar]
Dicko 2011 {published data only}
- Dicko A, Diallo AI, Tembine I, Dicko Y, Dara N, Sidibe Y, et al. Intermittent preventive treatment of malaria provides substantial protection against malaria in children already protected by an insecticide‐treated bednet in Mali: a randomised, double‐blind, placebo‐controlled trial. PLoS Medicine 2011;8(2):e1000407. [DOI] [PMC free article] [PubMed] [Google Scholar]
Dixon 1950 {published data only}
- Dixon DS. Paludrine (Proguanil) as a malarial prophylactic amongst African labour in Kenya. East African Medical Journal 1950;27(3):127‐30. [PubMed] [Google Scholar]
Doi 1989 {published data only}
- Doi H, Kaneko A, Panjaitan W, Ishii A. Chemotherapeutic malaria control operation by single dose of Fandisar plus Primaquine in North Sumatra, Indonesia. Southeast Asian Journal of Tropical Medicine and Public Health 1989;20(3):341‐9. [PubMed] [Google Scholar]
Dola 1974 {published data only}
- Dola SK, Dola SK. Mass drug administration as a supplementary attack measure in malaria eradication programme. East African Medical Journal 1974;51(7):529‐31. [PubMed] [Google Scholar]
Doucet 1947 {published data only}
- Doucet G. Preliminary note on the use of S.N. 7618 (Chloroquine) in a hyperendemic malarial locality. Annales de la Societe Belge de Medecine Tropicale 1947;27(4):341‐6. [PubMed] [Google Scholar]
Downs 1946 {published data only}
- Downs WG. Results in an infantry regiment of several plans of treatment for vivax malaria. American Journal of Tropical Medicine 1946;26(1):67‐86. [PubMed] [Google Scholar]
Dupoux 1937 {published data only}
- Dupoux R, Marini C, Barthas R. Mass prophylaxis of malaria in Tunis. Bulletin De l'Academie Nationale de Medecine 1937;118(35):368‐72. [Google Scholar]
Dupoux 1939 {published data only}
- Dupoux R, Barthas R, Antoine A, Garali TM. Recent results of experiment in collective antimalarial prophylaxis in Tunis. Bulletin De l'Academie Nationale de Medecine 1939;121(15):591‐5. [Google Scholar]
Edeson 1957 {published data only}
- Edeson JFB, Wharton RH, Wilson T, Reid JA. An experiment in the control of rural malaria in Malaya. The Medical Journal of Malaya 1957;12(1):319‐47. [PubMed] [Google Scholar]
Farinaud 1934 {published data only}
- Farinaud M. [English title not available] [Essai de prophylaxie rationnelle du paludisme en milieu infantile a Tri‐Cu (Tonkin)]. Bulletin de la Societe de Pathologie Exotique 1934;27(6):568‐75. [Google Scholar]
Farinaud 1950 {published data only}
- Farinaud ME, Choumara R. Malarial infestation and demography of the mountain population of Southern Indo‐China (P.M.S.I.). First Part: Malaria among the P.M.S.I; chemoprophylaxis and DDT dusting. Bull. Econ. Indochine 1950;22:5‐22. [Google Scholar]
Gaud 1949 {published data only}
- Gaud J, Schneider J, Mechali D. Comparative efficacy of nivaquine and chloriguane in mass prophylaxis of Malaria. Bull. Inst. Hyg. Maroc. 1949;9(1/2):121‐9. [Google Scholar]
Gilroy 1952 {published data only}
- Gilroy AB. Proguanil‐resistant Plasmodium falciparum in Assam. Annals of Tropical Medicine and Parasitology 1952;46(2):121‐6. [PubMed] [Google Scholar]
Gomez Mendoza 1960 {published data only}
- Gomez Mendoza I. Observations on the programme for the employment of antimalarial drugs in the malaria eradication campaign in Venezuela. CNEP Boletin 1960;4(2):74‐81. [Google Scholar]
Gribben 1933 {published data only}
- Gribben GR. Mass treatment with plasmoquine. The British Medical Journal 1933, (3802):919‐20. [Google Scholar]
Gruer 1962 {published data only}
- Gruer N, Ousset JH, Lopez Manan CE. Special problems in the malaria eradication campaign. Anales del Instituto Nacional de Microbiologia 1962;1:127‐31. [Google Scholar]
Gunther 1951 {published data only}
- Gunther CE. Proguanil hydrochloride (paludrine) in the prevention and treatment of malaria in New Guinea. Transactions of the Royal Society of Tropical Medicine and Hygiene 1951;44(4):473‐8. [DOI] [PubMed] [Google Scholar]
Gunther 1952 {published data only}
- Gunther CEM, Fraser NM, Wright WG. Proguanil and malaria among non‐tolerant New Guinea natives. Transactions of the Royal Society of Tropical Medicine and Hygiene 1952;46(2):185‐200. [DOI] [PubMed] [Google Scholar]
Gusmao 1970 {published data only}
- Gusmao HH, Juarez E. A trial of CI‐564 (Dapolar(r)), a repository antimalarial for prophylaxis in Amapá, Brazil. The American Journal of Tropical Medicine and Hygiene 1970;19(3):394‐400. [DOI] [PubMed] [Google Scholar]
Han 2006 {published data only}
- Han ET, Lee DH, Park KD, Seok WS, Kim YS, Tsuboi T, et al. Reemerging vivax malaria: changing patterns of annual incidence and control programs in the Republic of Korea. Korean Journal of Parasitology 2006;44(4):285‐94. [DOI] [PMC free article] [PubMed] [Google Scholar]
Harwin 1973 {published data only}
- Harwin RM. A field trial of the effectiveness of cycloguanil pamoate in Rhodesia. Central African Journal of Medicine 1973;19(1):9‐12. [PubMed] [Google Scholar]
Henderson 1934 {published data only}
- Henderson LH. Prophylaxis of malaria in the Sudan, with special reference to the use of plasmoqulne. Transactions of the Royal Society of Tropical Medicine and Hygiene 1934;28(2):157‐164. [Google Scholar]
Ho 1965 {published data only}
- Ho C. Studies on malaria in new China. Chinese Medical Journal 1965;84(8):491‐7. [PubMed] [Google Scholar]
Houel 1954b {published data only}
- Houel G, Goor WT. Chemoprophylaxis of malaria with monthly doses of chloroquine and amodiaquine. Bulletin de la Societe de Pathologie Exotique 1954;47(2):254‐60. [PubMed] [Google Scholar]
Huehne 1971 {published data only}
- Huehne WH. Experience with an insecticide/drug combination and observations on suppressive chloroquine/pyrimethamine treatment. The American Journal of Tropical Medicine and Hygiene 1971;74(5):110‐6. [PubMed] [Google Scholar]
Janssens 1950 {published data only}
- Janssens PG, Verstraete N, Sieniawski J. Trials of collective antimalaria drug prophylaxis among children of mine workers at Kilo. Annales de la Societe Belge de Medecine Tropicale 1950;30(2/3):257‐86; 449‐78. [Google Scholar]
Joncour 1956 {published data only}
- Joncour G. La lutte contre le paludisme A Madagascar. Bulletin World Health Organization 1956;15:711‐23. [PMC free article] [PubMed] [Google Scholar]
Kaneko 2010 {published data only}
- Kaneko A. A community‐directed strategy for sustainable malaria elimination on islands: short‐term MDA integrated with ITNs and robust surveillance. Acta Tropica 2010;114(3):177‐83. [DOI] [PubMed] [Google Scholar]
Karimov 2008 {published data only}
- Karimov SS, Kadamov DS, Murodova NKh, Karimov SS, Kadamov DS, Murodova NKh. The current malaria situation in Tadjikistan. Meditsinskaia Parazitologiia i Parazitarnye Bolezni 2008, (1):33‐6. [PubMed] [Google Scholar]
Kingsbury 1931 {published data only}
- Kingsbury AN, Amies CR. A field experiment on the value of plasmoquine in the prophylaxis of malaria. Transactions of the Royal Society of Tropical Medicine and Hygiene 1931;25(3):159‐172. [Google Scholar]
Klopfer 1949 {published data only}
- Klopfer S. The suppressive sction of paludrine in benign tertian (vivax) malaria. Documenta Neerlandica et Indonesica de Morbis Tropicis 1949;1(1):50‐4. [PubMed] [Google Scholar]
Komp 1935 {published data only}
- Komp WHW, Clark HC. A fourth year's observations on malaria in Panama, with reference to control with atabrine and plasmochin. American Journal of Tropical Medicine 1935;15(2):131‐54. [Google Scholar]
Konate 2011 {published data only}
- Konate AT, Yaro JB, Ouedraogo AZ, Diarra A, Gansane A, Soulama I, et al. Intermittent preventive treatment of malaria provides substantial protection against malaria in children already protected by an insecticide‐treated bednet in Burkina Faso: a randomised, double‐blind, placebo‐controlled trial. PLoS Medicine 2011;8(2):e1000408. [DOI] [PMC free article] [PubMed] [Google Scholar]
Kweku 2008 {published data only}
- Kweku M, Liu D, Adjuik M, Binka F, Seidu M, Greenwood B, et al. Seasonal intermittent preventive treatment for the prevention of anaemia and malaria in Ghanaian children: a randomized, placebo controlled trial. PLoS ONE [Electronic Resource] 2008;3(12):e4000. [DOI] [PMC free article] [PubMed] [Google Scholar]
Kweku 2009 {published data only}
- Kweku M, Webster J, Adjuik M, Abudey S, Greenwood B, Chandramohan D, et al. Options for the delivery of intermittent preventive treatment for malaria to children: a community randomised trial. PLoS ONE [Electronic Resource] 2009;4(9):e7256. [DOI] [PMC free article] [PubMed] [Google Scholar]
Lacroix 1952 {published data only}
- Lacroix M, Mazzuca M, Bonnet M. Proguanil and malaria prophylaxis in two Algerian villages. Bulletin de la Societe de Pathologie Exotique 1952;45(4):460‐4. [PubMed] [Google Scholar]
Lahon 1960 {published data only}
- Lahon H, Smet M, Boets L. Results of 5 years of mass chemoprophylaxis with pyrimethamine in Yangambi, Congo. Annales de la Societe Belge de Medecine Tropicale 1960;40(4):651‐73. [PubMed] [Google Scholar]
Laing 1970 {published data only}
- Laing AB. Malaria suppression with fortnightly doses of pyrimethamine with sulfadoxine in the Gambia. Bulletin of the World Health Organization 1970;43:513‐20. [PMC free article] [PubMed] [Google Scholar]
Laing 1984 {published data only}
- Laing ABG. The impact of malaria chemoprophylaxis in Africa with special reference to Madagascar, Cameroon, and Senegal. Bulletin of the World Health Organization 1984;62(Suppl.):41‐8. [PMC free article] [PubMed] [Google Scholar]
Lakshmanacharyulu 1968 {published data only}
- Lakshmanacharyulu T, Guha AK, Kache SR. Control of malaria epidemics in a river valley project. Bulletin of the Indian Society for Malaria and Other Communicable Diseases 1968;5(1‐2):312‐22. [Google Scholar]
Levenson 1943 {published data only}
- Levenson ED, Fastorskaya EI, Khovanskaya AI, Duk‐Hanina NN. Experiences in the control of a malarial focus in the north (Arehangel Région) by mass chemoprophylaxis and systematic treatment of malaria patients (Russian). Meditsinskaya Parazitologiya i Parazitarnye Bolezni 1943;12(Pt. 1):23‐38. [Google Scholar]
Liljander 2010 {published data only}
- Liljander A, Chandramohan D, Kweku M, Olsson D, Montgomery SM, Greenwood B, et al. Influences of intermittent preventive treatment and persistent multiclonal Plasmodium falciparum infections on clinical malaria risk. PLoS ONE [Electronic Resource] 2010;5(10):e13649. [DOI] [PMC free article] [PubMed] [Google Scholar]
Lui 1986 {published data only}
- Liu YL, Wu KS, Jia JX. Integrated approach in malaria control including environmental management to reduce man‐mosquito contact and reduction of infection source in Huanghuai Plain. Journal of Parasitology and Parasitic Diseases 1986;4(4):246‐50. [PubMed] [Google Scholar]
Lysenko 1960 {published data only}
- Lysenko AY. Use of quinocide in treatment and prophylaxis of vivax malaria. Bulletin of the World Health Organization 1960;22:641‐62. [PMC free article] [PubMed] [Google Scholar]
MacCormack 1983 {published data only}
- MacCormack CP, Lwihula G. Failure to participate in a malaria chemosuppression programme: North Mara, Tanzania. Journal of Tropical Medicine and Hygiene 1983;86(3):99‐107. [PubMed] [Google Scholar]
Mackerras 1954 {published data only}
- Mackerras MJ, Saxdars DF. Malaria in the Torres Straits Islands. South Pacific Comission Technical Paper No. 68 1954:vi + 27 pp.
Maiga 2009 {published data only}
- Maiga H, Barger B, Traore OB, Tekete M, Timbine A, Dara A, et al. Intermittent preventive treatment using artemisinin‐based combination therapy reduces malaria morbidity among school‐aged children in Mali. The American Journal of Tropical Medicine and Hygiene 2009;81(5 SUPPL. 1):42. [DOI] [PMC free article] [PubMed] [Google Scholar]
Malaria_Army 1934 {published data only}
- Malaria in the army in India. The Lancet 1934;223:802. [Google Scholar]
Mason 1973 {published data only}
- Mason J, Hobbs JH. A study of the epidemiology of malaria in a high‐incidence coastal area of El Salvador, C. A. Revista del Instituto de Investigaciones Medicas 1973;2(1):51‐7. [Google Scholar]
Mason 1977 {published data only}
- Mason J, Hobbs J. Malaria field studies in a high‐incidence coastal area of El Salvador, C.A. Bulletin of the Pan American Health Organization 1977;11(1):17‐30. [PubMed] [Google Scholar]
Mastbaum 1957a {published data only}
- Mastbaum O. Past and present position of malaria in Swaziland. Journal of Tropical Medicine and Hygiene 1957;60(5):119‐27. [PubMed] [Google Scholar]
Mastbaum 1957b {published data only}
- Mastbaum O. Malaria control in Swaziland. Some observations during the first year of partial discontinuation of insecticides. Journal of Tropical Medicine and Hygiene 1957;60(8):190‐2. [PubMed] [Google Scholar]
McGregor 1966 {published data only}
- McGregor LA, Williams K, Walker GH, Rahman AK. Cycloguanil pamoate in the treatment and suppression of malaria in the Gambia, West Africa. British Medical Journal 1966;1:695‐701. [DOI] [PMC free article] [PubMed] [Google Scholar]
Melik‐Adamian 1938 {published data only}
- Melik‐Adamian SS. Acriquine in the mass treatment of malarious children. Meditsinskaya Parazitologiya i Parazitarnye Bolezni 1938;7(2):178‐91. [Google Scholar]
Mendez Galvan 1984 {published data only}
- Mendez Galvan JF, Guerrero Alvarado J, Gonzalez Mora M, Perez Landa M, Quintero Cabanillas R. Evaluation of alternative scheme of treatment for malaria control. Salud Publica de Mexico 1984;26(6):561‐72. [PubMed] [Google Scholar]
Mercier 1953 {published data only}
- Mercier S. Epidemiologlcal and demographic results of malaria control in Tananarive in 1951. Revue du Paludisme et de Medicine Tropicale 1953;11(104):26‐36. [PubMed] [Google Scholar]
Merle 1955 {published data only}
- Merle F, Maillot L. [English title not available] [Problemas actuales del control y erradicacion de la malaria en America Latina]. Bulletin de la Societe de Pathologie Exotique 1955;48(2):242‐69. [PubMed] [Google Scholar]
Mezincesco 1935 {published data only}
- Mezincesco D, Cornelson DA. The prophylactic treatment of malaria with atebrin and with quinine. Archives Roumaines de Pathologie Experimentale et de Microbiologie 1935;8(4):449‐70. [Google Scholar]
Miller 1955 {published data only}
- Miller M. Suppression of malaria by monthly drug administration. The American Journal of Tropical Medicine and Hygiene 1955;4:790‐9. [DOI] [PubMed] [Google Scholar]
Monteny 1960 {published data only}
- Monteny VAR. Comparative efficacy of chloroquine and pyrimethamine as prophylactics against malaria. Annales de la Societe Belge de Medecine Tropicale 1960;40(3):511‐6. [PubMed] [Google Scholar]
Mühlens 1913 {published data only}
- MüHlens. Report of a malaria expedition to Jerusalem. Zentralblatt fur Bakteriologie, Parasitenkunde, Infektionskrankheiten und Hygiene 1913;69(1‐2):41‐85. [Google Scholar]
Nakibuuka 2009 {published data only}
- Nakibuuka V, Ndeezi G, Nakiboneka D, Ndugwa CM, Tumwine JK, Nakibuuka Victoria, et al. Presumptive treatment with sulphadoxine‐pyrimethamine versus weekly chloroquine for malaria prophylaxis in children with sickle cell anaemia in Uganda: a randomized controlled trial. Malaria Journal 2009;8:237. [DOI] [PMC free article] [PubMed] [Google Scholar]
Nankabirwa 2010 {published data only}
- Nankabirwa J, Cundill B, Clarke S, Kabatereine N, Rosenthal PJ, Dorsey G, et al. Efficacy, safety, and tolerability of three regimens for prevention of malaria: a randomized, placebo‐controlled trial in Ugandan schoolchildren. PLoS ONE [Electronic Resource] 2010;5(10):e13438. [DOI] [PMC free article] [PubMed] [Google Scholar]
Nave 1973 {published data only}
- Nave Rebollo O, Parada E, Guerra A. Malaria in El Salvador. Control and eradication campaign analysis. Revista del Instituto de Investigaciones Medicas 1973;2(1):31‐9, 3‐30. [Google Scholar]
Norman 1952 {published data only}
- Norman T. An investigation of the failure of proguanil prophylaxis. Transactions of the Royal Society of Tropical Medicine and Hygiene 1952;46(6):653‐5. [DOI] [PubMed] [Google Scholar]
Ntab 2007 {published data only}
- Ntab B, Cisse B, Boulanger D, Sokhna C, Targett G, Lines J, et al. Impact of intermittent preventive anti‐malarial treatment on the growth and nutritional status of preschool children in rural Senegal (west Africa). The American Journal of Tropical Medicine & Hygiene 2007;77(3):411‐7. [PMC free article] [PubMed] [Google Scholar]
Omer 1978 {published data only}
- Omer AHS. Species prevalence of malaria in northern and southern Sudan, and control by mass chemoprophylaxis. The American Journal of Tropical Medicine and Hygiene 1978;27(5):858‐63. [DOI] [PubMed] [Google Scholar]
Onori 1972 {published data only}
- Onori E, Onori E. Experience with mass drug administration as a supplementary attack measure in areas of vivax malaria. Bulletin of the World Health Organization 1972;47(5):543‐8. [PMC free article] [PubMed] [Google Scholar]
Ossi 1967 {published data only}
- Ossi GT. An epidemic in the life of a malaria eradication programme. Bulletin of Endemic Diseases 1967;9(1/4):5‐18. [PubMed] [Google Scholar]
Ouedraogo 2010 {published data only}
- Ouedraogo A, Tiono AB, Diarra A, Nebie IO, Konate AT, Sirima SB. The effects of a pre‐season treatment with effective antimalarials on subsequent malaria morbidity in under five‐year‐old children living in high and seasonal malaria transmission area of Burkina Faso. Tropical Medicine and International Health 2010;15(11):1315‐21. [DOI] [PubMed] [Google Scholar]
Parrot 1937 {published data only}
- Parrot L, Catanei A, Ambialet R. Comparative experiments in mass prophylaxis of malaria by means of quinine and of synthetic drugs (Quinacrine and Praequine). Bulletin Health Organisation (League of Nations) 1937;6(5):683‐765. [Google Scholar]
Parrot 1943 {published data only}
- Parrot L, Catanei A, Collignon E, Ambialet R. New trial of synthetic drugs for collective prophylaxis of malaria. Archives de l'Institut Pasteur d'Algerie 1943;21(3):131‐79. [Google Scholar]
Parrot 1944 {published data only}
- Parrot L, Catanei A, Collignon E. New trials of mass prophylaxis of malaria with synthetic drugs. Archives de l'Institut Pasteur d'Algerie 1944;22(3):179‐246. [Google Scholar]
Parrot 1946 {published data only}
- Parrot L, Catanei A, Collignon E. Further trials of mass prophylaxis of malaria with synthetic drugs. Archives de l'Institut Pasteur d'Algerie 1946;24(3/4):205‐78. [Google Scholar]
Peters 1962 {published data only}
- Peters W. A critical survey of the results of malaria‐eradication and control programmes in the south‐west Pacific. Annals of Tropical Medicine and Parasitology 1962;56(1):20‐32. [DOI] [PubMed] [Google Scholar]
Phillips 1954 {published data only}
- Phillips Mary G. Malaria prophylaxis. The British Medical Journal 1954;1(4854):155. [DOI] [PMC free article] [PubMed] [Google Scholar]
Pikul 1934 {published data only}
- Pikul J, Serguiev P, Tibourskaya N. Experiment on the prophylactic use of plasmocide in Daghestan with observations on the mosquito infection rate. Meditsinskaya Parazitologiya i Parazitarnye Bolezni 1934;3(4):322‐9. [Google Scholar]
Pribadi 1986 {published data only}
- Pribadi W, Muzaham F, Santoso T, Rasidi R, Rukmono B, Soeharto, et al. The implementation of community participation in the control of malaria in rural Tanjung Pinang, Indonesia. Southeast Asian Journal of Tropical Medicine & Public Health 1986;17(3):371‐8. [PubMed] [Google Scholar]
Prokopenko 1945 {published data only}
- Prokopenko LI. An analysis of the causes of the severe epidemic of malaria in 1942 in the Urgut district of the province of Samarkand and measures to prevent an increase in malaria morbidity in 1943. Medical Parasitology 1945;14(3):15‐33. [PubMed] [Google Scholar]
Rachou 1965 {published data only}
- Rachou RG, Lyons G, Moura‐Lima M, Kerr JA. Synoptic epidemiológical studies of Malaria in El Salvador. The American Journal of Tropical Medicine and Hygiene 1965;14(1):1‐62. [DOI] [PubMed] [Google Scholar]
Rafi 1951 {published data only}
- Rafi SM, Shah IA. Paludrine as a causal prophylactic in hyperendemic areas. Pakistan Journal of Health 1951;1(1):42‐6. [Google Scholar]
Ray 1948 {published data only}
- Ray AP. Prophylactic use of paludrine in a tea estate. Indian Journal of Malariology 1948;2:35‐66. [Google Scholar]
Robin 1946 {published data only}
- Robin C, Brochen L. Malaria in Dakar. Results of the therapeutic and prophylactic administration of synthetic drugs in a native population. Bulletin Medical de l'Afrique‐Occidentale Francaise 1946;3(1):97‐108. [Google Scholar]
Rodríguez 1994 {published data only}
- Rodríguez López MH, Loyola Elizondo EG, Betanzos Reyes AF, Villareal Treviño C, Nielsen Bown D. Control focal del paludismo: tratamiento focal usando quimioprofilaxis y rociado intradomiciliar con insecticida para el control del paludismo en el sur de México. Gaceta Medica De Mexico 1994;130(5):313‐9. [PubMed] [Google Scholar]
Rohner 2010 {published data only}
- Rohner F, Zimmermann MB, Amon RJ, Vounatsou P, Tschannen AB, N'Goran E K, et al. In a randomized controlled trial of iron fortification, anthelmintic treatment, and intermittent preventive treatment of malaria for anemia control in Ivorian children, only anthelmintic treatment shows modest benefit. Journal of Nutrition 2010;140(3):635‐41. [DOI] [PubMed] [Google Scholar]
Saarinen 1987 {published data only}
- Saarinen M, Iyambo N, Shinyafa L, Paajanen H, Indongo I, Thoren E, et al. Mass proguanil prophylaxis. The Lancet 1987;1(8539):985‐6. [DOI] [PubMed] [Google Scholar]
Salako 1990 {published data only}
- Salako LA, Ajayi FO, Sowunmi A, Walker O, Salako LA, Ajayi FO, et al. Malaria in Nigeria: a revisit. Annals of Tropical Medicine & Parasitology 1990;84(5):435‐45. [DOI] [PubMed] [Google Scholar]
Salihu 2000 {published data only}
- Salihu HM, Tchuinguem G, Ratard R. Effect of chloroquine prophylaxis on birthweight and malaria parasite load among pregnant women delivering in a regional hospital in Cameroon. The West Indian Medical Journal 2000;49(2):143‐7. [PubMed] [Google Scholar]
Santos 1993 {published data only}
- Santos JB, Prata A, Wanssa E. Quimioprofilaxia da malária com mefloquina na amazônia brasileira. Revista da Sociedade Brasileira de Medicina Tropical 1993;26(3):157‐62. [DOI] [PubMed] [Google Scholar]
Schliessmann 1973 {published data only}
- Schliessmann DJ, Joseph VR, Solis M, Carmichael GT. Drainage and larviciding for control of a malaria focus in Haiti. Mosquito News 1973;33(3):371‐8. [Google Scholar]
Schneider 1948a {published data only}
- Schneider J, Dignat M, Voron, Sfar M. Mass prophylaxis of malaria with premaline in the Gabes Area, May to November, 1946. Bulletin de la Societe de Pathologie Exotique 1948;41(3/4):104‐8. [Google Scholar]
Schneider 1948b {published data only}
- Schneider J, Larabi M, Balti M. Mass prophylaxis of Malaria with Nivaquine; Results of experience in Ghardimaou, Tunisia. Bulletin de la Societe de Pathologie Exotique 1948;41(3/4):188‐94. [Google Scholar]
Schneider 1958 {published data only}
- Schneider J, Languillon J, Delas A. Chloroquine‐pyrimethamine combination in the prophylaxis of Malaria. Results after 22 months of treatment [Association chloroquine‐pyrimethamine dans la chimioprophylaxie du paludisme resultats apres 22 mois de traitement ‐ 2e note]. Bulletin de la Societe de Pathologie Exotique 1958;51(3):316‐9. [PubMed] [Google Scholar]
Schneider 1962 {published data only}
- Schneider J, Escudie A, Ouedraogo A, Sales P. Chimoprophylaxie du paludisme par distributions hebdomadaires de chloroquine ou d'une association chloroquine‐primaquine‐pyrimethamine. Bulletin de la Societe de Pathologie Exotique 1962;2:280‐90. [PubMed] [Google Scholar]
Seckinger 1935 {published data only}
- Seckinger DL. Atabrine and plasmochin in the treatment and control of Malaria. American Journal of Tropical Medicine 1935;15(6):631‐49. [Google Scholar]
Sehgal 1968 {published data only}
- Sehgal JK. Progress of malaria eradication in Orissa State during 1965‐66. Bulletin of the Indian Society for Malaria and Other Communicable Diseases 1968;5(1‐2):88‐93. [Google Scholar]
Sergent 1913 {published data only}
- Sergent Edm, Sergent Et. [Etudes epidemiologiques et prophylactiques du paludisme: neuvieme et dixieme campagnes en Algerie, en 1910 et 1911]. Annales De l'Institut Pasteur 1912;27(5):373‐90. [Google Scholar]
Sesay 2011 {published data only}
- Sesay S, Milligan P, Touray E, Sowe M, Webb EL, Greenwood BM, et al. A trial of intermittent preventive treatment and home‐based management of malaria in a rural area of The Gambia. Malaria Journal 2011;10(2). [DOI] [PMC free article] [PubMed] [Google Scholar]
Shanks 1992 {published data only}
- Shanks GD, Edstien MD, Suriyamongkol V, Timsaad S, Webster HK. Malaria chemoprophylaxis using proguanil/dapsone combinations on the Thai‐Cambodian border. American Journal of Tropical Medicine and Hygiene 1992;46(6):643‐8. [DOI] [PubMed] [Google Scholar]
Shanks 1993 {published data only}
- Shanks GD, Edstien MD, Kereu RK, Spicer PE, Rieckmann KH. Postexposure administration of halofantrine for the prevention of malaria. Clinical Infectious Diseases 1993;17:628‐31. [DOI] [PubMed] [Google Scholar]
Shanks 1995a {published data only}
- Shanks GD, Roessler P. Doxycycline for malaria prophylaxis in Australian soldiers deployed to United Nations missions in Somalia and Cambodia. Military Medicine 1995;160(9):443‐5. [PubMed] [Google Scholar]
Shanks 1995b {published data only}
- Shanks DG, Barnett A, Edstein MD, Rieckmann KH. Effectiveness of doxycycline combined with primaquine for malaria prophylaxis. The Medical Journal of Australia 1995;162:306‐10. [DOI] [PubMed] [Google Scholar]
Sheinker 1945 {published data only}
- Sheinker KP. An experiment in epidemiological chemical Prophylaxis at a site of new construction in central Asia. Medical Parasitology 1945;14(4):56‐62. [Google Scholar]
Singh 1968 {published data only}
- Singh MV, Agarwala RS, Singh KN. Epidemiological study of focal outbreak of malaria in consolidation phase area and evaluation of remedial measures in Uttar Pradesh (India). Bulletin of the Indian Society for Malaria and Other Communicable Diseases 1968;5(1/2):207‐20. [Google Scholar]
Snowden 2006 {published data only}
- Snowden FM. Conquest of malaria: Italy, 1900‐1962. New Haven: Yale University Press, 2006. [Google Scholar]
Sokhna 2008 {published data only}
- Sokhna C, Cisse B, Ba el H, Milligan P, Hallett R, Sutherland C, et al. A trial of the efficacy, safety and impact on drug resistance of four drug regimens for seasonal intermittent preventive treatment for malaria in Senegalese children. PLoS ONE [Electronic Resource] 2008;3(1):e1471. [DOI] [PMC free article] [PubMed] [Google Scholar]
Sorel 1913 {published data only}
- Sorel F. Hygiene in Bassam in 1912. Bulletin de la Societe de Pathologie Exotique 1913;6(9):645‐53. [Google Scholar]
Srivastava 1950 {published data only}
- Srivastava R S. Malaria control measures in the Tarai area under the Tarai Colonization Scheme, KIchha, District Naini Tal : September 1947 to December 1948. First Report. Indian Journal of Malariology 1950;4(2):151‐65. [PubMed] [Google Scholar]
Strangeways‐Dixon 1950 {published data only}
- Strangeways Dixon D. Paludrine (Proguanil) as a malarial prophylactic amongst African labour in Kenya. The East African Medical Journal 1950;28:127‐30. [PubMed] [Google Scholar]
Strickland 1986 {published data only}
- Strickland GT, Khaliq AA, Sarwar M, Hassan H, Pervez M, Fox E. Effects of Fansidar on chloroquine‐resistant Plasmodium falciparum in Pakistan. The American Journal of Tropical Medicine and Hygiene 1986;35(1):61‐5. [DOI] [PubMed] [Google Scholar]
Swellengrebel 1931 {published data only}
- Swellengrebel NH. Report on investigation into malaria in the union of South Africa, 1930‐31. Journal of the Medical Association of South Africa 1931;5(13):409‐24. [Google Scholar]
Tagbor 2011 {published data only}
- Tagbor H, Cairns M, Nakwa E, Browne E, Sarkodie B, Counihan H, et al. The clinical impact of combining intermittent preventive treatment with home management of malaria in children aged below 5 years: cluster randomised trial. Tropical Medicine & International Health 2011;16(3):280‐9. [DOI] [PubMed] [Google Scholar]
Tine 2011 {published data only}
- Tine RCK, Faye B, Ndour CT, Ndiaye JL, Ndiaye M, Bassene C, Magnussen P, Bygbjerg IC, Sylla K, Ndour JD, Gaye O. Impact of combining intermittent preventive treatment with home management of malaria in children less than 10 years in a rural area of Senegal: a cluster randomized trial. Malaria Journal 2011;10:358. [DOI] [PMC free article] [PubMed] [Google Scholar]
Turner 1977 {published data only}
- Turner DA. A review of the malaria eradication programme in the Solomon Islands 1975‐1976. Papua New Guinea Medical Journal 1977;20(4):188‐97. [PubMed] [Google Scholar]
Usenbaev 2006 {published data only}
- Usenbaev NT, Ezhov MN, Zvantsov AB, Annarbaev A, Zhoroev AA, Almerekov KSh. An outbreak of Plasmodium vivax in malaria in Kyrghyzstan. Meditsinskaia Parazitologiia I Parazitarnye Bolezni 2006;1:17‐20. [PubMed] [Google Scholar]
Usenbaev 2008 {published data only}
- Usenbaev NT, Baranova AM, Anarbaev AA, Almerekov K. Experience in sanitizing an urban focus of vivax malaria (Tashkumyr, Kyrghyzstan). Meditsinskaia Parazitologiia I Parazitarnye Bolezni 2008;3:45‐6. [PubMed] [Google Scholar]
Van Dijk 1958 {published data only}
- Dijk WJOM. Mass chemoprophylaxis with chloroquine additional to DDT indoor spraying. Tropical and Geographical Medicine 1958;10(4):379‐84. [PubMed] [Google Scholar]
Van Goor 1950 {published data only}
- Goor WT, Lodens JG. Clinical malaria prophylaxis with proguanil. Documenta Neerlandica et Indonesica de Morbis Tropicis 1950;2(1):62‐81. [Google Scholar]
Verhoef 2002 {published data only}
- Verhoef H, West CE, Nzyuko SM, Vogel S, Valk R, Wanga MA, et al. Intermittent administration of iron and sulfadoxine‐pyrimethamine to control anaemia in Kenyan children: a randomised controlled trial.[Erratum appears in Lancet 2002 Oct 19;360(9341):1256]. Lancet 2002;360(9337):908‐14. [DOI] [PubMed] [Google Scholar]
Villegas 2010 {published data only}
- Villegas L, Cairo H, Huur A, Vinisi H, Pereira H, Jozuazoon N, et al. Mass screening and treatment for malaria among gold miners in Suriname. International Journal of Infectious Diseases 2010;14:e435. [Google Scholar]
Wallace 1936 {published data only}
- Wallace RB. Mass treatment with atebrin and plasmochin simplex, 1933. Malayan Medical Journal 1934;9(1):33‐7. [Google Scholar]
- Wallace RB. The control of malaria on estates by mass treatment with atebrin. Malayan Medical Journal 1936;11(4):187‐213. [Google Scholar]
Wallace 1954 {published data only}
- Wallace MF. Resochin; single dose therapy and mass suppression. The Medical Journal of Malaya 1954;8(3):251‐9. [PubMed] [Google Scholar]
Watkins 1987 {published data only}
- Watkins WM, Oloo AJ, Gilles HM, Brandling‐Bennett AD, Howells RE, Koech DK. Inadequacy of chloroproguanil 20 mg per week as chemoprophylaxis for falciparum malaria in Kenya. The Lancet 1987;1(8525):125‐8. [DOI] [PubMed] [Google Scholar]
White 1934 {published data only}
- White R Senior, Adhikari A K. Anti‐gametoeyte treatment combined with anti‐larval malaria control. Records of the Malaria Survey of India 1934;4(2):77‐94. [Google Scholar]
White 1937 {published data only}
- White R Senior, Adhikari A K. Anti‐gametocyte treatment combined with anti‐larval malaria control. Part II. Records of the Malaria Survey of India 1937;7(4):221‐31. [Google Scholar]
Winter 1934 {published data only}
- Winter HG. Malaria control in Bengal. Journal of the Royal Army Medical Corps 1934;63(4):238‐46. [Google Scholar]
Wone 1967 {published data only}
- Wone I, Michel R. Bilan de la chimioprophylaxie systematique par chloroquine au Senegal, 1963‐1966. Medecine d'Afrique Noire 1967;14(6):249‐322. [Google Scholar]
Yip 1998 {published data only}
- Yip K, Yip K. Antimalarial work in China: a historical perspective. Parasitologia 1998;40(1‐2):29‐38. [PubMed] [Google Scholar]
Additional references
Edwards 2000
- Edwards IR, Aronson JK. Adverse drug reactions: definitions, diagnosis, and management. The Lancet Oct 7 2000;356(9237):1255‐9. [DOI] [PubMed] [Google Scholar]
Feachem 2009
- Feachem RGA, Philips AA, Targett GA (eds). Shrinking the Malaria Map: A Prospectus on Malaria Elimination. The Global Health Group, Global Health Sciences, University of California, San Francisco 2009.
Greenwood 2004
- Greenwood B. The use of anti‐malarial drugs to prevent malaria in the population of malaria‐endemic areas. American Journal of Tropical Medicine and Hygiene 2004;70(1):1‐7. [PubMed] [Google Scholar]
Hay 2008
- Hay SI, Smith DL, Snow RW. Measuring malaria endemicity from intense to interrupted transmission. Lancet Infectious Diseases 2008;8(6):9–378. [DOI] [PMC free article] [PubMed] [Google Scholar]
Higgins 2011
- Higgins JPT, Green S (editors). Cochrane Handbook of Systematic Reviews of Interventions Version 5.1.0. The Cochrane Collaboration. The Cochrane, 2011.
Hotez 2009
- Hotez PJ. Mass drug administration and integrated control for the world's high‐prevalence neglected tropical diseases. Clinical Pharmacology & Therapeutics 2009;85(6):659‐64. [DOI] [PubMed] [Google Scholar]
Maude 2012
- Maude RJ, Socheat D, Nguon C, Saroth P, Dara P, Li G, et al. Optimising strategies for Plasmodium falciparum malaria elimination in Cambodia: primaquine, mass drug administration and artemisinin resistance. PloS One 2012;7(5):e37166. [DOI] [PMC free article] [PubMed] [Google Scholar]
Okell 2011
- Okell LC, Griffin JT, Kleinschmidt I, Hollingsworth TD, Churcher TS, White MJ, et al. The potential contribution of mass treatment to the control of Plasmodium falciparum malaria. PLoS ONE 2011;6(5):1‐11. [DOI] [PMC free article] [PubMed] [Google Scholar]
Shanks 2012
- Shanks GD. Control and elimination of Plasmodium vivax.. Advances in Parasitology 2012;80:301‐41. [DOI] [PubMed] [Google Scholar]
von Seidlein 2003
- Seidlein L, Greenwood BM. Mass administration of antimalaria drugs. Trends in Parasitology 2003;19(10):452‐60. [DOI] [PubMed] [Google Scholar]
WHO 1951
- World Health Organization. Report on the malaria conference in equatorial Africa, technical report series, No. 38. World Health Organization 1951; Vol. 8, issue 7:1‐72. [PubMed]
WHO 1963
- World Health Organization. Annex VII: Indications and dosages of antimalarial drugs in pre‐eradication programmes and in malaria eradication programmes. World Health Organization 1963; Vol. WHO/Mal/376‐AFR/Mal/9/62.
WHO 2007
- World Health Organization. Malaria Elimination: A field manual for low and moderate endemic countries. World Health Organization 2007.
WHO 2010
- World Health Organization. Guidelines for the treatment of malaria ‐ 2nd Edition. World Health Organization 2010. [PubMed]
WHO 2012
- World Health Organization. World Malaria Report 2012. World Health Organization 2012.