

Abstract
Immune cells may take part in the renin–angiotensin–aldosterone system (RAAS), which plays a pivotal role in the regulation of vascular tone and blood pressure. The aim of the study was to analyse the expression and activity of angiotensin-converting enzyme type 1 (ACE1) and ACE2 in human monocytes (MO) and their subsets. The highest relative level of ACE1-, as well as ACE2-mRNA expression, was observed in CD14++CD16− (classical) MO. Moreover, in these cells, mean level of ACE2-mRNA was almost two times higher than that of ACE1-mRNA (11.48 versus 7.073 relative units, respectively). In peripheral blood mononuclear cells (PBMC), MO and classical MO, ACE1 and ACE2 protein expression was stronger compared to other MO subpopulations. The highest level of Ang II generated from Ang I in vitro was observed in classical MO. In this setting, generation of Ang-(1–9) by PBMC and classical MO was higher when compared to the whole MO population (P < 0·05). The generation rate of vasoprotective Ang-(1–7) was comparable in all analysed cell populations. However, in CD14+CD16++ (non-classical) MO, formation of Ang-(1–7) was significantly greater than Ang II (P < 0·001). We suggest that in physiological conditions MO (but also lymphocytes forming the rest of PBMC pool) may be involved in the regulation of vessel wall homeostasis via the RAAS-related mechanisms. Moreover, non-classical MO, which are associated preferentially with the vascular endothelium, express the vasoprotective phenotype.
Keywords: angiotensin, angiotensin-converting enzymes, monocyte subpopulations, renin–angiotensin–aldosterone system
Introduction
The most important part of the regulatory mechanism implicated in the control of blood vessel tone, and therefore regulation of blood pressure level, includes the renin–angiotensin–aldosterone system (RAAS). In the classical view this includes renin, which cleaves angiotensinogen to angiotensin I (Ang I) and the angiotensin-converting enzyme type 1 (ACE1), which turns Ang I into highly vasoconstrictive, proinflammatory and pro-remodelling angiotensin II (Ang II). Ang II exerts its pressor action via type 1 receptor (AT1). However, other types of receptors to Ang II (such as type 2 receptor responsible for vasodilatation – AT2) and also angiotensins produced by alternative cleavage pathways, namely by ACE2, and including angiotensins 1–9 and 1–7 [Ang-(1–9) and Ang-(1–7), respectively], have been discovered. Importantly, they may activate other signalling pathways (Fig. 1), such as the Ang-(1–7)/Mas-1 axis 1, which counterbalances the activity of Ang II/AT1. Importantly, because of intensive local formation, the actions of ‘non-classical’ angiotensins could be especially important in the paracrine regulation of tissue physiology. Basically, the complex regulation of blood pressure consists of multiple overlapping mechanisms, systemic–neurogenic and endocrine and local paracrine, acting within the vessel wall. This was suggested intuitively by Irving Page almost 70 years ago in his regulatory mosaic theory of hypertension 2. Thus, RAAS may play a role in the regulation of blood pressure not only in a systemic endocrine manner, but also by local actions of various angiotensins (renin–angiotensin system; RAS) on vessel wall homeostasis 1.
Figure 1.
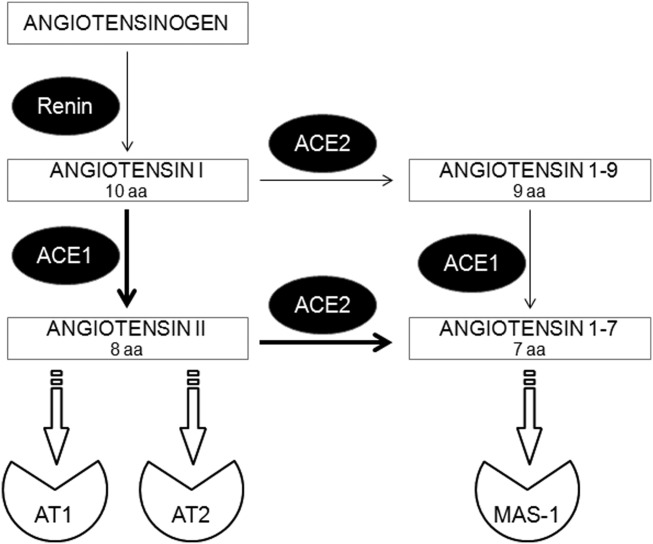
Simplified scheme of the rennin–angiotensin system (RAS). Angiotensin (Ang)II, -(1–9), and -(1–7) derived by C-terminal cleavage of their particular antecessors by angiotensin converting enzyme (ACE)1 or ACE2. ACE1/2 = angiotensin-converting enzyme type 1 or type 2; AT1/2 = angiotensin II receptor type 1 or type 2; MAS-1 = Mas oncogene, receptor for Ang-(1–7); aa = amino acids.
During the past decade, a number of animal studies reported that the immune system, capable of interacting with both blood components and the surrounding tissue, may be implicated in the pathogenesis of hypertension 3. Initial reports concentrated on the possible role of murine T lymphocytes 4–6. Nonetheless, it was suggested that human monocytes (MO) and macrophages may play a role in the RAS-dependent regulation of vascular responses 7,8. The highest level of ACE1 (CD143) expression was observed in the so-called intermediate subpopulation of MO in dialyzed patients with chronic kidney disease, which was significantly higher in those with severe atherosclerosis, compared with those with little or no carotid atherosclerosis. Moreover, the authors suggested that monocytic ACE1 may be a component of a local angiotensin-converting system, e.g. at sites that may be infiltrated by monocytes/macrophages 9,10.
Human MO can be subdivided into three main subpopulations: CD14++CD16− (classical), CD14++CD16+ (intermediate) and CD14+CD16++ (non-classical). Under physiological conditions, classical MO account for 70–80% and non-classical for up to 10% of the circulating MO pool 11–13. In contrast to classical MO, the intermediate and non-classical subsets (related to each other and named collectively as CD16+ MO) produce mainly proinflammatory cytokines and have been reported to increase in numbers in various inflammatory diseases 11. Both MO subpopulations forming the CD16+ pool are ‘programmed’ for slightly different functions compared to the classical ones 14. It is noteworthy that the CD16+ MO are located in the close vicinity of the endothelium and may potentially affect vascular homeostasis. It has been demonstrated that hypertension is associated with activation of MO and an increased endothelial adhesion and subendothelial accumulation of MO, with their increased capacity to produce cytokines 15,16.
Until now, few data have been available concerning the possible role of MO and their subsets in physiological RAS activity within blood vessels in humans. Therefore, we investigated the expression of ACE1 and ACE2 (on mRNA and protein levels), as well as the angiotensin-converting ability of the sorted subpopulations of human circulating MO obtained from healthy blood donors. We aimed to establish finally: (1) whether the MO are capable of converting Ang I to Ang II or Ang-(1–9)/(1–7); and (2) whether such activity is homogeneous across the variety of MO subsets.
Materials and methods
MO elutriation
Human peripheral blood mononuclear cells (PBMC) were isolated for each particular experiment from 250 ml of heparinized blood of healthy donors (without hypertension or any signs of acute or chronic inflammatory disorders) by standard Ficoll/Isopaque (Pharmacia, Uppsala, Sweden) density gradient centrifugation. MO were separated from mononuclear cells by counterflow centrifugal elutriation using the JE-6.B elutriation system equipped with a 5-ml Sanderson separation chamber (Beckman, Palo Alto, CA, USA), as described previously 17. MO were suspended in RPMI-1640 culture medium supplemented with L-glutamine and gentamycin (25 μg/ml) (Sigma, St Louis, MO, USA). Experiments were accepted by the local bioethical committee at the Jagiellonian University (KBET/6/B/2012).
MO subpopulation sorting
The CD14++CD16−, CD14++CD16+ and CD14+CD16++ MO subpopulations were isolated from elutriated MO by cell sorting with the use of a fluorescence activated cell sorter (FACS)Aria II cell sorter (BD Biosciences Immunocytometry Systems, San Jose, CA, USA). MO were labelled using CD14-fluorescein isothiocyanate (FITC) (clone MØP9) and CD16-phycoerythrin (PE) (clone Leu-11c) monoclonal antibodies (mAbs; BD Biosciences Pharmingen, San Diego, CA, USA). Sorted cells were collected into tubes precoated with fetal bovine serum to avoid plastic charging and cell attachment to the wall. The purity of sorted cells was checked by flow cytometry and was approximately 97–98%. The gating strategy of MO subpopulations is presented in the Supporting information, Fig. S1.
Expression of ACEs mRNA in PBMC and MO
Expression of ACE1 and ACE2 mRNA was determined by real-time polymerase chain reaction (PCR) assay. First, the total RNA was extracted from samples of PBMC, whole elutriated and dummy-sorted MO and three sorted MO subpopulations using the Rneasy Protect Mini Kit (Qiagen GmbH, Hilden, Germany), according to the manufacturer's protocol. Subsequently, first-strand cDNA was obtained from the RNA samples using enhanced avian reverse transcriptase (eAMV RT) (Sigma-Aldrich, St Louis, MO, USA) and oligo(dT)23 primer (Sigma-Aldrich), as specified by the manufacturer's protocol. The quantitative PCR for ACE1 and ACE2 was performed using the LightCycler II System (Roche Diagnostics, Mannheim, Germany). The mRNA expression level for all samples was normalized to the housekeeping gene β-actin. A reaction mixture contained FastStart DNA SYBR Green Master I Reaction Mix (Roche Biochemicals, Mannheim, Germany), PCR Master Mix, cDNA template, and the following primers: 5′-ATG AAG ACC TGT TAT GGG CAT GG-3′ (sense) and 5′-ATT TCG GGT AAA ACT GGA GGA TGG-3′ (anti-sense) for ACE1, 5′-CTG CTC ATT TGC TTG GTG AT-3′ (sense) and 5′-GGT CCA CCA TTG CAT CAG TA-3′ (anti-sense) for ACE2, 5′-GGA TGC AGA AGG AGA TCA CTG-3′ (sense) and 5′-CGA TCC ACA CGG AGT ACT TG-3′ (anti-sense) for β-actin. Each LightCycler PCR run consisted of 40 cycles, with an initial denaturation time of 10 min at 95 °C. The cycling profile for ACE1 and ACE2 was set at 95 °C for 10 s, 64 °C for 30 s and 72 °C for 40 s; and for β-actin, 95 °C for 10 s and 60 °C for 60 s. The fluorescent signals generated during the informative log-linear phase were used to calculate the relative amount of mRNA. The specificity of the amplified products was verified in each case by the melting curve analysis. An example of melting curves is presented in the Supporting information, Fig. S2. Gene expression was analysed using the 2-ΔΔCt method, where ΔC = Ct of target genes-Ct of endogenous control gene (β-actin). The enzyme mRNA expression was presented as relative units and indicated as a fold difference from the PBMC samples.
Western blot analysis
Isolated PBMC, dummy-sorted MO and sorted MO subsets of particular subpopulations were lysed in M-PER lysing buffer (Pierce, Rockford, IL, USA), containing a protease inhibitor cocktail (Roche, Mannheim, Germany). The protein concentration was measured on a micro-volume spectrophotometer Q5000 (Quawell Technology, San Jose, CA, USA) using Bradford dye reagent (Bio-Rad, Hercules, CA, USA) and bovine gammaglobulin (Bio-Rad), used as a protein concentration standard. Twenty µg of isolated protein of each sample was mingled with NuPAGE LDS sample buffer (×4) (Life Technologies, Carlsbad, CA, USA) and NuPAGE sample reducing agent (×10) (Life Technologies). Samples were heated (70 °C, 10 min) and electrophoresed in 12% polyacrylamide gel containing sodium dodecyl sulphide (SDS). Next, electrophoresed proteins were transferred to the polyvinylidene fluoride membrane (Bio-Rad). Then, after blocking for 1 h at room temperature in Tris-buffered saline (TBS) with 0.1% Tween-20 (Sigma) and 1% bovine serum albumin (BSA; Sigma), the membranes were incubated overnight at 4 °C with monoclonal antibodies (dilution 1 : 1000): rabbit anti-ACE1 clone H-175 and rabbit anti-ACE2 clone H-170 (both Santa Cruz Biotechnology, Santa Cruz, CA, USA). As a loading control, rabbit anti-glyceraldehyde 3-phosphate dehydrogenase (GAPDH) antibodies (Cell Signaling, Beverly, MA, USA) were used. After overnight incubation, membranes were washed in TBS supplemented with BSA and Tween-20 and incubated (1 h) at room temperature with secondary goat anti-rabbit antibodies (dilution 1 : 4000), conjugated with horseradish peroxidase (Santa Cruz Biotechnology). The protein bands were visualized with the SuperSignal West Pico chemiluminescence substrate kit, as recommended by the manufacturer (Pierce, Rockford, IL, USA), and analysed with the Kodak Gel Logic 1500 digital imaging system (Kodak, Rochester, NY, USA).
Ang I conversion test
PBMC, dummy-sorted MO and sorted MO subsets (15 × 104 cells/well) were suspended in 190 μl of pure phosphate-buffered saline (PBS) and plated in round-bottomed culture plates immediately after the isolation procedure. After 10 min of incubation in PBS in room temperature, Ang I (Bachem AG, Bubendorf, Switzerland) was added (10 μl, final concentration 1 μM) and the samples were incubated for another 20 min at 37 °C. Then, samples were centrifuged (5 min, 250 g) and 150 μl of supernatant was removed and frozen at −80 °C until mass spectrometry analysis. Based on our previous experiments in different cell types, 1 μM Ang I concentration guarantees the constant supply of the primary substrate to the system during the 20-min conversion experiment 18,19.
Sample preparation and LC-MS/MS quantitation of Ang peptides
Liquid chromatography–mass spectrometry (LC-MS) measurements of angiotensin metabolites were performed as described previously 18, with the modification of the ion detection approach. First, samples were purified and concentrated using Ultra-Micro Spin C-18 column (Harvard Apparatus, Holliston, MA, USA). Spin columns C18 resin was activated by 0·1% trifluoroacetic acid (TFA) in 80% acetonitrile (ACN) by centrifugation at 1000 g for 30 s, followed by 0·1% TFA centrifugation as described above. Then, each sample was acidified (pH < 2·8), applied on the column and centrifuged (30 s, 1000 g). Next, the columns were washed with 0·1% TFA by centrifugation as described above. Ang peptides were then eluted by centrifugation with 0.1% TFA in 40% ACN. Finally, the samples were lyophilized overnight. The dry remainders were reconstituted in 0·1% TFA for LC-MS/MS analysis. Samples for calibration curves of each of the examined peptides (mixture of standards) were prepared in the same mode as above.
Separation of Ang peptides was performed on a reverse-phase, high-performance liquid chromatography (HPLC) system Ultimate 3000 (Dionex, Sunnyvale, CA, USA). The column used for separation was the Acclaim PepMap 100 C18 column (75 μm ID × 25 cm; 5 μm particle size) with a trap column (300 μm ID × 5 mm; 5 μm particle size) working at a flow rate of 300 nl/min. The chromatographic A phase was 0·1% formic acid (FA) in 2% ACN, while the B phase was 0·1% FA in 80% ACN. Peptides were separated in 30 min 10–50% B phase linear gradient. Mass spectrometric detection was performed using a LCQ Ion-Trap Mass Spectrometer (Finnigan, San Jose, CA, USA). For Ang peptide detection, selected reaction monitoring (SRM) mode (turbo scan rate) was used, with transitions set at 450·32–392·80 Da for Ang-(1–7), 395·57–356·98 Da for Ang-(1–9) and 524·04–784·38 Da for Ang II, respectively (see Supporting information, Fig. S3 for transitions assay details). The acquired data were analysed by Xcalibur software, version 2.0. Concentrations of Ang peptides were calculated using the standard calibration curves, constructed by linear regression analysis plotting of peak area versus peptide concentration. Calibration curves were prepared for each examined peptide at a concentration range of 2·5–250 pg/μl.
Statistical analysis
Comparison between samples was performed with GraphPad prism software (San Diego, CA, USA) using one-way analysis of variance (anova) analysis. Statistical significance was accepted when P < 0·05.
Results
ACE1 and ACE2 mRNA expression in MO subpopulations
The highest relative level of ACE1- as well as ACE2-mRNA expression was observed in the classical MO subset (CD14++CD16− cells), which reached statistical significance (P < 0·05) when compared to CD14++CD16+ (intermediate), CD14+CD16++ (non-classical) cells and the whole PBMC population (Fig. 2). Furthermore, the relative level of ACE2-mRNA in classical MO was almost twofold higher when compared to ACE1-mRNA (11·48 and 7·073 relative units, respectively).
Figure 2.
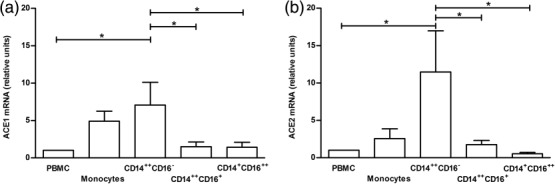
Expression level of angiotensin converting enzyme (ACE)1- (a) and ACE2-mRNA (b) in analysed cell subsets. The mRNA expression was analysed using the 2-ΔΔCt method and presented as a fold difference of each sample compared to peripheral blood mononuclear cells (PBMC). Data represent the mean values ± standard error of the mean (s.e.m.) of 12 independent experiments. *P < 0·05; **P < 0·001.
ACE1 and ACE2 protein expression in MO subpopulations
Western blot experiments showed that ACE1 expression was slightly more diverse than ACE2 levels, observed in parallel in the studied cell populations (Fig. 3). In PBMC, MO and CD14++CD16− (classical) cells ACE1 and ACE2 protein expression was greater compared to the other two MO subpopulations.
Figure 3.
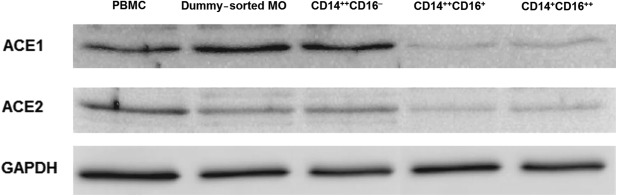
Angiotensin-converting enzyme (ACE)1 and ACE2 protein expression analysed by the Western blotting method. Monochrome images show representative ACE1 and ACE2 protein immunoblots obtained from particular cell subsets. One representative experiment of four performed is presented.
Conversion of Ang I into Ang II, Ang-(1–9) and Ang-(1–7) by cells of particular MO subpopulations
The significantly (P < 0·05) highest level of Ang II was observed after conversion of Ang I by sorted CD14++CD16− (classical) MO (Fig. 4a), when compared to PBMC and other MO subpopulations. Generation of Ang-(1–9) was significantly (P < 0·05) higher by PBMC and CD14++CD16− (classical) MO subsets when compared with the whole MO population (Fig. 4b). The level of converted Ang-(1–7) was comparable in all analysed cell populations (Fig. 4c). The levels of Ang-(1–9) and Ang-(1–7) converted by PBMC (on Fig. 4b,c, respectively) were approximately two times higher (P < 0·05) in comparison to Ang II (on Fig. 4a). Across the MO subpopulations, from classical through intermediate to non-classical, we found an increasing ratio of mean values of Ang-(1–7) to Ang II: from 0·93, trough 1·24 to 2·03, respectively (P = 0.0296) (Fig. 4d). Hence, in the non-classical MO the average level of converted Ang-(1–7) was two times as high as the level of Ang II (P = 0·0079).
Figure 4.
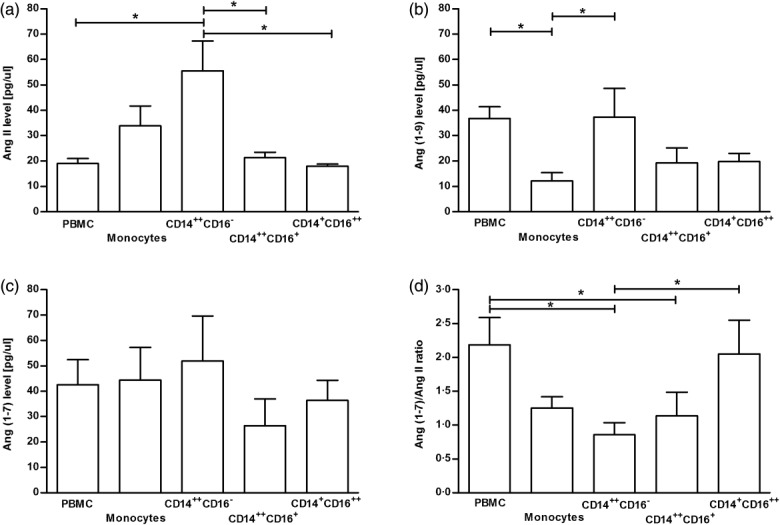
Mean values of the concentration of angiotensin (Ang) II (a), Ang (1–9) (b) and Ang (1–7) (c) in the samples of: peripheral blood mononuclear cells (PBMC), dummy sorted whole monocyte (MO) population and three sorted particular MO subsets, measured using reversed-phase, high-performance liquid chromatography. The ratio of Ang-(1–7)/Ang II of the same cell populations is presented (d). Data represent the mean values ± standard error of the mean (s.e.m.) of five independent experiments. *P < 0·05; **P < 0·001.
Discussion
In this study we show for the first time that human MO obtained from healthy donors have the ability to metabolize Ang I to multiple Ang peptides efficiently and that this feature, in general, decreases in particular subpopulations, from classical through intermediate to non-classical. This effect was striking for Ang II generation. The expression of ACE2 protein and conversion of Ang I to Ang-(1–7) also decreased in non-classical MO, but to a relatively lesser extent. This means that the non-classical MO are able to produce significantly less Ang II than Ang-(1–7) out of Ang I (P < 0·001) (Fig. 4d). Among the PBMC the classical circulating MO, which generate angiotensins to a relatively higher degree than the other MO subpopulations, may constitute a part of the blood RAS. Interestingly, the ability to generate Ang II is attenuated significantly as the MO turn from classical through intermediate to the non-classical, which mainly constitute the subendothelial fraction of MO 12. This may be viewed as a mechanism protecting the vessel walls from overexposure to such powerful vasoconstrictive and proinflammatory compounds as Ang II, especially at the inflammation site. However, whether the relatively higher propensity to produce Ang-(1–7) than Ang II displayed by the non-classical MO plays a role in vascular biology remains to be elucidated. Some discrepancy was observed between relatively low ACE1 and ACE2 expression (at mRNA and protein level), but substantial conversion activity of intermediate and non-classical MO was still retained. It is noteworthy that similar discrepancies between mRNA and protein levels, also regarding ACE, have been reported previously in various settings 20,21.
Intriguingly, our data suggest that among the PBMC, the MO are mainly responsible for the Ang II production, whereas the formation of Ang-(1–7) could be attributed not only to MO but also to other mononuclear cells. Indeed, our preliminary results show that lymphocytes may also be a rich source of Ang-(1–7) as a main metabolite of Ang I (data not shown).
The question arises as to whether changes in the number of particular MO subsets (e.g. significant increase of the non-classical in sepsis and viral infections or profound decrease during corticosteroid therapy) 22–25 and their activation state can influence vascular tone. MO are bone marrow-derived cells that circulate in the blood for 1–3 days, and during this time undergo a process of maturation (from classical through intermediate towards non-classical), which is regulated mainly by MO colony-stimulating factor (M-CSF/CSF-1), released, among others, by endothelial cells 26. They may enter various tissues and develop into different types of macrophages. Therefore, the next question is to what extent tissue macrophages originating from particular subsets of circulating blood MO retain their angiotensin-converting abilities and whether it is physiologically relevant, e.g. in the case of perivascular fat tissue or atherosclerotic plaque macrophages. In fact, it was shown that freshly isolated MO contain relatively low ACE1 activity and this increases significantly during their differentiation in vitro into macrophages 7. Interestingly, it was established recently in the mouse model that MO with a proinflammatory phenotype infiltrating into the vascular wall seem to be essential (macrophages rather than neutrophils) for Ang II-induced vascular dysfunction and arterial hypertension 27. Taking into account our data, these results should be considered with caution, because observations on functions of particular subpopulations of MO in rodents cannot be simply extrapolated to the human MO, especially referring to non-classical MO 28. Summarizing, our data show that among MO, classical ones are endowed with a well-balanced ability to produce Ang II versus Ang-(1–9/1–7), whereas non-classical ones tend to be a significant source of vasodilatory/vasoprotective Ang-(1–7). Therefore, the putative contribution of intermediate and non-classical MO to vasoconstriction seems to be limited in physiological settings. Our study was designed for the global assessment of complicated RAS performance in monocyte subtypes ex vivo, thus elaborate further studies with comprehensive assessment of Ang II and Ang-(1–7) formation and degradation in the presence of specific enzymatic inhibitors would be helpful to identify the activities of particular enzymes involved in the Ang I metabolism in monocyte subsets. The observations presented here open the way for research into the role of MO and their subpopulations, but also the other cells forming pool of circulating PBMC, in the regulation of vasculature tone in physiological, as well as in pathological (e.g. hypertension, sepsis/septic shock, atherosclerosis) settings or prolonged therapy with corticosteroids.
Acknowledgments
This study was supported by the Jagiellonian University Medical College (grant no. K/ZDS/002905). We thank Mariola Ożóg for her technical assistance.
Author contributions
M. R.-Z. and M. S. performed PCR experiments and LC-MS/MS quantitation of Ang peptides, analysed data and edited the manuscript. R. S. sorted monocyte subpopulations, M. L. performed Ang I conversion tests, K. W. performed Western blot analysis, R. O. performed LC-MS/MS quantitation of Ang peptides and edited the manuscript. T.G. and M. S. assisted with analysis of the results. J. G. and M. S. developed the scientific concept of the research, supervised the project, analysed results and edited the manuscript.
Disclosures
The authors declare no conflicts of interest.
Supporting Information
Additional Supporting Information may be found in the online version of this article.
Fig. S1. Elutriated monocytes were stained for CD14 and CD16 antigens, gated (P1) on the scatterplot (a) and then particular subpopulations of human monocytes (MO) from the P1 gate were defined (b) according to CD14 and CD16 expression, and sorted.
Fig. S2. An exemplary melting curve analysis diagram of an amplified product for angiotensin-converting enzyme type 1 (ACE1) mRNA expression; 1 = amplified product; 2 = negative control.
Fig. S3. Single reaction monitoring (SRM) assay. For each of the peptide, the full scan (upper) is followed by a corresponding fragmentation tandem mass spectrometry (MS/MS) scan (lower). Transitions used in the transition set-ups for (a) Ang 1-7, (b) Ang 1-9 and (c) Ang II, respectively, are highlighted (frame).
References
- Fyhrquist F, Saijonmaa O. Renin-angiotensin system revisited. J Intern Med. 2008;264:224–36. doi: 10.1111/j.1365-2796.2008.01981.x. [DOI] [PMC free article] [PubMed] [Google Scholar]
- Page IH. The mosaic theory of arterial hypertension – its interpretation. Perspect Biol Med. 1967;10:325–33. doi: 10.1353/pbm.1967.0031. [DOI] [PubMed] [Google Scholar]
- Harrison DG, Guzik TJ, Lob HE, et al. Inflammation, immunity, and hypertension. Hypertension. 2011;57:132–40. doi: 10.1161/HYPERTENSIONAHA.110.163576. [DOI] [PMC free article] [PubMed] [Google Scholar]
- Guzik TJ, Hoch NE, Brown KA, et al. Role of the T cell in the genesis of angiotensin II induced hypertension and vascular dysfunction. J Exp Med. 2007;204:2449–60. doi: 10.1084/jem.20070657. [DOI] [PMC free article] [PubMed] [Google Scholar]
- Hoch NE, Guzik TJ, Chen W, et al. Regulation of T-cell function by endogenously produced angiotensin II. Am J Physiol Regul Integr Comp Physiol. 2009;296:R208–16. doi: 10.1152/ajpregu.90521.2008. [DOI] [PMC free article] [PubMed] [Google Scholar]
- Harrison DG, Marvar PJ, Titze JM. Vascular inflammatory cells in hypertension. Front Physiol. 2012;3:128. doi: 10.3389/fphys.2012.00128. [DOI] [PMC free article] [PubMed] [Google Scholar]
- Costerousse O, Allegrini J, Lopez M, Alhenc-Gelas F. Angiotensin I-converting enzyme in human circulating mononuclear cells: genetic polymorphism of expression in T-lymphocytes. Biochem J. 1993;290:33–40. doi: 10.1042/bj2900033. [DOI] [PMC free article] [PubMed] [Google Scholar]
- Keidar S, Strizevsky A, Raz A, Gamliel-Lazarovich A. ACE2 activity is increased in monocyte-derived macrophages from prehypertensive subjects. Nephrol Dial Transplant. 2007;22:597–601. doi: 10.1093/ndt/gfl632. [DOI] [PubMed] [Google Scholar]
- Ulrich C, Seibert E, Heine GH, Fliser D, Girndt M. Monocyte angiotensin converting enzyme expression may be associated with atherosclerosis rather than arteriosclerosis in hemodialysis patients. Clin J Am Soc Nephrol. 2011;6:505–11. doi: 10.2215/CJN.06870810. [DOI] [PMC free article] [PubMed] [Google Scholar]
- Ulrich C, Heine GH, Seibert E, Fliser D, Girndt M. Circulating monocyte subpopulations with high expression of angiotensin-converting enzyme predict mortality in patients with end-stage renal disease. Nephrol Dial Transplant. 2010;25:2265–72. doi: 10.1093/ndt/gfq012. . [CrossRef] [DOI] [PubMed] [Google Scholar]
- Wong KL, Yeap WH, Tai JJ, Ong SM, Dang TM, Wong SC. The three human monocyte subsets: implications for health and disease. Immunol Res. 2012;53:41–57. doi: 10.1007/s12026-012-8297-3. [DOI] [PubMed] [Google Scholar]
- Ziegler-Heitbrock L. The CD14+ CD16+ blood monocytes: their role in infection and inflammation. J Leukoc Biol. 2007;81:584–92. doi: 10.1189/jlb.0806510. [DOI] [PubMed] [Google Scholar]
- Ziegler-Heitbrock L, Hofer TP. Toward a refined definition of monocyte subsets. Front Immunol. 2013;4:23. doi: 10.3389/fimmu.2013.00023. [DOI] [PMC free article] [PubMed] [Google Scholar]
- Frankenberger M, Hofer TP, Marei A, et al. Transcript profiling of CD16-positive monocytes reveals a unique molecular fingerprint. Eur J Immunol. 2012;42:957–74. doi: 10.1002/eji.201141907. [DOI] [PubMed] [Google Scholar]
- Liu Y, Liu T, McCarron RM, et al. Evidence for activation of endothelium and monocytes in hypertensive rats. Am J Physiol. 1996;270:H2125–31. doi: 10.1152/ajpheart.1996.270.6.H2125. [DOI] [PubMed] [Google Scholar]
- Dörffel Y, Lätsch C, Stuhlmüller B, et al. Preactivated peripheral blood monocytes in patients with essential hypertension. Hypertension. 1999;34:113–7. doi: 10.1161/01.hyp.34.1.113. [DOI] [PubMed] [Google Scholar]
- Baran J, Guzik K, Hryniewicz W, Ernst M, Flad HD, Pryjma J. Apoptosis of monocytes and prolonged survival of granulocytes as a result of phagocytosis of bacteria. Infect Immun. 1996;64:4242–6. doi: 10.1128/iai.64.10.4242-4248.1996. [DOI] [PMC free article] [PubMed] [Google Scholar]
- Suski M, Gebska A, Olszanecki R, et al. Influence of atorvastatin on angiotensin I metabolism in resting and TNF-α -activated rat vascular smooth muscle cells. J Renin Angiotensin Aldosterone Syst. 2014;15:378–83. doi: 10.1177/1470320313475907. [DOI] [PubMed] [Google Scholar]
- Olszanecki R, Bujak-Gizycka B, Madej J, et al. Kaempferol, but not resveratrol inhibits angiotensin converting enzyme. J Physiol Pharmacol. 2008;59:387–92. [PubMed] [Google Scholar]
- Vogel C, Marcotte EM. Insights into the regulation of protein abundance from proteomic and transcriptomic analyses. Nat Rev Genet. 2012;13:227–32. doi: 10.1038/nrg3185. [DOI] [PMC free article] [PubMed] [Google Scholar]
- Wang G, Lai FM, Lai KB, et al. Discrepancy between intrarenal messenger RNA and protein expression of ACE and ACE2 in human diabetic nephropathy. Am J Nephrol. 2009;29:524–31. doi: 10.1159/000185629. [DOI] [PubMed] [Google Scholar]
- Fingerle G, Pforte A, Passlick B, Blumenstein M, Ströbel M, Ziegler-Heitbrock HW. The novel subset of CD14+/CD16+ blood monocytes is expanded in sepsis patients. Blood. 1993;82:3170–6. [PubMed] [Google Scholar]
- Kwissa M, Nakaya HI, Onlamoon N, et al. Dengue virus infection induces expansion of a CD14(+)CD16(+) monocyte population that stimulates plasmablast differentiation. Cell Host Microbe. 2014;16:115–27. doi: 10.1016/j.chom.2014.06.001. [DOI] [PMC free article] [PubMed] [Google Scholar]
- Dayyani F, Belge KU, Frankenberger M, Mack M, Berki T, Ziegler-Heitbrock L. Mechanism of glucocorticoid-induced depletion of human CD14+CD16+ monocytes. J Leukoc Biol. 2003;74:33–9. doi: 10.1189/jlb.1202612. [DOI] [PubMed] [Google Scholar]
- Fertl A, Menzel M, Hofer TP, Morresi-Hauf A, Ziegler-Heitbrock L, Frankenberger M. Monitoring of glucocorticoid therapy by assessment of CD14(+)CD16(+) monocytes: a case report. Immunobiology. 2008;213:909–16. doi: 10.1016/j.imbio.2008.07.018. [DOI] [PubMed] [Google Scholar]
- Korkosz M, Bukowska-Strakova K, Sadis S, Grodzicki T, Siedlar M. Monoclonal antibodies against macrophage colony-stimulating factor diminish the number of circulating intermediate and nonclassical (CD14(++)CD16(+)/CD14(+)CD16(++)) monocytes in rheumatoid arthritis patients. Blood. 2012;119:5329–30. doi: 10.1182/blood-2012-02-412551. [DOI] [PubMed] [Google Scholar]
- Wenzel P, Knorr M, Kossmann S, et al. Lysozyme M-positive monocytes mediate angiotensin II-induced arterial hypertension and vascular dysfunction. Circulation. 2011;124:1370–81. doi: 10.1161/CIRCULATIONAHA.111.034470. [DOI] [PubMed] [Google Scholar]
- Ziegler-Heitbrock L. Monocyte subsets in man and other species. Cell Immunol. 2014;289:135–9. doi: 10.1016/j.cellimm.2014.03.019. [DOI] [PubMed] [Google Scholar]
Associated Data
This section collects any data citations, data availability statements, or supplementary materials included in this article.
Supplementary Materials
Fig. S1. Elutriated monocytes were stained for CD14 and CD16 antigens, gated (P1) on the scatterplot (a) and then particular subpopulations of human monocytes (MO) from the P1 gate were defined (b) according to CD14 and CD16 expression, and sorted.
Fig. S2. An exemplary melting curve analysis diagram of an amplified product for angiotensin-converting enzyme type 1 (ACE1) mRNA expression; 1 = amplified product; 2 = negative control.
Fig. S3. Single reaction monitoring (SRM) assay. For each of the peptide, the full scan (upper) is followed by a corresponding fragmentation tandem mass spectrometry (MS/MS) scan (lower). Transitions used in the transition set-ups for (a) Ang 1-7, (b) Ang 1-9 and (c) Ang II, respectively, are highlighted (frame).