Abstract
Automatic tissue segmentation of the neonate brain using Magnetic Resonance Images (MRI) is extremely important to study brain development and perform early diagnostics but is challenging due to high variability and inhomogeneity in contrast throughout the image due to incomplete myelination of the white matter tracts. For these reasons, current methods often totally fail or give unsatisfying results. Furthermore, most of the subcortical midbrain structures are misclassified due to a lack of contrast in these regions. We have developed a novel method that creates a probabilistic subject-specific atlas based on a population atlas currently containing a number of manually segmented cases. The generated subject-specific atlas is sharp and adapted to the subject that is being processed. We then segment brain tissue classes using the newly created atlas with a single-atlas expectation maximization based method. Our proposed method leads to a much lower failure rate in our experiments. The overall segmentation results are considerably improved when compared to using a non-subject-specific, population average atlas. Additionally, we have incorporated diffusion information obtained from Diffusion Tensor Images (DTI) to improve the detection of white matter that is not visible at this early age in structural MRI (sMRI) due to a lack of myelination. Although this necessitates the acquisition of an additional sequence, the diffusion information improves the white matter segmentation throughout the brain, especially for the mid-brain structures such as the corpus callosum and the internal capsule.
Keywords: segmentation, subject-specific, population, neonate, MRI, automatic, atlas, tissue
1. INTRODUCTION
Magnetic Resonance Imaging (MRI) is a widely used modality to study in-vivo neonate brain structures. It allows researchers to assess brain growth defects1,2,3, to measure brain normality and to study children at high-risk of neurodevelopmental disorders including autism4 and schizophrenia5. However, manually segmenting MRI scans is a fastidious and time-consuming process. It is also subject to intra- and inter-rater variability6. Consequently automatic tissue segmentation of neonate brain MRI data is essential to study normal development and medical conditions. Such tissue segmentation is more challenging in the neonate than adult brain due to its small size, limited resolution, low Signal to Noise Ratio (SNR) and Contrast to Noise Ratio (CNR), increased motion artifacts, incomplete myelination7, and the high level of inhomogeneity and variability in the different tissues. Additionally, at the age, rapid changes in size, shape and appearance are observable8 which leads to large differences between subjects. A common result of these factors is that most of the existing methods fail or give unsatisfying results, especially in the subcortical midbrain structures.
Currently, most available methods include a single atlas tissue classification method9,10,11,12. Some of the most recent methods, which give better results, provide additional information to the algorithm by using a longitudinal approach10. The latter method necessitates the acquisition of images at multiple time points, which is not always possible. Single atlas classification method typically requires an atlas that has been generated from a set of images for which the segmentation is available. This atlas is representative of the population it was created from, but is generally fuzzy and may not be morphologically similar to the subject that needs to be segmented. Existing segmentation methods show failure rates as high as 50% of the studied subjects in the experimental data presented in this paper.
In order to improve these segmentations, we developed a new method that generates, for each subject, a specific probabilistic tissue atlas based on an atlas population composed of 12 manually segmented cases. Our method then uses this subject-specific atlas with an existing standard single-atlas segmentation method. The computed subject-specific atlases are sharp and well adapted to the subjects to be segmented. Furthermore, we extended this method to include diffusion information in the construction of the subject specific atlas, as well as in the application of this atlas on the subject data. The results show that the diffusion MRI data helps segmenting the white matter in mid-brain regions such as the corpus callosum and the internal capsule. Overall, the proposed method shows considerably improved results, compared to the ones obtained with an existing population average atlas.
2. METHODS
2.1. Data
We evaluated the performances of our proposed new neonate brain segmentation method using a dataset that contains twelve T1 weighted (T1w) and T2 weighted (T2w) MRI of newborns. Six subjects additionally had a Diffusion Weighted Image (DWI) acquired. Images from one subject were acquired in the same scanning session. Newborns were scanned between the age of 40 weeks corrected gestational age (two premature infants) and 47 days. Children were scanned unsedated while asleep, fitted with ear protection and with their heads secured in a vacuum-fixation device. Acquisition parameters can be found in the supplementary material (Appendix A).
For all the subjects, subsequent quality control procedures by trained image analysis experts showed all scans to pass quality assessment for structural morphometric analysis. DWI scans were quality controlled using DTIPrep13: automatic and visual controls were performed. Each T1w and T2w images were co-registered to a template and resampled with a spacing of 1×1×1mm3.
2.2. Design
For each subject to be segmented, the proposed method requires a co-registered T1w and a T2w MR scan. A DWI scan can also be provided. In order to generate the subject specific atlas, we also need an atlas population that is a set of cases, each containing a brain masked T1w image, a T2w image, and a tissue segmentation. The methods can largely be subdivided into five phases: pre-processing, registration of the atlas population, generation of the specific probabilistic atlas, execution of a single-atlas segmentation algorithm, and post-processing.
2.2.1. Pre-processing
First, we skull-strip/brain-mask the T1w and T2w images using a mask previously computed via FSL-bet14. As FSL-bet has not been developed for the neonate setting, a manual correction of the brain mask is quite common. Following skull stripping, an inhomogeneity correction via N415 is performed on these images. Concerning the diffusion weighted images, if one is provided, we estimate the Diffusion Tensor Image (DTI), its average baseline (b0) images from the DWI, and then the Fractional Anisotropy (FA) and the Axial Diffusivity (AD) images from the DTI. The diffusion images are next registered to the structural images with an affine transformation followed by a diffeomorphic one. These transformations are computed with the multi-modality SyN optimization using normalized cross-correlation metric in ANTS16 registering the b0 to the T2w image and AD to the T2w image. The resulting transformations are applied to the FA and the AD images.
2.2.2. Atlas population registration
We register each case from the atlas population to the subject to be segmented. We employ an affine transformation followed by a diffeomorphic SyN transformation, computed via a multi-modal, normalized cross-correlation based co-registration of the T1w and T2w images from the atlas case to the subject space. The transformations are then applied to the atlas cases’ T1w, the T2w and its tissue segmentation. Our implementation dynamically handles whether the atlas cases provide label maps or probabilistic prior maps as tissue segmentations information.
2.2.3. Generation of the subject-specific probabilistic atlas
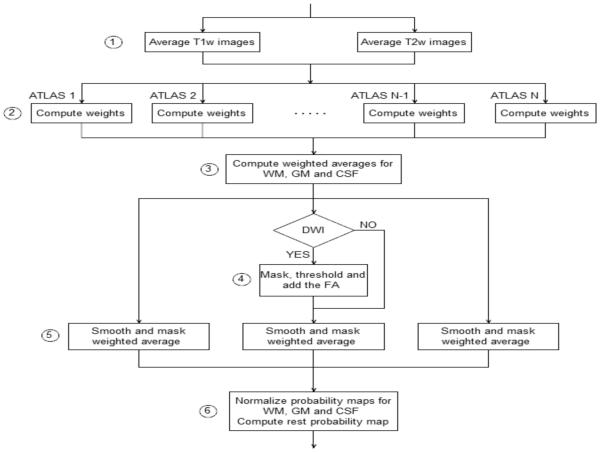
Once all the atlas images are co-registered with the subject’s data, we generate the subject-specific atlas following the steps shown in figure 1.
Figure 1.
Processing steps (atlas population registration and segmentation).
First we generate a subject specific template T1w and a template T2w by averaging respectively all the T1w and all the T2w images from the co-registered atlas population.
Weighted averaging of tissue probability maps: As some atlas cases are locally more similar to the subject after co-registration than others; we want to give those cases more weight when computing the subject-specific probability maps. For that purpose, we employ voxel-wise weights per atlas case based on normalized cross-correlation metric within a specified neighborhood (default 3mm).
We compute the initial subject specific probability maps for each tissue class by local weighted averages of the co-registered atlas segmentations using the respective weight images.
Even in the early postnatal neonate setting, where little myelination is present in the brain white matter, DTI data shows significantly higher FA and AD values in the white than the gray matter. FA and AD images thus have the potential to provide relevant, additional information for tissue segmentation, particularly in the internal capsule and the corpus callosum. In this step, we aim to edit the initial subject specific white matter probability map using the subject’s FA image. As white matter regions are located centrally from gray matter, we first mask the FA image with an eroded brain mask (2mm, less than the expected average cortical thickness in the neonate brain) to remove the peripheral and gray matter regions where the FA is noisier (and potentially high due to noise only). Then, we transform the FA intensities via an error function (mean=0.3, sigma=10) based mapping that reduces low FA values and flattens out high values. Finally, the transformed image is added to the initial white matter prior (weight=1.5).
We apply a Gaussian smoothing of small kernel size to the current subject specific probability maps to allow for inaccuracies in the atlas registration and probability map creation process.
Finally, we compute a voxel-wise normalization of the probability maps to normalize their sum to 1 within the brain mask. Once we have generated the probability maps for the white matter, gray matter and cerebrospinal fluid (CSF), we can deduce the probability map for the “rest” class by subtracting the other ones to the maximum value.
2.2.4. Standard neonate tissue segmentation
Once the full subject-specific probabilistic atlas has been generated, we run an existing, expectation-maximization based single atlas tissue classification method, called neoseg9. While typically this segmentation is performed with T1w and T2w images, we optionally also include the AD images as a third channel in this tissue segmentation.
2.2.5. Post-processing
Our neonate tissue classification yields segmentations of both early myelinated and unmyelinated white matter (WM) regions. Since for most of the studies we do not need this distinction, the tool optionally merges the two white matter types. Additionally, we reassign small white matter islands. We reassign them either to gray matter (GM) or CSF, according to the probability maps from the subject-specific atlas.
3. RESULTS
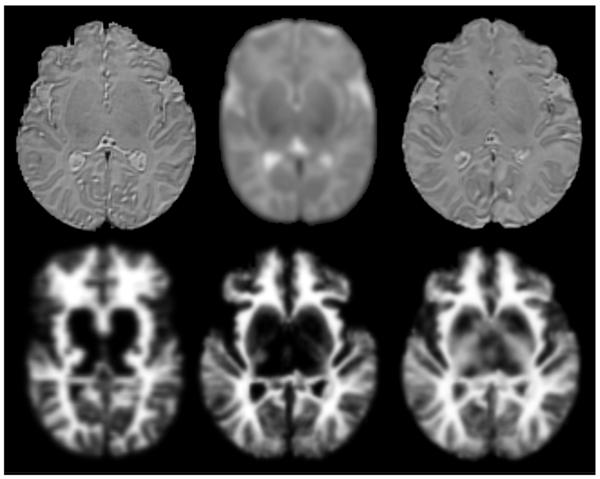
Figure 2A (top) shows a representative, comparative T2w slice of a selected subject image, a population average atlas and the subject-specific average image. Not surprisingly, the subject-specific one is sharper and more similar to the subject than the population average. Figure 2B (bottom) presents the WM probability maps of the different methods compared in this section: population average, subject-specific without diffusion information, subject specific with diffusion information. When the diffusion data is incorporated, white matter probability maps have significantly more appropriate values in the corpus callosum and internal capsule regions.
Figure 2.
From left to right – Axial view of A-top) a subject T2w, a T2w population average, and a subject-specific T2w average. B-bottom) the population average WM probability map, a subject-specific WM probability map computed without DTI information, and a WM probability map computed using DTI.
To evaluate the quality of the segmentation results, we performed a leave-one-out cross-validation experiment. The analysis was realized using the twelve subjects that are part of our population atlas. First, the pipeline was run on all the cases with the default parameters without including the optional DWI. Then, to measure the improvement due to the addition of the diffusion information, the six newborn dataset that contains a DWI were also segmented with our pipeline using the same parameters but including the DWI. A segmentation result of one subject using the latter method is presented as a 3D rendering in figure 3.
Figure 3.
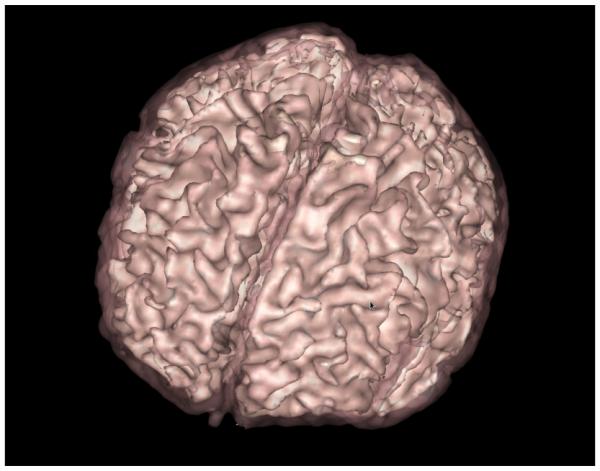
3D Rendering of a neonate segmentation: White Matter (white, solid) and Gray Matter (pink, transparent).
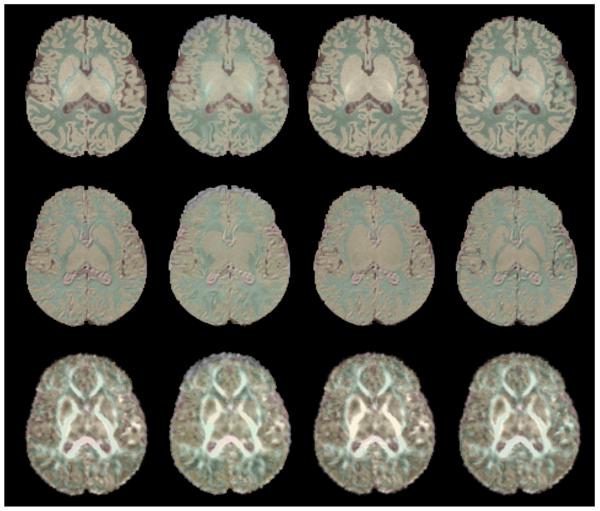
For each case, we compared our results to a corresponding reference manual segmentation (ground truth). To estimate the improvement of our novel method, we also segmented all the images using a population average atlas. Results are presented in figure 4; each segmentation method result is overlaid on the corresponding T1w, T2w and FA images.
Figure 4.
From top to bottom: Axial view of a subject T1w, T2W and FA image. From left to right: manual, single population-atlas, subject-specific atlas (no DTI), subject-specific atlas (with DTI) segmentations.
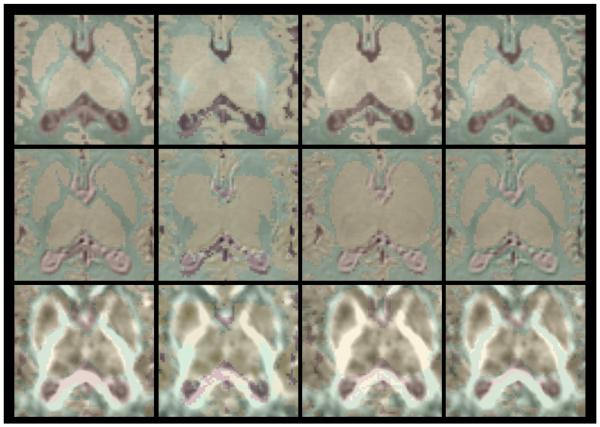
Figure 5 shows a close-up view of the midbrain structures of the brain where the white matter is typically poorly segmented. The segmentations computed with the subject-specific atlas, especially the one including the diffusion information, seem to considerably improve the segmentation result compared to the segmentation obtained using the generic population atlas. We computed volume difference, average surface distance, and Tanimoto volumetric overlap error between the developed methods and the generic average atlas method (table 2). The Tanimoto overlap error shows a significant improvement in the segmentation of the 3 tissue types (WM, GM, CSF) when using a subject-specific atlas both when using and when not using the extra diffusion information.
Figure 5.
Close-up on the central White Matter regions (midbrain structures segmentation). From top to bottom: Axial view of a subject T1w, T2W and FA image. From left to right: manual, single population-atlas, subject-specific atlas (no DTI), subject-specific atlas (with DTI) segmentations.
Table 2.
Evaluation of segmentation difference across segmentation methods. Statically significant differences
| Evaluation | Volume difference (%) | Average distance | Tanimoto error | |
|---|---|---|---|---|
| White matter | Generic | −9.762 | 0.798 | 47.069 |
| No DTI | −8.806 | 0.417 | 27.649 *** | |
| DTI | 14.157 ** | 0.461 | 29.388 ** | |
| Gray Matter | Generic | −1.277 | 0.622 | 44.065 |
| No DTI | 6.737 | 0.310 *** | 24.640 *** | |
| DTI | − 14.516 ** | 0.368 *** | 29.200 *** | |
| CSF | Generic | −15.931 | 1.994 | 67.493 |
| NoDTI | −9.601 | 0.456 | 35.400 *** | |
| DTI | 0.806 | 0.568 | 43.637 ** |
p<0.05,
p<0.01,
p<0.001
Additionally, we measured the stability of the segmented volume across multiple scans of the same subjects. Six subjects were scanned twice and segmented using our proposed method without diffusion information. WM, GM, CSF, and ICV volumes were measured and compared across same-subject scans (table 3). WM, GM and ICV volumes are extremely stable: respectively 1.04%, 1.60% and 2.45% of variation across the different scans. The CSF volume variation is larger: 12.69% (two subjects have a large CSF volume variation).
Table 3.
Volume of the White Matter (WM), Gray Matter (GM), Cerebrospinal fluid (CSF), and intracranial volume (ICV) in mm3. Each subject has been scanned twice (1,2). The coefficient of variation (CV) is computed. Avg is the average coefficient of variation.
| Case | WM | GM | CSF | ICV | ||||||||
|---|---|---|---|---|---|---|---|---|---|---|---|---|
| Scan | 1 | 2 | CV | 1 | 2 | CV | 1 | 2 | CV | 1 | 2 | CV |
| 1 | 146304 | 150443 | 1.97% | 252720 | 262987 | 2.82% | 42948 | 42924 | 0.04% | 441972 | 456354 | 2.26% |
| 2 | 175528 | 174950 | 0.23% | 292663 | 287618 | 1.23% | 52964 | 49323 | 5.03% | 521155 | 511891 | 1.27% |
| 3 | 170030 | 169899 | 0.05% | 278947 | 279744 | 0.20% | 44571 | 44133 | 0.70% | 493548 | 493776 | 0.03% |
| 4 | 127132 | 130772 | 2.00% | 177013 | 179282 | 0.90% | 23029 | 32352 | 23.81% | 327174 | 342406 | 3.22% |
| 5 | 178464 | 176553 | 0.76% | 290236 | 305781 | 3.69% | 50589 | 95406 | 43.41% | 519289 | 577740 | 7.54% |
| 6 | 140506 | 142921 | 1.21% | 192919 | 190926 | 0.73% | 55108 | 52687 | 3.18% | 388533 | 386534 | 0.36% |
| Avg | 1.04% | 1.60% | 12.69% | 2.45% | ||||||||
4. DISCUSSION
4.1. Conclusion
Our proposed method to employ a subject-specific atlas considerably improves neonate tissue segmentation results. The atlas used for the segmentation is more similar to the brain to segment than if a population average atlas were used. Complete failures are eliminated in our experimental data (two cases repeatedly failed when using the generic atlas segmentation method). Moreover, when adding diffusion information, the segmentation of the subcortical midbrain structures is also more accurate. If the subjects from the atlas population do not have a good segmentation of these regions, the diffusion information allows recovery of this missing information and adequate segmentation of these regions. Other methods that only segment the tissues based on the T1w and T2w images lack contrast in this central region of the brain to segment it accurately.
Additionally, we have verified that the presented pipeline gives stable results. The segmented tissue volumes are very stable across multiple scans. CSF volume is not as stable for all subjects, but this is likely due to brain mask differences. The stability measurements have been computed only for six subjects, and only two subjects have large variations while the others have little variation. Additional testing would be necessary to assess of the stability of the CSF.
4.2. Software implementation notes
Along with providing more accurate and stable segmentations, the tool we developed is also is also easy to use. Our pipeline is implemented as a graphical user interface that creates python scripts that contain the actual pipeline to be executed. These scripts are then directly executed as the user runs the pipeline. The advantage of this method is two-fold. First, this creates a pseudo-log of the execution without any command missing, as the script is the actual pipeline that is executed (i.e. it is easy to open and read the script to verify what options have been specified). Second, if one wants to run the processing on the same image again, maybe because a better scan from that subject is now available, one can just run the script again, without having to worry about starting the tool and setting the parameters again. Both manually creating a log and running the processing a second time are error prone. Our implementation avoids any potential error due to these steps. Our software is freely available on the Neuroimaging Informatics Tools and Resources Clearinghouse (NITRC) website (http://www.nitrc.org/projects/neosegpipeline) and the source code is published under a permissive license (Apache Licence 2.0).
When creating a subject-specific atlas, each case that is part of the population atlas has to be registered to the case to be segmented. Non-rigid (diffeomorphic) registration can be time consuming. To speed up the process, since each registration is independent from each other, we run as many registration processes in parallel as possible (limited to the number of cores on the computer used). This allows to avoid increasing processing time linearly with respect to the number of subjects in the population atlas.
4.3. Limitations
A limitation of our study is the low number of cases we processed to evaluate the performances of our pipeline (twelve cases without DWI, six cases with DWI, six cases for the stability measurement) and the low number of cases that are part of the population atlas. However, the number of subjects for which we have a very good manual segmentation is small because manually segmenting a neonatal brain scan is a slow and fastidious process. Additionally, acquiring multiple images of the same infant to estimate the stability of our method across images from the same subject is also difficult due to the young age of the subjects. A possibility to increase the number of subjects in our population atlas would be to flip around the mid-sagittal plan the images of the population atlas cases as it has been shown in multiple studies that it improves segmentation results17,18,19,20.
4.4. Future work
Finally, although the final step of our pipeline, which consists in running the tool called Neoseg, performs well, especially with our subject-specific atlas, one could also try to improve it to obtain more accurate results. Our population atlas is freely available on our laboratory’s website (http://www.med.unc.edu/psych/research/niral/files/atlases/neonate_multiatlas) and we will update it and improve it, adding new cases to it when new segmentations are available.
Supplementary Material
APPENDIX A – MRI acquisition parameters
Table 1.
Scan age (in days unless otherwise specified). Two newborn were premature infants (birth at week *30.86 and **30).
| Subject | 1 | 2 | 3 | 4 | 5 | 6 | 7 | 8 | 9* | 10** | 11 | 12 |
| Age (days) |
47 | 30 | 26 | 26 | 20 | 13 | 14 | 24 | 40 weeks corrected gestational age |
N/A | N/A | |
ACKNOWLEDGMENTS
This work was funded by Mechanisms Of Risk And Resilience In ASD: Ontogeny, Phylogeny And Gene Disruption (5P50MH100029-02), Developmental Brain Atlas Tools And Data Applied To Humans And Macaques (5R01MH091645-04), Fetal Programming Of The Newborn And Infant Human Brain (5R01MH091351-04), A Longitudinal MRI Study Of Infants At Risk For Autism (5R01HD055741-07), A Longitudinal MRI Study Of Brain Development In Fragile X Syndrome (5R01HD059854-04), Core 1 - Computer Science And Algorithm (5U54EB005149-09), Early Brain Development In One And Two Year Olds (2R01HD053000-06A1), Early Brain Development In Twins (5R01MH070890-10). We are thankful to Ivana Išgum, Pim Moeskops, and Max A. Viergever, from the Image Sciences Institute, University Medical Center Utrecht (The Netherlands) for letting us use two subjects from the MICCAI NeoBrainS12 challenge (http://neobrains12.isi.uu.nl/index.php) as part of our multi-subject atlas.
REFERENCES
- [1].Licht DJ, Shera DM, Clancy RR, Wernovsky G, Montenegro LM, Nicolson SC, Zimmerman RA, Spray TL, Gaynor JW, et al. Brain maturation is delayed in infants with complex congenital heart defects. J. Thorac. Cardiovasc. Surg. 2009;137(3):529–536. doi: 10.1016/j.jtcvs.2008.10.025. discussion 536–537. [DOI] [PMC free article] [PubMed] [Google Scholar]
- [2].Woodward LJ, Anderson PJ, Austin NC, Howard K, Inder TE. Neonatal MRI to predict neurodevelopmental outcomes in preterm infants. N. Engl. J. Med. 2006;355(7):685–694. doi: 10.1056/NEJMoa053792. [DOI] [PubMed] [Google Scholar]
- [3].Hüppi PS, Warfield S, Kikinis R, Barnes PD, Zientara GP, Jolesz FA, Tsuji MK, Volpe JJ. Quantitative magnetic resonance imaging of brain development in premature and mature newborns. Ann. Neurol. 1998;43(2):224–235. doi: 10.1002/ana.410430213. [DOI] [PubMed] [Google Scholar]
- [4].Knickmeyer RC, Gouttard S, Kang C, Evans D, Wilber K, Smith JK, Hamer RM, Lin W, Gerig G, et al. A structural MRI study of human brain development from birth to 2 years. J. Neurosci. 2008;28(47):12176–12182. doi: 10.1523/JNEUROSCI.3479-08.2008. [DOI] [PMC free article] [PubMed] [Google Scholar]
- [5].Gilmore JH, Kang C, Evans DD, Wolfe HM, Smith JK, Lieberman JA, Lin W, Hamer RM, Styner M, et al. Prenatal and neonatal brain structure and white matter maturation in children at high risk for schizophrenia. Am. J. Psychiatry. 2010;167(9):1083–1091. doi: 10.1176/appi.ajp.2010.09101492. [DOI] [PMC free article] [PubMed] [Google Scholar]
- [6].Maltbie E, Bhatt K, Paniagua B, Smith RG, Graves MM, Mosconi MW, Peterson S, White S, Blocher J, et al. Asymmetric bias in user guided segmentations of brain structures. Neuroimage. 2012;59(2):1315–1323. doi: 10.1016/j.neuroimage.2011.08.025. [DOI] [PMC free article] [PubMed] [Google Scholar]
- [7].McArdle CB, Richardson CJ, Nicholas DA, Mirfakhraee M, Hayden CK, Amparo EG. Developmental features of the neonatal brain: MR imaging. Part I. Gray-white matter differentiation and myelination. Radiology. 1987;162(1 Pt 1):223–229. doi: 10.1148/radiology.162.1.3786767. [DOI] [PubMed] [Google Scholar]
- [8].Matsuzawa J, Matsui M, Konishi T, Noguchi K, Gur RC, Bilker W, Miyawaki T. Age-related volumetric changes of brain gray and white matter in healthy infants and children. Cereb. Cortex. 2001;11(4):335–342. doi: 10.1093/cercor/11.4.335. [DOI] [PubMed] [Google Scholar]
- [9].Prastawa M, Gilmore JH, Lin W, Gerig G. Automatic segmentation of MR images of the developing newborn brain. Med. Image Anal. 2005;9(5):457–466. doi: 10.1016/j.media.2005.05.007. [DOI] [PubMed] [Google Scholar]
- [10].Shi F, Fan Y, Tang S, Gilmore JH, Lin W, Shen D. Neonatal brain image segmentation in longitudinal MRI studies. Neuroimage. 2010;49(1):391–400. doi: 10.1016/j.neuroimage.2009.07.066. [DOI] [PMC free article] [PubMed] [Google Scholar]
- [11].Merisaari H, Parkkola R, Alhoniemi E, Teräs M, Lehtonen L, Haataja L, Lapinleimu H, Nevalainen OS. Gaussian mixture model-based segmentation of MR images taken from premature infant brains. J. Neurosci. Methods. 2009;182(1):110–122. doi: 10.1016/j.jneumeth.2009.05.026. [DOI] [PubMed] [Google Scholar]
- [12].Wang L, Shi F, Lin W, Gilmore JH, Shen D. Automatic segmentation of neonatal images using convex optimization and coupled level sets. Neuroimage. 2011;58(3):805–817. doi: 10.1016/j.neuroimage.2011.06.064. [DOI] [PMC free article] [PubMed] [Google Scholar]
- [13].Oguz I, Farzinfar M, Matsui J, Budin F, Liu Z, Gerig G, Johnson HJ, Styner M. DTIPrep: quality control of diffusion-weighted images. Front. Neuroinform. 2014;8(4) doi: 10.3389/fninf.2014.00004. [DOI] [PMC free article] [PubMed] [Google Scholar]
- [14].Smith SM. Fast robust automated brain extraction. Hum. Brain Mapp. 2002;17(3):143–155. doi: 10.1002/hbm.10062. [DOI] [PMC free article] [PubMed] [Google Scholar]
- [15].Tustison NJ, Avants BB, Cook PA, Zheng Y, Egan A, Yushkevich PA, Gee JC. N4ITK: improved N3 bias correction. IEEE Trans. Med. Imaging. 2010;29(6):1310–1320. doi: 10.1109/TMI.2010.2046908. [DOI] [PMC free article] [PubMed] [Google Scholar]
- [16].Avants BB, Tustison NJ, Song G, Cook PA, Klein A, Gee JC. A reproducible evaluation of ANTs similarity metric performance in brain image registration. Neuroimage. 2011;54(3):2033–2044. doi: 10.1016/j.neuroimage.2010.09.025. [DOI] [PMC free article] [PubMed] [Google Scholar]
- [17].Liu Y, Collins RT, Rothfus, William E. Automatic bilateral symmetry (midsagittal) plane extraction from pathological 3D neuroradiological images. Proc. SPIE. 1998;3338:1528–1539. [Google Scholar]
- [18].Jorge Cardoso M, Leung K, Modat M, Keihaninejad S, Cash D, Barnes J, Fox NC, Ourselin S. STEPS: Similarity and Truth Estimation for Propagated Segmentations and its application to hippocampal segmentation and brain parcelation. Med. Image Anal. 2013;17(6):671–684. doi: 10.1016/j.media.2013.02.006. [DOI] [PubMed] [Google Scholar]
- [19].Leung KK, Barnes J, Ridgway GR, Bartlett JW, Clarkson MJ, Macdonald K, Schuff N, Fox NC, Ourselin S. Automated cross-sectional and longitudinal hippocampal volume measurement in mild cognitive impairment and Alzheimer’s disease. Neuroimage. 2010;51(4):1345–1359. doi: 10.1016/j.neuroimage.2010.03.018. [DOI] [PMC free article] [PubMed] [Google Scholar]
- [20].Ma D, Cardoso MJ, Modat M, Powell N, Wells J, Holmes H, Wiseman F, Tybulewicz V, Fisher E, et al. Automatic structural parcellation of mouse brain MRI using multi-atlas label fusion. PLoS One. 2014;9(1):e86576. doi: 10.1371/journal.pone.0086576. [DOI] [PMC free article] [PubMed] [Google Scholar]
Associated Data
This section collects any data citations, data availability statements, or supplementary materials included in this article.
Supplementary Materials
APPENDIX A – MRI acquisition parameters


