

Abstract
Creatine ethyl ester hydrochloride (CEE) was synthesized as a prodrug of creatine (CRT) to improve aqueous solubility, gastrointestinal permeability, and ultimately the pharmacodynamics of CRT. We used high-performance liquid chromatography (HPLC) and proton nuclear magnetic resonance (NMR) to characterize the pH-dependent stability of CEE in aqueous solution and compared the permeability of CEE to CRT and creatinine (CRN) across Caco-2 human epithelial cell monolayers and transdermal permeability across porcine skin. CEE was most stable in a strongly acidic condition (half-life = 570 hours at pH 1.0) where it undergoes ester hydrolysis to CRT and ethanol. At pH ≥ 1.0, CEE cyclizes to CRN with the logarithm of the first order rate constant increasing linearly with pH. Above pH 8.0 (half-life = 23 sec) the rate of degradation was too rapid to be determined. The rate of degradation of CEE in cell culture media and simulated intestinal fluid (SIF) was a function of pH and correlated well with the stability in aqueous buffered solutions. The permeability of CEE across Caco-2 monolayers and porcine skin was significantly greater than that of CRT or CRN. The stability of CEE in acidic media together with its improved permeability suggests that CEE has potential for improved oral absorption compared to CRT.
Keywords: creatine, creatine ethyl ester, creatinine, stability
Introduction
Creatine (CRT) and its derivatives (Figure 1) are widely used by athletes as ergogenic nutritional supplements to enhance lean-body mass, muscle fiber diameter, strength, and total work performance (Bird, 2003; Buford et al, 2007; Terjung et al, 2000). The pharmacokinetics of CRT supplementation taken in the monohydrate form and the effects on serum CRT and creatinine (CRN) concentrations have been described by a number of investigators (Persky, Brazeau, & Hochhau, 2003a; Persky et al., 2003b; Portmans et al., 1997; Schedel, Tanaka, Kiyonaga, Shindo, & Schutz, 1999). CRT as its monohydrate has a relatively low aqueous solubility resulting in the potential for gastrointestinal discomfort when it is taken in the commonly used doses of 5–20 grams or more. As a result, numerous CRT salts and formulations have been investigated in attempts to improve the physicochemical, biopharmaceutical, and biological performance of CRT (Gufford et al., 2010). Similarly, creatine ethyl ester hydrochloride (CEE) was synthesized as a pronutrient form of CRT, analogous to a prodrug of a therapeutic drug, to improve the aqueous solubility, gastrointestinal permeability, and ultimately the pharmacodynamic effects of CRT (Vennerstrom & Miller, 2007).
FIGURE 1.
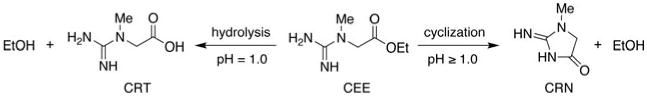
Conversion of CEE to CRT and CRN.
The biopharmaceutical profile of CEE is largely unknown. Degradation of CEE can form either CRT through intramolecular ester hydrolysis, or CRN through 5-exotrig cyclization Adriano et al., 2011; Giese & Lecher, 2009a; Johnson, 1993) (Figure 1). The latter intramolecular reaction likely accounts for the undesired formation of CRN hydrochloride observed in the equilibrium esterification process used for the synthesis of CEE from CRT monohydrate (Mold, Gore, Lynch, & Schantz, 1955; Vennerstrom, 2005). Recent experiments (Giese & Lecher, 2009a, 2009b; Katseres, Reading, Shayya, DiCesare, & Purser, 2009) using proton NMR in deuterated water suggest that CEE is converted to CRN with a half-life of less than one min at pH 7.4 in the presence and absence of human plasma, although CEE solution stability increased considerably as pH decreased. This contradicts a report (Child & Tallon, 2007) that CEE undergoes significant conversion to CRN in low pH environments, suggesting that the degradation of CEE in the stomach would limit oral bioavailability.
To clarify these data, pH-dependent rates of degradation of CEE in aqueous and simulated biological media were determined by measuring the decline in CEE concentration and subsequent formation of CRT, CRN, and ethanol using both HPLC and proton NMR. In addition, the permeability of CEE, CRT, and CRN across in vitro models of absorption barriers was examined to provide preliminary information relating to absorption following oral administration of CEE. Together these findings suggest that CEE is very stable within the acid environment of the stomach and, depending on the environment (aqueous vs. lipid), has greater stability and permeability than previously reported.
Materials and Methods
Reagents
CEE (PrimaForce) was obtained from Scivation, Inc. (Sylmar, CA) and was used as received after proton NMR analysis confirmed the absence of detectable impurities. CRT monohydrate (Creapure™) was obtained from Degussa (Trostberg, Germany), 1-octanesulfonic acid sodium salt was obtained from Fluka (Steinhein, Switzerland), simulated intestinal fluid (SIF) was obtained from Ricca Chemical Company (Arlington, TX), soy lecithin was obtained from Fisher (St. Louis, MO), and all other reagents were obtained from Sigma-Aldrich (Milwaukee, WI) and were used as received.
HPLC Kinetic Analysis
The rate and extent of CEE degradation in buffered aqueous solutions from pH 1.0 to 4.6 was monitored using a stability-indicating HPLC assay to simultaneously quantify CEE, CRT, and CRN. The HPLC system consisted of a Shimadzu SCL-10A controller, a SIL-10AF auto sampler, dual LC-10AT pumps, and a SPD-10A UV-VIS detector set to monitor absorbance at 210 for CEE, CRT, and CRN and 235 nm for confirmation of CRN. A Waters Atlantis® T3 column (4.6 × 100 mm2, 3 μm, C18) was maintained at 30°C by use of a column oven. The isocratic mobile phase consisted of 20% v/v acetonitrile, 5 mM formic acid, and 5 mM 1-octanesulfonic acid sodium salt (apparent pH 2.8) at a flow rate of 1.5 ml/min. Calibration curves for CEE, CRT monohydrate, and CRN were generated by diluting stock solutions (500 μg/ml) in the mobile phase to concentrations of 3,10,30, and 50 μg/ml. Linear regression gave excellent agreement between concentration and detector response within the experimental concentration range of 3-50 μg/ml (R2 = 0.999). Due to disruption of the ion-pairing reagents for the pH 1.0 samples, the pH of the mobile phase was decreased to pH 2.6 using sulfuric acid (in place of formic acid) to increase the retention time and separation of the CRT peak to allow for quantitation of all three analytes.
CEE Stability in Unbuffered Aqueous Solution
Aqueous solutions of CEE (100 μg/ml) were prepared in triplicate and stored in 100 ml glass vials at room temperature (rt). Aliquots (500 μl) were removed at recorded intervals, varying dependent upon the stability at that pH, diluted to 1 ml with HPLC mobile phase, and assayed for CEE, CRT, and CRN content by HPLC. In addition, 1 ml aliquots were removed at each time point to record the solution pH. The pH of a 100 μg/ml aq. solution of CEE was 4.0.
pH-Dependent Stability of CEE in Buffered Media
Solutions of CEE (500 μg/ml) were prepared in triplicate using buffered solutions at pH 1.0, 2.5, 4.6, 5.7, and 7.4 and stored in 100 ml glass vials at rt. The following buffer solutions were used: HCl/KCl (pH 1.0), citric acid/sodium citrate (pH 2.5,4.6, and 5.7) and Sorenson's phosphate buffer (pH 7.4 and 8.0) (Kohler, 1970). Aliquots (100 μl) were removed at recorded time intervals, diluted to 1 ml with HPLC mobile phase and assayed for CEE, CRT, and CRN content by HPLC. In addition, separate aliquots (1 ml) were removed at each time point to record solution pH. As saying the buffered samples required at least a 10-fold dilution with mobile phase to prevent interference with the ion-pairing chromatography. A 500 μg/ml initial concentration of CEE was required to enable dilution within the linear range of the calibration curves.
NMR Kinetic Analysis
The pH-dependent stability of CEE in aqueous (90% H2O/10% D2O) buffered media was measured using 1H NMR at pH 4.6, 7.4, 8.0, 9.5, and 10.5. In addition, proton NMR was used to assess the stability of CEE in: (1) cell culture media consisting of RPMI 1640 (Gibco), 10% fetal bovine serum (Hyclone), 100 units/ml penicillin (Gibco), and 100 μg/ml streptomycin (Gibco); (2) SIF pH 5.8; and (3) soy lecithin solutions prepared in pH 7.3 phosphate buffer at 1:1, 0.25:1, and 4:1 molar ratios of soy lecithin to CEE. The rate of CEE degradation was determined by comparing the integrated peak areas obtained by measuring the 1H NMR spectrum over time on a 400 MHz Bruker Avance III spectrometer as pseudo-2D data sets using pre saturation with a spoil gradient for water suppression. Degradation of CEE in pH 9.5 and 10.5 occurred in less than 15 s making determination of meaningful kinetic data impractical with proton NMR. At pH 8.0 and in the cell culture media, the pulse parameters of 4 scans per acquisition, 1 s acquisition time per scan, with a 2 s delay between scans, yielded 15 s per time point and allowed sufficient temporal resolution to determine the kinetic rate of chemical conversion. The relatively slower degradation at pH 7.4 and in the soy lecithin solutions allowed signal averaging of 16 scans per acquisition for 1 min per time point and an improved signal to noise ratio for integration accuracy. At pH 4.6, where the degradation rate was even slower, a 3,600 s delay was inserted between time points. Each acquisition consisted of 32 scans, with a 1.5 s acquisition time and 4 s interpulse delay resulting in a 3 min experiment time. Monitoring the stability of CEE in SIF at pH 5.8 predicated the insertion of a 1,200 s delay between time points and was determined using similar parameters to those outlined above for the pH 4.6 samples. An observation pulse of 30 degrees was used in all cases.
CEE Permeability Studies
The permeability of CEE, CRT, and CRN was evaluated using the established human intestinal epithelial cell line derived from a human colon carcinoma (Caco-2). The Caco-2 cells were seeded onto collagen coated Transwell polycarbonate membrane inserts (24 mm diameter; 0.4 μm pore size) (Fisher Scientific, Winnipeg, MB) at a density of 60,000 cells/cm2. The cells were grown in DMEM supplemented with 10% fetal bovine serum and maintained in a 5% CO2 environment for 18–21 days, after which, confluent monolayers were attained. For the permeability studies, the culture media was removed from the cells and 1.5 ml of SIF (pH 6.0) was placed in the apical (donor) compartment. The basolateral (receiver) compartment contained 2.5 ml of Tyrode's buffer consisting of 136 mM NaCl, 2.6 mM KCl, 1.8 mM CaCl2, 1 mM MgCl2, 0.36mM NaH2PO4, 5.56 mM D-Glucose, and 5 mM HEPES at pH 6.8. Following a 30 min pre-incubation period, the apical compartment was replaced with 1.5 ml of SIF containing CRT, CEE, or CRN (10 mM). Samples (10 μl) were removed from the apical (donor) compartment at the start and conclusion of the permeability experiment. Samples (100 μl) were removed from the receiver compartment at 0,30,60, and 90 min and placed in vials containing 900 μl of mobile phase. Passage of CRT from the donor to the receiver compartment was analyzed using the HPLC method described above. All permeability studies were performed under stirred conditions at 37°C. To insure the CEE in the donor compartment was not degraded, SIF in the donor compartment was replenished every 15 min with an equal volume of fresh SIF containing 10 mM CRT, CEE, or CRN. Permeability coefficients were determined as previously reported (Miller, Hinton, & Chen, 2011) using the equation below:
| (1) |
where Cr is concentration in the receiver compartment, t is time, Vd is the volume in the donor compartment, A is area, and Cd is the concentration in the donor compartment at time 0.
The transdermal permeability of CEE, CRT, and CRN was also determined across porcine skin. For these studies, a frozen section of porcine skin was thawed overnight at 4°C, rinsed with deionized water and then dried by blotting both surfaces with a paper towel. The skin was processed using an electric dermatome (Padgette Instruments, Kansas City, MO) to a thickness of 380 μm and placed in a phosphate buffered saline solution to prevent the dermatomed epidermis from dehydrating and shrinking. Epidermal sections were mounted in vertical Franz-style diffusion cells with the stratum corneum facing the donor cell. A total of 7 ml of saline—acetate buffer solution (pH 4.0) was placed in the receiver compartment, while 1 ml of CEE, CRT, or CRN (50 mM) in 1:1 ethanol:water was placed in the donor compartment and capped to prevent evaporation. Samples (100 μl) were removed from both the donor and receiver compartments at the start and conclusion (6 hr) of the permeability studies and analyzed for CEE, CRT, and CRN using HPLC.
Statistics
Data from permeability studies performed in the Caco-2 and porcine skin studies were analyzed using one-way analysis of variance with Student Newman Keuls (SNK) post-hoc comparison of the individual treatment means. Unless otherwise noted, p values of less than .05 represent statistical significance of the post-hoc comparisons.
Results
pH-Dependent CEE Stability
Representative HPLC chromatograms and proton NMR spectra of CEE, CRN, and CRT are shown in Figures 2 and 3, respectively. The decomposition of CEE was first order at all pH values tested. The rate of cyclization of CEE to CRN increased as the pH approached neutral conditions (Table 1) with the rate above pH 8.0 being too rapid for quantification by either HPLC or proton NMR. CEE was most stable in strongly acidic conditions with degradation half-lives of 570 and 200 hr at pH 1.0 and 2.5, respectively. Importantly, these data indicate that CEE undergoes intermolecular ester hydrolysis to form CRT and ethanol only at pH ≤ 1.0, whereas at pH conditions > 1.0, an intramolecular 5-exotrig cyclization (Giese & Lecher, 2009a) occurs to form CRN and ethanol (Figure 1). The rate of ester hydrolysis at pH 1.0 was 31-fold slower than the rate of cyclization at pH 4.0 and 37,000-fold slower than the rate at pH 7.4. Finally, no interconversion between CRT and CRN (Diamond, 2005; Edgar & Shiver, 1925; Edgar & Wakefield, 1923) was observed in any of these experiments.
FIGURE 2.
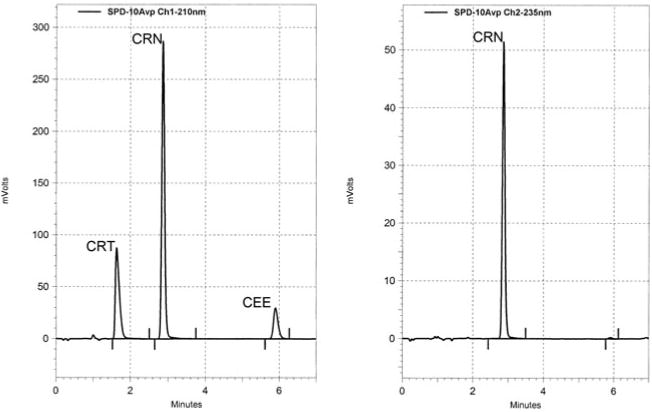
Representative HPLC chromatogram of 44 μg/ml CRT (1.63 min), 50 μg/ml CRN (2.87 min), and 50 μg/ml CEE (5.90 min) at 210 nm (left) and 235 nm (right).
FIGURE 3.
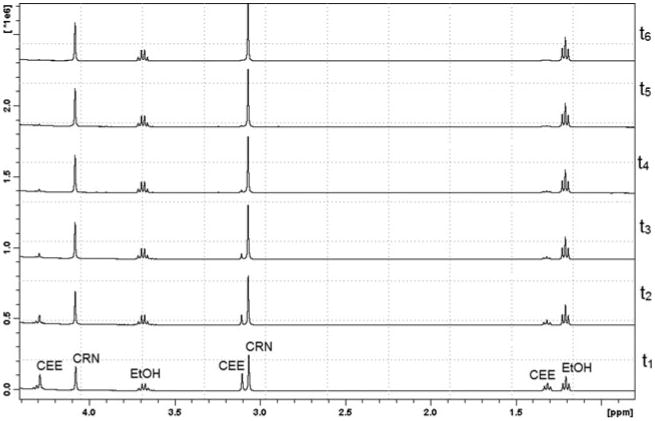
Overlays of representative proton NMR spectra showing degradation of CEE to CRN and ethanol (EtOH) over 6 min (t1 – t6) in pH 7.4 phosphate buffer solution.
TABLE 1. First-Order Rate Constants and Derived Half-Lives for the Degradation of CEE as a Function of pH and Biological Media.
| Buffered Aqueous Solutions | ||||
|---|---|---|---|---|
|
| ||||
| Buffer | pH | k (min−1) | Half-Life | |
| KCl/HCl | 1.0 | 2.0 × 10⁻⁵ | 570 | hr |
| Citrate | 2.5 | 5.8 × 10⁻⁵ | 200 | hr |
| Aqueous solution | 4.0 | 6.3 × 10⁻⁴ | 18 | hr |
| Citrate | 4.6 | 2.9 × 10⁻³ | 4.0 | hr |
| Citrate | 5.7 | 0.015 | 48 | min |
| Phosphate | 7.4 | 0.55 | 76 | s |
| Phosphate | 8.0 | 1.8 | 23 | s |
| Biological media | ||||
|
| ||||
| Solution | pH | k (min−1) | Half-Life | |
|
| ||||
| Cell culture media | 7.6 | 0.78 | 52 | s |
| Simulated intestinal Fluid | 5.8 | 0.015 | 46 | min |
| Soy lecithin (0.25:1) | 7.3 | 0.66 | 63 | s |
| Soy lecithin (1:1) | 7.3 | 0.59 | 70 | s |
| Soy lecithin (4:1) | 7.3 | 0.26 | 160 | s |
As shown in Figure 4, there was a linear relationship (R2 = 0.997) between the logarithm of the first-order rate constant for CEE conversion to CRN over the pH range of 2.5–8.0. Rate data at pH 1.0 did not correlate with the linear relationship observed at the higher pH values confirming an alternative intermolecular ester hydrolysis mechanism in highly acidic conditions. Limited data collected at pH 9.5 and 10.0 indicated that the rate of CEE cyclization to CRN continued to increase with increasing pH although accurate kinetic data could not be obtained using proton NMR due to the rapid rate of degradation under these high pH conditions.
FIGURE 4.
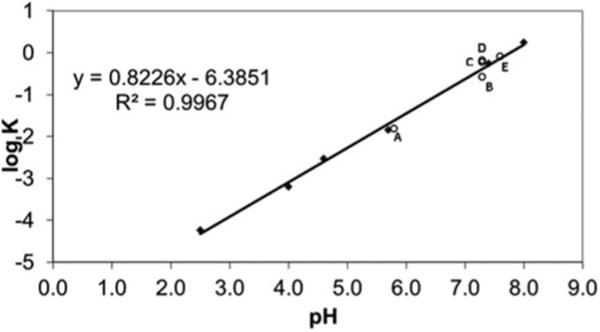
Linear plot of log K versus pH of buffered aqueous solutions in relation to (A) simulated intestinal fluid, (B) soy lecithin 4:1, (C) soy lecithin 1:1, (D) soy lecithin 0.25:1, and (E) cell culture media.
CEE Stability in Biological Media
Rates of CEE degradation in cell culture media and SIF were predominantly a function of pH of the media and correlated well with data obtained in aqueous buffered solutions of similar pH (Table 1). The addition of soy lecithin to CEE in 0.25:1 and 1:1 molar ratios did not affect the CEE degradation rate; however, the corresponding 4:1 molar ratio solution resulted in a significantly reduced rate of CEE conversion to CRN and raises the possibility that CEE is more stable upon absorption into more lipophilic cell membranes or binding to lipids in the bloodstream. The half-life of CEE in the 4:1 molar ratio soy lecithin solution was approximately 2-fold higher than that in aqueous solution at the same pH.
Despite a previous qualitative NMR study describing an esterase-mediated degradation of CEE to CRN in human plasma (Giese and Lecher, 2009b), we suggest that the degradation of CEE does not depend on esterases. First, the product of CEE degradation in plasma is CRN, not CRT, and second, the degradation rate in plasma is similar to that in aqueous solution of equal pH. In contrast to a report (Child & Tallon, 2007) suggesting that CEE is unstable at low pH, our data clearly demonstrates that CEE hydrolyzes relatively slowly (half-life = 570 hr) to CRT at pH 1, consistent with previous (Katseres et al., 2009) data (half-life = 528 hr). The stability of CEE in the pH environment of the stomach-half-lives of 570 and 200 hr at pH at 1.0 and 2.5, respectively, indicates that CEE could potentially be absorbed intact as the ethyl ester pronutrient and remain relatively stable throughout much of the small intestine up to approximately pH 6. The relative stability of CEE at gastric pH provides a rationale for potentially enhancing GI absorption of CEE by administration with food to delay gastric emptying, thereby promoting gastric absorption of intact CEE and slowing delivery of CEE to the higher pH environment of the small intestine where it would be less stable. While GI absorption for CEE has not been established in vivo, permeability studies conducted in Caco-2 monolayers, a commonly used cell culture model for intestinal absorption (Angelis & Turco, 2011), demonstrate that CEE is considerably more permeable than either CRT monohydrate or CRN (Table 2).
TABLE 2. Permeability properties of CRT, CRN, and CEE in biological membranes.
| Creatine (CRT) | Creatinine (CRN) | Creatine Ethyl Ester (CEE) | ||||
|---|---|---|---|---|---|---|
|
|
|
|
||||
| Biological Preparation | 10−6 cm/s | % Flux2 | 10−6 cm/s | % Flux2 | 10−6 cm/s | % Flux2 |
| Caco-2 Monolayers3 | 0.12 ± 0.004 | 0.80 ± 0.02 | 4.3 ± 0.46 | |||
| Porcine skin4 | BDL5 | 2.8 ± 0.5 | 12.4 ± 2.17 | |||
Apparent permeability coefficient (Pe).
% Flux over a 6 hr period.
Resulting values represent the mean ± SEM of n = 3 per treatment group.
Resulting values represent the mean ± SEM of 6 skin preparations per treatment group.
below detection limits (BDL).
p < .05 compared to CRT and CRN treatment groups.
p < .05 compared to the CRN treatment group.
CEE Permeability
Of the three compounds examined, CEE had the highest permeability in Caco-2 monolayers. Rank order permeability in Caco-2 monolayers was CRT < CRN < CEE, with CEE having 15-fold greater permeability than CRT monohydrate (Table 2). Examination of samples removed from the donor compartment at the end of the permeability study showed no appreciable breakdown of CRT, CRN, or CEE. In contrast, CRN was detectable in the receiver compartment from the CEE treatment group. As there was no CRN detectable in the donor compartment, the CRN present in the receiver compartment is most likely due to cyclization of CEE in the receiver compartment. This is consistent with the pH dependent cyclization observed in the aqueous stability studies.
Discussion
The low-CRT permeability in the present study is similar to that reported previously with various CRT salt forms (Gufford et al., 2010). The increased permeability of CEE in the present study is most likely due to enhanced passive diffusion through the cell monolayer. In support of this, the transdermal permeability of CEE was also significantly greater than that of CRT or CRN (Table 2). While the dermal preparation used was structurally intact, with strateum corneum and epidermal layers, the cells were nonviable. Thus, improved penetration of CEE compared to CRT in this preparation would be the result of increased passive diffusion. Enhanced lipophilicity in vitro indicates that CEE partitions into the lipid cell membrane environment to a greater extent than the parent CRT. Together, these studies indicate that CEE has improved permeability across epithelial absorption barriers compared to CRT.
Other investigators attempting to unveil the viability of CEE as an ergogenic aid in humans (Child & Tallon, 2007; Spillane et al., 2009; Velema & de Ronde, 2011) have concluded that CEE supplementation results only in large increases in serum CRN levels. Given the rate of hydrolysis observed with CEE at neutral pH, the methods used to collect, store, and analyze clinical samples would certainly result in conversion of any intact CEE to CRN. It is interesting to note that despite this, the effects of CEE on muscle performance were similar to that observed in the CRT monohydrate supplementation group (Spillane et al., 2009). This suggests that CEE may be present in various cellular compartments, or that CRN may have unanticipated physiological or pharmacological effects. In support of this, recent findings demonstrate that both CRT and CRN decrease expression of toll-like receptors in macrophages whereas CEE increases expression of toll-like receptors (Leland, McDonald, & Drescher, 2011).
Given the instability of CEE in the bloodstream at neutral pH, the rate at which CEE partitions from the bloodstream into the more favorable cellular lipid environment of the tissue for activation (hydrolysis) and utilization is critical to the unique attributes of CEE as a dietary supplement. However, because CEE is sufficiently stable in the pH range of the gastrointestinal tract, it is likely that the rate and extent of absorption as well as the ultimate fate of intact CEE has been underestimated. Further studies are needed to elucidate this process and to characterize the complete in vivo pharmacokinetic profile of CEE using human dosing of isotopically labeled CEE. However, the present findings suggest a potential improvement in CEE absorption in the GI tract compared to CRT alone.
Acknowledgments
We thank Dr. Eric C. Johnson of Bruker Biospin Corporation for his helpful suggestions in pulse programming the psuedo 2D kinetic NMR sequence.
This work was supported in part by UNeMed and Public Health Service Grant R43-AT1145.
The Nebraska Research Initiative provided the funds to purchase the Bruker Avance III 400 MHz NMR spectrometer.
Footnotes
Declaration of interest: The authors report no conflicts of interest. The authors alone are responsible for the content and writing of this paper.
References
- Adriano E, Garbati P, Damonte G, Salis A, Armirotti A, Balestrino M. Searching for a therapy of creatine transporter deficiency: Some effects of creatine ethyl ester in brain slices in vitro. Neuroscience. 2011;199:386–393. doi: 10.1016/j.neuroscience.2011.09.018. [DOI] [PubMed] [Google Scholar]
- Angelis ID, Turco L. Caco-2 cells as a model for intestinal absorption. Curr Protoc Toxicol. 2011;20:1–15. doi: 10.1002/0471140856.tx2006s47. [DOI] [PubMed] [Google Scholar]
- Bird SP. Creatine supplementation and exercise performance: a brief review. J Sports Sci Med. 2003;2:123–132. [PMC free article] [PubMed] [Google Scholar]
- Buford TW, Krider RB, Stout JR, Greenwood M, Campbell B, Spano M, Ziegenfus T, Lopez H, Landis J, Antonio J. International Society of Sports Nutrition position stand: creatine supplementation and exercise. J Int Soc Sports Nutr. 2007;4:6. doi: 10.1186/1550-2783-4-6. [DOI] [PMC free article] [PubMed] [Google Scholar]
- Child R, Tallon MJ. Creatine ethyl ester rapidly degrades to creatinine in stomach acid. 4th Annual ISSN Meeting. International Society of Sports Nutrition (ISSN) 4th Annual Meeting; Las Vegas, NV, USA. 2007. [Google Scholar]
- Diamond BJ. Thesis submitted to The Graduate College of Marshall University. Marshall University; Huntington, WV, USA: 2005. Temperature and pH dependence of the cyclization of creatine: a study via mass spectrometry. [Google Scholar]
- Edgar G, Shiver HE. The equilibrium between creatine and creatinine in aqueous solution. The effect of hydrogen ion. J Am Chem Soc. 1925;47:1179–1188. [Google Scholar]
- Edgar G, Wakefield RA. The kinetics of the conversion of creatine into creatinine in hydrochloric acid solutions. J Am Chem Soc. 1923;45:2242–2245. [Google Scholar]
- Giese MW, Lecher CS. Non-enzymatic cyclization of creatine ethyl ester to creatinine. Biochem Biophys Res Commun. 2009a;388:252–255. doi: 10.1016/j.bbrc.2009.07.151. [DOI] [PubMed] [Google Scholar]
- Giese MW, Lecher CS. Qualitative in vitro NMR analysis of creatine ethyl ester pronutrient in human plasma. Int J Sports Med. 2009b;30:766–770. doi: 10.1055/s-0029-1231045. [DOI] [PubMed] [Google Scholar]
- Gufford BT, Sriraghavan K, Miller NJ, Miller DW, Gu X, Vennerstrom JL, Robinson DH. Physicochemical characterization of creatine N-methylguanidinium salts. J Diet Supp. 2010;7:240–252. doi: 10.3109/19390211.2010.491507. [DOI] [PubMed] [Google Scholar]
- Johnson CD. Stereoelectronic effects in the formation of 5- and 6-membered rings: the role of Baldwin's rules. Acc Chem Res. 1993;26:476–482. [Google Scholar]
- Katseres NS, Reading DW, Shayya L, DiCesare JC, Purser GH. Non-enzymatic hydrolysis of creatine ethyl ester. Biochem Biophys Res Commun. 2009;386:363–367. doi: 10.1016/j.bbrc.2009.06.037. [DOI] [PubMed] [Google Scholar]
- Kohler F. Buffer solutions. In: Diem K, Lentner C, editors. Geigy scientific tables. 7th. Basel: Ciba-Geigy Ltd.; 1970. pp. 280–282. [Google Scholar]
- Leland KM, McDonald TL, Drescher KM. Effect of creatine, creatinine, and creatine ethyl ester on TLR expression in macrophages. Int Immunopharmacol. 2011;11:1341–1347. doi: 10.1016/j.intimp.2011.04.018. [DOI] [PMC free article] [PubMed] [Google Scholar]
- Miller DW, Hinton M, Chen F. Evaluation of drug efflux transporter liabilities of darifenacin in cell culture models of the blood-brain and blood-ocular barriers. Neurourol Urodyn. 2011;30:1633–1638. doi: 10.1002/nau.21110. [DOI] [PubMed] [Google Scholar]
- Mold JD, Gore RC, Lynch JM, Schantz EJ. Creatine ethyl ester. J Am Chem Soc. 1955;77:178–180. [Google Scholar]
- Persky AM, Brazeau GA, Hochhau Pharmacokinetics of the dietary supplement creatine. Clin Pharmacokinet. 2003a;42:557–574. doi: 10.2165/00003088-200342060-00005. [DOI] [PubMed] [Google Scholar]
- Persky AM, Muller M, Derendorf H, Grant M, Brazeau GA, Hochhaus G. Single- and multiple-dose pharmacokinetics of oral creatine. J Clin Pharmacol. 2003b;43:29–37. doi: 10.1177/0091270002239703. [DOI] [PubMed] [Google Scholar]
- Portmans JR, Auquier H, Renaut V, Durusel A, Saugy M, Brisson GR. Effect of short-term creatine supplementation on renal responses in men. Eur J Appl Physiol Occup Physiol. 1997;76:566–567. doi: 10.1007/s004210050291. [DOI] [PubMed] [Google Scholar]
- Schedel JM, Tanaka H, Kiyonaga A, Shindo M, Schutz Y. Acute creatine ingestion in human: consequences on serum creatine and creatinine concentrations. Life Sci. 1999;65:2463–2470. doi: 10.1016/s0024-3205(99)00512-3. [DOI] [PubMed] [Google Scholar]
- Spillane M, Schoch R, Cooke M, Harvey T, Greenwood M, Kreider R. Willoughby DS. The effects of creatine ethyl ester supplementation combined with heavy resistance training on body composition, muscle performance, and serum and muscle creatine levels. J Int Soc Sports Nutr. 2009;6:6. doi: 10.1186/1550-2783-6-6. [DOI] [PMC free article] [PubMed] [Google Scholar]
- Terjung R, Clarkson P, Eichner R, Greenhaff PL, Hespel PJ, Israel RJ, Kraemer WJ, Meyer RA, Spiet LL, Tarnopolsky MA, Wagenmakers AJM, Williams MH. The physiological and health effects of oral creatine supplementation. Med Sci Sports Exerc. 2000;32:706–717. doi: 10.1097/00005768-200003000-00024. [DOI] [PubMed] [Google Scholar]
- Velema MS, de Ronde W. Elevated plasma creatinine due to creatine ethyl ester use. Neth J Med. 2011;69:79–81. [PubMed] [Google Scholar]
- Vennerstrom JL. US Patent NO. 6,897,334. Production of creatine esters using in situ acid production. 2005