Abstract
Tuberculosis (TB) has been a major public health problem, which can be better controlled by using accurate and rapid diagnosis in low-resource settings. A simple, portable, and sensitive detection method is required for point-of-care (POC) settings. This paper studies an amperometric biosensor using a microtip immunoassay for a rapid and low cost detection of Mycobacterium Tuberculosis (MTB) in sputum. MTB in sputum is specifically captured on the functionalized microtip surface and detected by electric current. According to the numerical study, the current signal on microtip surface is linearly changed with increasing immersion depth. Using a reference microtip, the immersion depth is compensated for a sensing microtip. On the microtip surface, target bacteria are concentrated and organized by a coffee ring effect, which amplifies the electric current. To enhance the signal-to-noise ratio, both the sample processing- and rinsing steps are presented with use of deionized water as a medium for the amperometric measurement. When applied to cultured MTB cells spiked into human sputum, the detection limit was 100 CFU/mL, comparable to a more labor-intensive fluorescence detection method reported previously.
1. Introduction
Tuberculosis (TB) has become one of the top public health threats, resulting in the second most deaths by an infectious disease after HIV. WHO estimates 8.7 million new cases of TB and 1.4 million deaths caused by TB in 2011.[1] Accurate and timely diagnosis has become a limiting factor in TB control. Assuming a point-of-care (POC) diagnostic of 100% accuracy, 625,000 annual deaths could be prevented.[2] A widely used TB diagnostic method is sputum smear microscopy, which provides low accuracy with demand for skilled personnel. Commercial and experimental methods target various biomarkers in serum, urine, sputum, and exhaled breath.[3–6] However, performance has been found unsatisfactory. The most promising development has been the Gene-Xpert system [7], which applies an advanced molecular detection method in sputum samples with an automated system. However, the system is costly and requires stable power supply, which may not be affordable in resource limited locations. Therefore, a simple and portable detection method that functions independently of laboratory infrastructure would facilitate rapid diagnosis in point-of-care (POC) settings.[8, 9]
For POC diagnosis, amperometric detection methods have attracted attention due to the simple and low-cost configuration. In addition, low power requirements render electrochemical detection highly attractive. The combination of amperometric system with a highly specific immunoassay shows great potential to create a simple diagnostic platform for Mycobacterium tuberculosis (MTB) detection.[10] For an amperometric sensor, the targets can be captured on an electrode surface functionalized with specific probes. The specific recognition between probe- and target molecules can be detected by the electrical signal.
An enzymatic voltammetric immunosensor using carbon electrodes has been developed for the detection of MTB antigen [11]. Monoclonal antibodies were immobilized on the electrode surface for specific capturing. For the detection, monoclonal antibodies against MTB were utilized to form sandwich immunocomplexes, which changed electrochemical signals. Wang et al. detected lipoarabinomanna antibody (anti-LAM) by using gold nanoparticles (AuNPs) labeling Staphylococcal protein A as the electrochemical tag.[12] However, the main challenge for amperometric sensors was a high background noise caused by non-specific binding in complex samples. The noise level increased with use of a high ionic concentration buffer. Since amperometric sensors were highly sensitive to surface conditions, the performance might not be predictable in real sample matrices because of nonspecific- binding and reactions of non-targeted particles including ions and protein molecules.
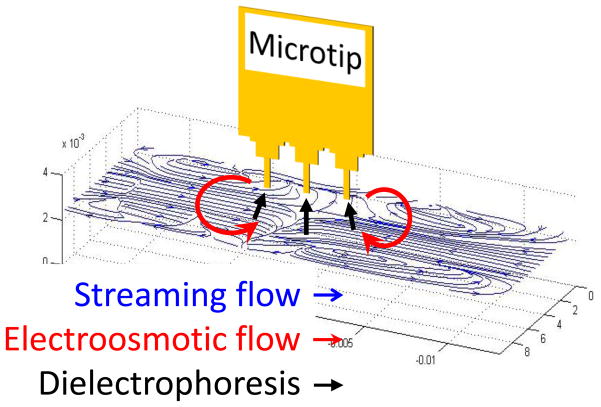
In our previous work, microtip immuno-fluorescence sensors have been demonstrated to detect low-concentration bacteria in sample mixtures of buffer and sputum.[13–16] Fig. 1 shows the working principle of a microtip immunosensor that could detect MTB in spiked sputum at a concentration of 100 CFU/mL. MTB cells were concentrated onto the immunosensor coated with antibodies by streaming flow and electric field. The captured MTB cells were detected by fluorescence signal from fluorescence-labeled antibodies. The sensitivity was comparable to PCR (polymerase chain reaction) based methods. However, the fluorescence detection scheme could be cumbersome for POC applications due to the need for fluorescence microscopy.
Fig. 1.
Concentration mechanism of target bacteria in 1 ml sputum samples using streaming flow, electroosmotic flow, and dielectrophoresis (DEP). The suspended bacterial particles were circulated and concentrated around the microtips by streaming flow and electroosmotic flow. Subsequently, the concentrated particles were attracted on the surface of the microtips by DEP. (Not drawn to scale).
When an electrical measurement is applied to the microtip sensor, the large surface area of the microtip presents a challenge. With increased electrode area, the electrical double layer on the microtip surface becomes dominant in the electric measurement, resulting in increased background noise. Enzymatic amplification can further enhance the signal but the limited number of targets at such a low concentration can limit the enhancement. In addition, complex components of sputum can significantly increase the background noise for the microtip sensor. Therefore, both signal amplification and background noise control are required for highly sensitive electrical measurement from complex samples.
In this paper, an electric detection of MTB is performed with the microtip through the signal amplification, which is achieved by the duplicated coffee-ring effect for the formation of immnuocomplex on the microtip surface. When a microtip is withdrawn from a sample solution, the captured bacteria have been aligned at the edge of the microtip by the capillary-induced concentration, which is a coffee-ring effect.[17] The fluorescence antibodies are enriched again due to the aligned bacteria on microtip surface. This coffee ring-induced immunocomplex formation amplifies the fluorescence- and electrical signals, which enables rapid, inexpensive diagnosis of infectious diseases. A microtip coated with capture antibodies is used for capturing target bacteria. A sample processing method compatible with complex sputum samples is presented to reduce background noise. As the medium for electric measurement, DI water is used to reduce non-Faradaic current, and thus increase signal-to-noise ratio. For calibration of electrical detection, the electric current on the microtip surface is analyzed with respect to the distance to the bottom of an aluminum well. Upon presence of target bacteria on the microtip surface, the current difference between the sensor and the reference tip is detected in deionized (DI) water.
2. Electrical Measurement Using a Microtip
For sensing target bacteria by electric measurement, the current change on an electrode surface due to the capturing of cells is detected. In order to obtain a high signal to noise ratio, various signal amplification approaches have been attempted.[18–22] However, most methods rely on electrochemical tags to enhance the signal, and the advantage can be lost due to high background levels in complex samples. The background noise can be increased by ions and other non-targeted molecules on the sensor surface in combination with an electrical double layer (EDL).
The surface charge and the ionic concentrations are important factors determining the properties of EDL, the zeta potential and the thickness of EDL. The thickness of EDL is dependent on medium properties such as ionic concentration. The functionalization process for electrodes can vary the surface charge, which results in the change of an EDL layer. In particular, human samples having various chemical, biological, and physical properties can hinder reliable amperometric detection. The unpredictable charges on the sensor surface can make EDL formation inconsistent.
To address this challenge, we developed (1) a method to process sputum samples with uniform composition for reducing the background noise, and (2) an amplification mechanism using a coffee ring effect to improve the signal to noise ratio. The specific pattern of fluorescence signal is imaged to study the amplification for an amperometric measurement. The combined effects of DEP- and coffee ring- induced concentration allow the signal amplification on a sharp edge of the microtip surface. Target bacteria are captured on the sharp edge by DEP due to the high strength of an electric field. Subsequently, both captured bacteria and detection antibodies are arranged on an antibody functionalized surface along the edge of the microtip due to the capillary action. The coffee ring-induced organization of bacteria and detection antibodies can enhance the fluorescence signals and the electrical signals (Fig. 2a).
Fig. 2.

(a) Illustration of a coffee-ring pattern of target bacteria and fluorescence antibodies on a microtip after labeling. (b) Illustration for electrical measurement setup; the electrical current of the sensor is compared with that of the reference microtip in order to compensate the distance between the microtips and the aluminum well. (c) Configuration of a microchip composed of 5 microtips. A microtip consists of three regions of Si chip, base and tip.
The measurement setup is composed of an aluminum well and a coupon that holds 2 microchips as shown in Fig. 2b. The target bacteria in sputum are captured on the sensor (the left microchip in Fig. 2b). The right microchip in Fig. 2b is a reference electrode. When bacterial cells are present on microchip surface, fluorescence antibodies in liquid are organized on the microchip surface with a ring pattern. Without target bacteria, much smaller amount of fluorescence antibodies is bound. The reference microchip is mainly used to compensate the distance between the microchip and the aluminum electrode. Using a voltage-current meter (Keithley 6487 Picoammeter), the difference of electric current between the sensing- and the reference microchips is measured in deionized (DI) water. Fig. 2c shows the configuration of a microchip. A microchip consists of 5 microtips, each of which is divided into three regions, Si chip, base and tip. On the sensor microchip, capture antibodies are coated with PEI (polyethyleneimine) and other layers as described in the experimental method section. The reference microchip is coated only with PEI. Since the gold surface is hydrophobic, the microchip is wet only in the area coated with the hydrophilic PEI layer, when the microchip is immersed in the DI water.
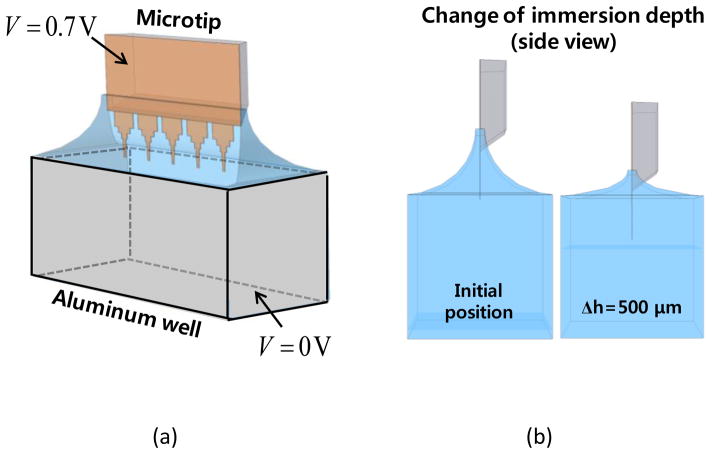
To analyze the sensitivity of the microchip according to the immersion depth and the microchip regions, the current density on the microchip surface was investigated by numerical computation using COMSOL Multiphysics®. A full model of the electrical detection setup was used as shown in Fig. 3a. In the numerical model, a microchip is composed of a 1 μm-thick Si3N4 layer on a Si chip. The microchip is immersed in the DI water contained in an aluminum well. The voltage of 0.7 V is applied on the surface of Si3N4 layer, and the aluminum well is grounded. The layers of gold and PEI coating on the microtip are not included in the model due to the relatively small thickness in comparison to the Si3N4 layer. The meniscus of liquid is modeled as concave shape to consider the hydrophilic surface of a PEI layer. Also, the area of microchip surface immersed in a solution is fixed to consider the interface between hydrophilic PEI- and hydrophobic gold layers.
Fig. 3.
(a) Numerical model of a microtip and an aluminum well (b) Side view of the model with two different immersion depths of microtip.
Figure 3b shows the meniscus change with the increase of immersion depth (h). The immersed area of microchip is the same as the immersion depth increases from 100 to 500 μm. In the simulation, Δh is changed from 0 to 500 μm with an increment of 50 μm. The parameters for the numerical analysis are summarized in Table 1. To compute the current density, the Poisson’s equation is solved with approximately 4,500,000 tetrahedral elements.
Table 1.
Parameters for the numerical analysis
| Material | Conductivity (S/m) | Relative permittivity | Thickness (μm) | |
|---|---|---|---|---|
| Microtip | Si | 1.0×10⁻⁴ | 11.7 | 300 |
| Si3N4 | 1.0×10⁻¹² | 8 | 5 | |
| Medium | DI water | 5.5×10⁻⁵ | 80 | - |
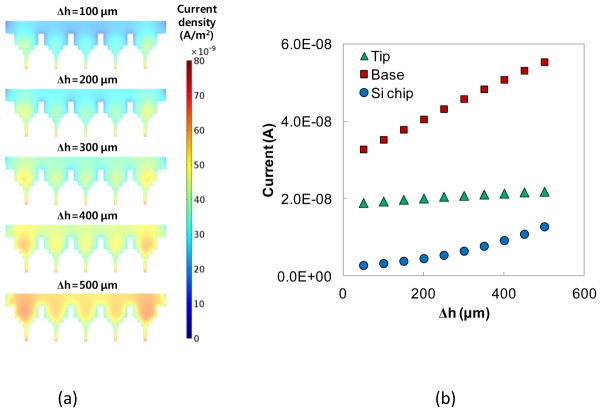
Figure 4a shows the distribution of the current density according to the immersion depth. To quantify the current flow through the different regions of a microchip, the surface integral of the current density was conducted at the three different regions, Si chip, base, and tip. The electric currents at the three regions are compared in Fig. 4b. With increase of Δh, each region shows the increase of current but the magnitude of the current increase is different. The base region has the largest change with a linear increase while the Si chip region shows the second largest change with a quadratic increase. The tip region shows the smallest change because the electric current is similar regardless of the electrode distance. As the distance is closer, the electric field increases at the tip region but the increase of the electric current is negligible.
Fig. 4.
(a) Distributions of current density norm at different immersion depths (b) Change of current flow through the microtip with the increase of immersion depth.
With respect to experiment, the fluorescence signal on the microtip should be increased at the base region due to the coffee ring effect. With presence of target cells, more detection antibodies are bound on the base region with the coffee ring effect, which can further amplify the electrical signal. In addition, the electrical current linearly increases as the microchip approaches the aluminum well. Therefore, using a reference chip, the gap distance should be compensated. However, the linear relationship between the distance and the electrical current may not maintain when the meniscus crosses the interface of PEI and gold layers. In the following experiments, the relationship between the electrical current and the distance was studied to validate the compensation due to the distance between the microchip and the aluminum well. The relationship between the fluorescence signal and the electrical current was also analyzed to evaluate the detection limit.
3. Experimental Method
3.1 Microtip fabrication and functionalization
Microtip fabrication
An array of microtips was fabricated by a microfabrication technique.[13, 15] A 1 μm-thick silicon nitride (Si3N4) film was deposited onto a 100 mm-Si wafer. A window was patterned on the Si3N4 film through UV lithography and reactive ion etching (RIE). To make a cantilever, the wafer was then immersed in a potassium hydroxide (KOH) bath to anisotropically etch through the Si wafer. Subsequently, a microtip cantilever was patterned by UV lithography and RIE on the other side of Si3N4 film. Finally, the microtip surface was coated with a 30 nm-thick gold layer by electron beam evaporation for electrical conductivity and biological functionalization.
Functionalization of microtips
For the specific capturing of target bacteria, the microtips were coated with multiple reagents by a dipping method. First, polyethyleneimine (PEI, 1%, Sigma-Aldrich) was coated to form an adhesive layer. Since PEI was cationic, the negatively charged proteins were attracted to the microtip surface. The coated microtip was cured at 175 °C for an hour. Subsequently, the PEI-coated microtips were immersed in biotinylated bovine serum albumin (biotin-BSA, 10mg/mL in PBS, Sigma-Aldrich) for 5 minutes. The biotin-BSA was bound with streptavidin (1mg/mL in PBS, Sigma-Aldrich) for 1 minute. Finally, the microtip surface was functionalized with the biotinylated IgY antibodies. The antibodies were raised against MTB complex cells.[13–16]
3.2 Amperometric characterization of microtip sensor
The relationship between electric current and electrode distance was studied to validate the compensation method for the distance between the microchip and the aluminum well. The PEI-coated microchip was loaded into the measurement device, and voltage potential of 0.7 V was applied between the microchip and the well. Subsequently, the microchip was continuously immersed into 30 μL DI water at the rate of 100 μm/s with current being measured at a sampling rate of 3 Hz. Video was also recorded with frames being matched with the current reading.
3.3 Concentration and detection procedure
The experimental procedure has three parts: (1) sample processing, (2) cell capturing, and (3) electrical measurement and signal analysis.
Sputum processing
Fig. 5 shows the sputum processing protocol. Human sputum was purchased from Bioreclamation, LLC (Westbury, NY) and stored in 300 μl aliquots in cryogenic tubes at −80°C until use. Prior to running experiments, frozen samples were thawed at room temperature and spiked with cultured bacteria where indicated. Sputum was processed to make the sample matrix uniform and to inactivate bacteria. Briefly, 600 μL of spiked sputum (300 μL of sputum with 300 μL of bacterial cell suspension suspended in PBS) was mixed with 300 μL each of NaOH solution (0.4M), sodium dodecyl sulfate solution (4% SDS), and 15 glass beads (3mm diameter). The mixture was heated at 60 °C for 10 min then vortexed at 1400 rpm for 5 min. Subsequently, 1mL was extracted from the mixture and 250 μL of HEPES buffer (1M) was added to neutralize the NaOH.
Fig. 5.
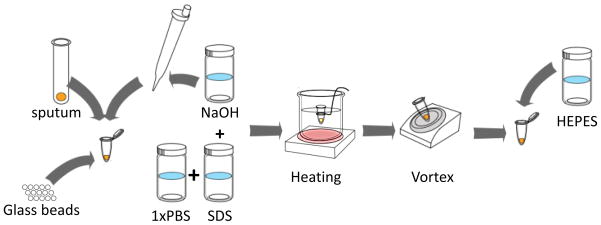
Sputum processing protocol
Cell concentration and capturing
To test the performance of the sensor, MTB was spiked in sputum at concentrations of 102 to 105 CFU/mL with 10 fold increments. Prior to tests, the samples were validated not to contain Mycobacterium tuberculosis complex DNA by the method of Halse et al. [23] MTB complex cells (strains H37Ra and BCG Russia) were cultured in Difco Middlebrook 7H9 Broth (BD Diagnostics, Sparks, MD) supplemented with 10% (v/v) ADC enrichment and 0.05% Tween 20. Out of the total mixture, 1mL was transferred to the well for testing. The processed sputum samples were fairly uniform based on our previous analysis.[13]
Concentration and fluorescence labeling
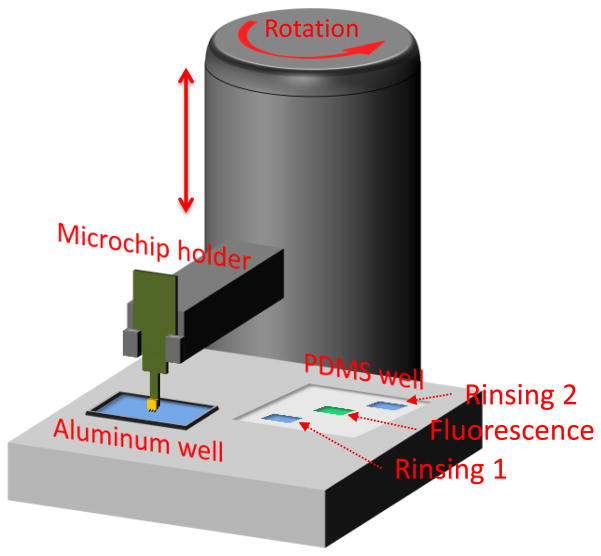
Both concentration and labeling were conducted using a microtip immunosensor.[15] The microtip device was constructed for rapid identification of MTB in sputum samples (Fig. 6). Polyclonal IgY antibodies were immobilized on the microtip surface. The device had a disposable aluminum well to hold the treated sputum. In addition, a PDMS well held the rinsing solutions of DI water and SDS solutions (1% in DI water) as well as the fluorescent antibodies for labeling. A vibration motor, which was integrated under the aluminum well, was activated during the capture process. The position of the microtip sensor was precisely controlled by two linear motors.
Fig. 6.
Device configuration for concentration and fluorescence labeling
The operation began with the functionalized microtip sensor being immersed into aluminum well containing 1 mL of treated sputum. Cells were concentrated to the microtip sensor for 2 minutes by a circulating flow produced from mechanical vibration, working in combination with electrokinetics from an applied AC field (20Vpp at 5 MHz).[13] With the withdrawal of microtips from the sample mixture, the concentration and capturing steps were completed. The microtip with captured cells was rinsed in SDS solution (1% in DI water) to remove non-specific cells that were not bound to immobilized antibodies. The tip was then transferred to the fluorescent antibody solution (10 μL, 2 mg/mL) where the remaining cells were labeled. Lastly, the microtip was rinsed in DI water to remove unbound fluorescent antibodies.
Fluorescence detection and analysis
The fluorescence images of microtips (100X total magnification) were captured under a fluorescence microscope (Olympus BX-41, Olympus America Inc., Melville, NY). Fluorescence intensity on the microtip surface was measured and analyzed through image processing. To enhance the signal-to-noise ratio, the raw fluorescence image was digitized into a white and black image based on threshold intensity. The threshold value was determined in order to suppress most negative control signals.
Amperomtery and signal analysis
Amperometric measurement was conducted using the device in Fig. 2B and a picoammeter (Keithley 6487) to measure the current at 0.7 V. The device consisted of an aluminum well and a coupon which held the sensor microchip and a reference microchip. To ensure equal distance to the well counter electrode, the microchips were loaded onto the coupon having a stopper. The reference microtip was coated with 1 % PEI and allowed to cure at 175 °C for 2 min on a hot plate. Both sensor- and reference microtips were lowered into the aluminum well containing 30 μL of DI water, such that the capture region of the sensing microtip could be immersed (Figure 3). Electric current was measured while voltage was scanned from 0 to 1 V. The electric current for the microtip sensor (I) was measured while the reference was isolated from ground, then likewise for the reference microtip. The signal was normalized according to (I − Io)/Io, where Io was the current from the reference microtip.
4. Results and Discussion
4.1 Amperometric characterization of microtip sensor
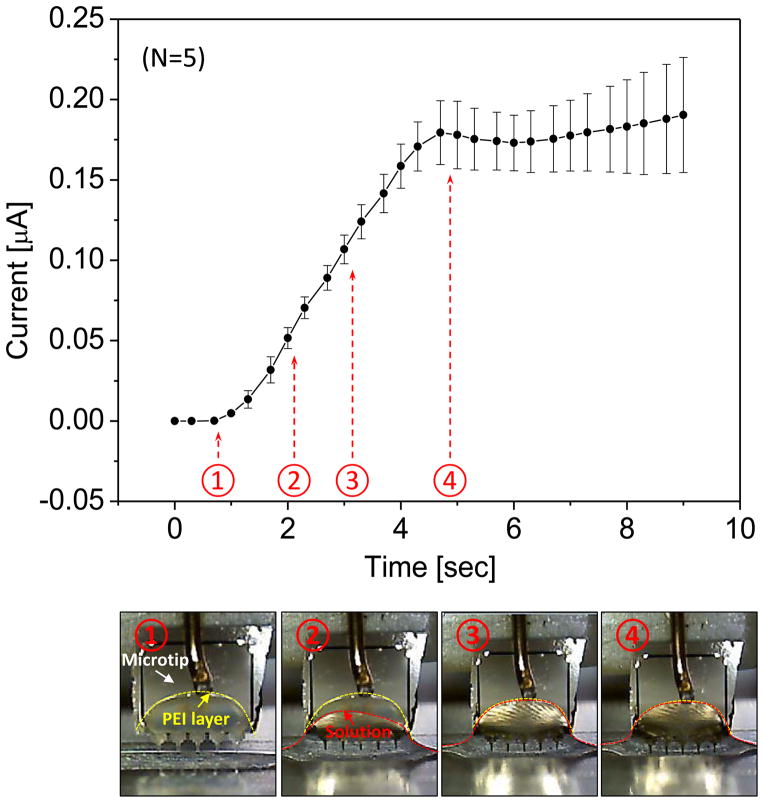
The relationship between current magnitude and electrode distance in DI water was characterized by using a reference microchip that was coated with PEI. DI water was chosen to reduce a signal variation due to the change of ionic concentration with evaporation of liquid. When DI water was used, a stable signal could be obtained, which was only dependent on the immersion depth of the microtip. As the immersion depth increased, the electric current linearly increased because of the shorter distance between the microtip and the sample well (Fig. 6). However, the linear relationship between the distance and the electrical current was not maintained when the meniscus crossed the interface of PEI- and gold layers. The compensation using a reference chip could be effective before the gold surface on the microchip was wet. The current readout was recorded and matched with the recorded video frames (Fig. 6). Capillary action formed a boundary over the PEI coated portion of the microtip in 1 second because of the hydrophilic surface of PEI. After the initial stage, the electrode-solution interface remained unchanging for the remainder of the current measurement. Since the wet area of the electrode remained constant, the increase in current resulted from the smaller gap size between the microtip and the well. The measurement showed a linear relationship with a slope of 0.35 nA/μm, which qualitatively agreed with our simulation results. Therefore, the gap distance could be compensated with a reference chip as long as the meniscus stayed on PEI layer.
Fig. 6.
Current measurement as microtip is approaching the bottom of the well filled with DI water. The bottom images show the meniscus change with time sequence.
4.2 Concentration and detection
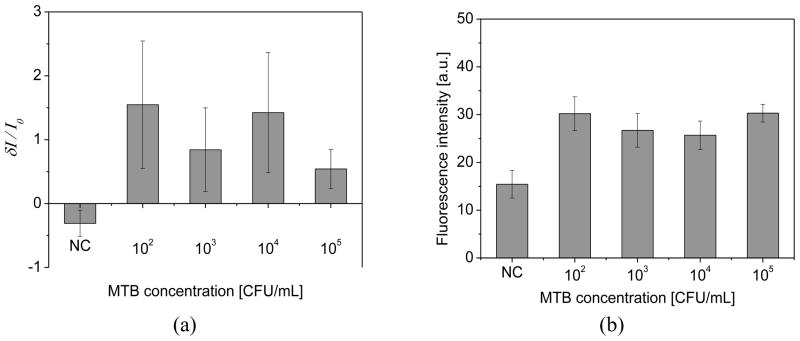
To test the performance of the sensor, the dose response test was conducted at concentrations of 102 ~ 105 CFU/mL for MTB by 10 fold increments (Fig. 7). When target cells were present, the current of a microtip sensor (I) was greater than the reference microtip (Io), resulting in a positive value of the normalized current, (I − Io)/Io (Fig. 7a). The ratio of current was negative when target cells were not present. Thus, when a normalized current was greater than 0, the sample was positive. When the normalized current was equal to or smaller than 0, the sample was negative. While the detection limit of the device was 102 CFU/mL, the signal did not give quantitative information about cell concentration. The positive samples yielded signals that fell into a similar range regardless of concentration.
Fig. 7.
(a) Amperometric signal (n=3) for various concentration of MTB in sputum. For control, the normalized current showed negative value because the current of a microtip sensor was smaller than the reference microtip. (b) Dose response of MTB for fluorescence signal at base region of microtips (n=3)
To validate the amperometric measurements, fluorescence intensity was also measured at the microtip base region according to the previously developed test (Fig. 7b). [13–16] The measured fluorescence intensity was lowest for negative control (NC), with samples containing target bacteria all being greater. Positive and negative samples could be differentiated down to the limit of 102 CFU/mL. Thus, the detection limit of the rapid amperometric method was the same as for the more labor-intensive fluorescence detection method described previously. [13–16]
The non-quantitative signal can be explained by the coffee ring effect. In our prior characterization, target cells were aligned at the edge of a liquid drop due to specific binding.[17] In the previous experiments with a similar microtip sensor, the fluorescence signal at low cell concentrations was amplified by the evaporation of fluid after the tip was withdrawn from solution. Fig. 8 shows the fluorescence signals on microtip surface depending on the doses of MTB in sputum. A coffee ring pattern of fluorescein antibodies, which was significant at the base region, was observed by the bright fluorescence signals.
Fig. 8.

(a) SEM image of microtips (b) Fluorescence images of microtips for the electrical measurement. The dose response test is conducted at the concentration of 102~105 CFU/mL for MTB spiked in sputum by 10 fold increments.
Briefly, target cells were concentrated at the edge of microtip surface due to high DEP force. With the withdrawal of microtips from the solution, the cells retained in the liquid drop were aligned to the edge of the droplet by the capillary action. Once cells were captured onto the surface, subsequent immersion and retraction from solution resulted in a greater amount of suspended particles adsorbed at the outer boundary of the remaining fluid droplet. In this case, the presence of captured cells caused more fluorescein-conjugated antibody to be deposited at the edge of microtip. This amplification mechanism improved the detection limit at the expense of quantitative information about bacteria.
The detection mechanism is based on the current increase upon binding of fluorescent labeled antibodies, which contain electron-rich fluorescein. In addition, the measurement of current increase was enhanced by the amplification mechanism using a coffee ring effect. The amperometric signal corresponding to the fluorescence signal suggested the role of the fluorescein-conjugated detection antibodies. With captured target cells, the current for the microtip sensor was higher than that for the reference microtip due to the abundance of fluorescein particles, which enhanced the charge transfer on the surface of the microtip. For the negative control, the microtip sensor was covered with several layers of proteins, which reduced the current magnitude compared to the reference microtip. The detection antibodies without fluorescein were attempted to study the current change but the electrical signal was not consistent upon the binding.
For amperometric detection, the uniform treatment of the microtip surface was also crucial to the increased signal-to-noise ratio. The sputum samples showed significant variation in viscosity and components, but they were homogenized by the sputum processing step in Fig. 5. In particular, high ionic concentration buffers using NaOH and HEPES appeared effective to maintain the similar conductivities of buffers. The dilution ratio of sputum-to-reagents was 1:3, which could maintain similar viscosity and components of the processed sputum. In terms of the rinsing steps, the microtip was rinsed by DI water and SDS to maintain uniform surface. Using the linear motor, the dipping and withdrawal speed was precisely controlled to obtain uniform surface. At the detection step, DI water was used as a medium for the amperometric measurement, which could limit the mass transport and reaction kinetics on the microtip surface. [14] In the future, the concentration and detection device could be integrated into one device for a simple and rapid detection of TB diagnosis.
5. Conclusion
A rapid amperometric biosensor system was demonstrated for detection of MTB in sputum samples. Detection performance was comparable to molecular methods such as PCR and to our previously reported fluorescence detection method, with decreased time and cost per sample. The system relied on a focused amperometric measurement produced by a high electric field and a concave meniscus profile near the microtip area. Since detection antibodies were specifically captured on the microtip area, the electrical current upon the capture of MTB was increased. A dose response showed that the signal was discernible from the noise level down to 100 CFU/mL. The fluorescence signal was also measured, which was consistent with the electrical signal.
Acknowledgments
We gratefully acknowledge funding provided by an NSF Career Award (ECCS-0846454). Research reported in this publication was also supported by the National Institute of Allergy and Infectious Disease of the National Institutes of Health under award number R01 AI093418.
References
- 1.WHO. Global Tuberculosis Report 2012. 2013. [Google Scholar]
- 2.Keeler E, Perkins MD, Small P, Hanson C, Reed S, Cunningham J, Aledort JE, Hillborne L, Rafael ME, Girosi F, Dye C. Reducing the global burden of tuberculosis: the contribution of improved diagnostics. Nature. 2006;444:49–57. doi: 10.1038/nature05446. [DOI] [PubMed] [Google Scholar]
- 3.Jassal MS, Nedeltchev GG, Lee JH, Choi SW, Atudorei V, Sharp ZD, Deretic V, Timmins GS, Bishai WR. (13) C -Urea Breath Test as a Novel Point-of-Care Biomarker for Tuberculosis Treatment and Diagnosis. Plos One. 2010;5:e12451. doi: 10.1371/journal.pone.0012451. [DOI] [PMC free article] [PubMed] [Google Scholar]
- 4.Wallis RS, Pai M, Menzies D, Doherty TM, Walzl G, Perkins MD, Zumla A. Tuberculosis 4 Biomarkers and diagnostics for tuberculosis: progress, needs, and translation into practice. Lancet. 2010;375:1920–37. doi: 10.1016/S0140-6736(10)60359-5. [DOI] [PubMed] [Google Scholar]
- 5.Lawn SD, Edwards DJ, Kranzer K, Vogt M, Bekker LG, Wood R. Urine lipoarabinomannan assay for tuberculosis screening before antiretroviral therapy diagnostic yield and association with immune reconstitution disease. Aids. 2009;23:1875–80. doi: 10.1097/qad.0b013e32832e05c8. [DOI] [PubMed] [Google Scholar]
- 6.Agranoff D, Fernandez-Reyes D, Papadopoulos MC, Rojas SA, Herbster M, Loosemore A, Tarelli E, Sheldon J, Schwenk A, Pollak R, Rayner CFJ, Krishna S. Identification of diagnostic markers for tuberculosis by proteomic fingerprinting of serum. Lancet. 2006;368:1012–21. doi: 10.1016/S0140-6736(06)69342-2. [DOI] [PMC free article] [PubMed] [Google Scholar]
- 7.Boehme CC, Nabeta P, Hillemann D, Nicol MP, Shenai S, Krapp F, Allen J, Tahirli R, Blakemore R, Rustomjee R, Milovic A, Jones M, O’Brien SM, Persing DH, Ruesch-Gerdes S, Gotuzzo E, Rodrigues C, Alland D, Perkins MD. Rapid Molecular Detection of Tuberculosis and Rifampin Resistance. N Engl J Med. 363:1005–15. doi: 10.1056/NEJMoa0907847. [DOI] [PMC free article] [PubMed] [Google Scholar]
- 8.Griffiths D, Hall G. Biosensors - What Real Progress Is Being Made. Trends Biotechnol. 1993;11:122–30. doi: 10.1016/0167-7799(93)90086-O. [DOI] [PubMed] [Google Scholar]
- 9.Owen VM. Market requirements for advanced biosensors in healthcare. Biosens Bioelectron. 1994;9:xxix–xxxv. doi: 10.1016/0956-5663(94)90024-8. [DOI] [PubMed] [Google Scholar]
- 10.Zhou LX, He XX, He DG, Wang KM, Qin DL. Biosensing Technologies for Mycobacterium tuberculosis Detection: Status and New Developments. Clin Dev Immunol. 2011;2011:193963. doi: 10.1155/2011/193963. [DOI] [PMC free article] [PubMed] [Google Scholar]
- 11.Diaz-Gonzalez M, Gonzalez-Garcia MB, Costa-Garcia A. Immunosensor for Mycobacterium tuberculosis on screen-printed carbon electrodes. Biosens Bioelectron. 2005;20:2035–43. doi: 10.1016/j.bios.2004.09.035. [DOI] [PubMed] [Google Scholar]
- 12.Wang LS, Leng C, Tang S, Lei JP, Ju HX. Enzyme-free signal amplification for electrochemical detection of Mycobacterium lipoarabinomannan antibody on a disposable chip. Biosens Bioelectron. 2012;38:421–4. doi: 10.1016/j.bios.2012.05.025. [DOI] [PubMed] [Google Scholar]
- 13.Kim JH, Yeo WH, Shu ZQ, Soelberg SD, Inoue S, Kalyanasundaram D, Ludwig J, Furlong CE, Riley JJ, Weigel KM, Cangelosi GA, Oh K, Lee KH, Gao DY, Chung JH. Immunosensor towards low-cost, rapid diagnosis of tuberculosis. Lab on a Chip. 2012;12:1437–40. doi: 10.1039/c2lc21131a. [DOI] [PubMed] [Google Scholar]
- 14.Kim JH, Hiraiwa M, Lee HB, Lee KH, Cangelosi GA, Chung JH. Electrolyte-free amperometric immunosensor using a dendritic nanotip. RSC Adv. 2013;3:4281–4287. doi: 10.1039/C3RA40262B. [DOI] [PMC free article] [PubMed] [Google Scholar]
- 15.Inoue S, Shu Z, Kim J-H, Hiraiwa M, Lakley A, Weigel K, Soelberg S, Furlong C, Cangelosi GA, Carins A, Lee HB, Oh K, Lee K-H, Gao D”J-HC. Semi-Automated, Occupationally Safe Immunofluorescence Microtip Sensor for Rapid Detection of Mycobacterium Cells in Sputum. Plos One. 2014;9:e86018. doi: 10.1371/journal.pone.0086018. [DOI] [PMC free article] [PubMed] [Google Scholar]
- 16.Kim JH, Inoue S, Cangelosi GA, Lee KH, Chung JH. Specific capture of target bacteria onto sensor surfaces for infectious disease diagnosis. Journal of Micromechanics and Microengineering. 2014;24:045009. [Google Scholar]
- 17.Kim JH, Shen AQ, Lee KH, Cangelosi GA, Chung JH. Contact angle changes induced by immunocomplex formation. Analyst. 2014;139:1340–4. doi: 10.1039/c3an02189k. [DOI] [PMC free article] [PubMed] [Google Scholar]
- 18.Malhotra R, Patel V, Vaque JP, Gutkind JS, Rusling JF. Ultrasensitive Electrochemical Immunosensor for Oral Cancer Biomarker IL-6 Using Carbon Nanotube Forest Electrodes and Multilabel Amplification. Anal Chem. 2010;82:3118–23. doi: 10.1021/ac902802b. [DOI] [PMC free article] [PubMed] [Google Scholar]
- 19.Patolsky F, Lichtenstein A, Willner I. Detection of single-base DNA mutations by enzyme-amplified electronic transduction. Nat Biotechnol. 2001;19:253–7. doi: 10.1038/85704. [DOI] [PubMed] [Google Scholar]
- 20.Zhong ZY, Wu W, Wang D, Shan JL, Qing Y, Zhang ZM. Nanogold-enwrapped graphene nanocomposites as trace labels for sensitivity enhancement of electrochemical immunosensors in clinical immunoassays: Carcinoembryonic antigen as a model. Biosens Bioelectron. 2010;25:2379–83. doi: 10.1016/j.bios.2010.03.009. [DOI] [PubMed] [Google Scholar]
- 21.Ho JAA, Chang HC, Shih NY, Wu LC, Chang YF, Chen CC, Chou C. Diagnostic Detection of Human Lung Cancer-Associated Antigen Using a Gold Nanoparticle-Based Electrochemical Immunosensor. Anal Chem. 2010;82:5944–50. doi: 10.1021/ac1001959. [DOI] [PubMed] [Google Scholar]
- 22.Liu GD, Lin YY, Wang J, Wu H, Wai CM, Lin YH. Disposable electrochemical immunosensor diagnosis device based on nanoparticle probe and immunochromatographic strip. Anal Chem. 2007;79:7644–53. doi: 10.1021/ac070691i. [DOI] [PubMed] [Google Scholar]
- 23.Halse TA, Edwards J, Cunningham PL, Wolfgang WJ, Dumas NB, Escuyer VE, Musser KA. Combined Real-Time PCR and rpoB Gene Pyrosequencing for Rapid Identification of Mycobacterium tuberculosis and Determination of Rifampin Resistance Directly in Clinical Specimens. Journal of Clinical Microbiology. 2010;48:1182–8. doi: 10.1128/JCM.02149-09. [DOI] [PMC free article] [PubMed] [Google Scholar]


