Abstract
Sickle cell disease (SCD) is characterized by decreased erythrocyte deformability, microvessel occlusion and severe painful infarctions of different organs. Ektacytometry of SCD red blood cells (RBC) is made difficult by the presence of rigid, poorly-deformable irreversibly sickled cells (ISC) that do not align with the fluid shear field and distort the elliptical diffraction pattern seen with normal RBC. In operation, the computer software fits an outline to the diffraction pattern, then reports an elongation index (EI) at each shear stress based on the length and width of the fitted ellipse: EI = (length − width)/(length + width). Using a commercial ektacytometer (LORCA, Mechatronics Instruments, The Netherlands) we have approached the problem of ellipse fitting in two ways: (1) altering the height of the diffraction image on a computer monitor using an aperture within the camera lens; (2) altering the light intensity level (gray level) used by the software to fit the image to an elliptical shape. Neither of these methods affected deformability results (elongation index-shear stress relations) for normal RBC but did markedly affect results for SCD erythrocytes: (1) decreasing image height by 15% and 30% increased EI at moderate to high stresses; (2) progressively increasing the light level increased EI over a wide range of stresses. Fitting data obtained at different image heights using the Lineweaver–Burke routine yielded percentage ISC results in good agreement with microscopic cell counting. We suggest that these two relatively simple approaches allow minimizing artifacts due to the presence of rigid discs or ISC and also suggest the need for additional studies to evaluate the physiological relevance of deformability data obtained via these methods.
Keywords: Laser diffraction ellipsometry, diffraction pattern, sickle cell disease, irreversible sickled cells, sickle erythrocytes
1. Introduction
Cellular deformability, defined as the ability of a cell to adopt a new shape in response to deforming forces, is essential for microvascular tissue perfusion [11]. Several factors affect red blood cell (RBC) deformability, including cell geometry (i.e., membrane surface area to cell volume ratio), cell shape, the rheological properties of the cell membrane as determined by the cell’s cytoskeleton, and cytoplasmic viscosity related to the intracellular hemoglobin concentration [15,23]. Erythrocyte deformability can be studied using various methods, including bulk filtration of RBC suspensions, determination of cell transit time through micropore filters, complete aspiration of the entire cell into a micropipette, and by determining cell shape when exposed to defined shearing stresses [4,14,18]. The latter category utilizes two different but complementary approaches: (1) direct microscopic observation of single cells [10,13]; (2) ektacytometry in which a laser beam is projected through a dilute RBC suspension and the resulting diffraction pattern analyzed to determine RBC shape and hence a deformation index, also known as an elongation index [8,16,20].
Several commercial instruments employing ektacytometry now exist, and a comparison of their sensitivity and reproducibility has been published [4]. One of these instruments is the LORCA (Laser assisted optical rotational cell analyzer, Mechatronics Instruments BV, Zwaag, The Netherlands) [17]. The LORCA employs a Couette shearing system consisting of a stationary inner cylinder and a rotating transparent outer cylinder. The cylinders are separated by a ~0.370 mm gap and contain a dilute suspension of RBC in a viscous medium. A red laser beam is projected from the stationary inner cylinder through the RBC suspension in the gap and the resulting circular or elliptical diffraction pattern is projected onto a white screen. The image of this diffraction pattern is captured by a CCD video camera that has a lens with an adjustable aperture. The image is digitized and analyzed by a laboratory computer and proprietary software; the computer also controls the rotational speed of the outer cylinder. There are now numerous reports presenting LORCA elongation index-shear stress data for various human RBC and for cells from several other species [3,5].
Although the LORCA and other ektacytometers have been shown to provide useful and important information about RBC deformability in several clinical and experimental situations [4,9], they can be problematic when studying RBC populations with widely differing levels of deformability. Normal cells progressively deform with increasing fluid shear stress and yield elliptical diffraction patterns. However, “rigid” cells do not orientate with flow streamlines and do not deform into ellipses, but rather undergo rigid body rotation. The presence of these rigid cells causes a distortion of the expected elliptical diffraction pattern, resulting in an essentially circular diffraction pattern. The combined pattern of these two types of cells (i.e., normal and rigid) is an ellipse with a “bump” or bulge in its center and hence somewhat cross-shaped; fitting an ellipse to this pattern is problematic and can often lead to incorrect deformation-stress data.
At least two approaches to the analysis of such distorted diffraction patterns have been presented: (1) Streekstra and co-workers considered mixtures of oblate and prolate spheroids and used anomalous diffraction theory for spheroids to generate theoretical diffraction patterns for each. They then applied their method to a mixture of normal and chemically-fixed non-deformable human RBC and were able to determine the relative proportions of the two populations [25–27]; (2) A combination of Bessel and anomalous scattering functions plus a pattern-fitting technique was utilized over a wide range of shear stress (i.e., 0.5–50 Pa) for mixtures of normal and up to 50% of chemically-fixed non-deformable human RBC. This approach allowed determining the separate mechanical properties of normal and non-deformable cells and the fraction of rigid cells in the mixture [24]. Both approaches provide useful information, yet require extensive post-experimental mathematical treatment of the digitized diffraction pattern.
Distortion of the diffraction pattern is especially evident when studying RBC from subjects with sickle cell disease (SCD), a genetic-linked hemoglobinopathy due to a point mutation in the β-globin gene. The substitution of valine for glutamic acid in the sixth position creates sickle hemoglobin (HbS). Sickle hemoglobin undergoes a sol–gel transformation at low oxygen tensions, resulting in rigid sickle cells. Repeated in vivo cycles of oxygenation–deoxygenation result in cells that are distorted and rigid even when fully oxygenated; these rigid cells are termed irreversibly sickled cells (ISC) and have an elongated shape with a length to width ratio of two or greater.
During LORCA studies with oxygenated SCD blood an interesting phenomenon we observed. The distorted diffraction pattern became less cross-shaped and more elliptical as the aperture of the camera lens was made smaller. This observation suggested that it might be possible to obtain relevant LORCA results for SCD red cells simply by altering the size of the lens aperture. The current study was designed to obtain insight into this suggestion and to determine if the proportion of ISC in a blood sample could be determined by this approach.
2. Methods
2.1. Blood samples
Following informed consent, venous blood samples were obtained from 8 healthy adult donors and 23 subjects with (HbSS) sickle cell disease (SCD); the study was approved by the Human Subjects Institutional Review Board. The SCD population was not homogenous but rather consisted of individuals on hydroxyurea treatment, those involved in a chronic transfusion program receiving one unit of RBC every three weeks and individuals not receiving medical therapy specific to SCD. Note that SCD subject inclusion only required having homozygous HbS disease; subject inclusion was not designed to allow assessing differences between therapeutic methods (e.g., hydroxyurea vs. transfusion). Neither sickle cell trait nor alpha-thalassemia individuals were involved in this study.
Blood was drawn into commercial vacuum tubes and anticoagulated with EDTA (1.5 mg/ml). Cells were washed twice in isotonic PBS (290 mOsm/kg, pH = 7.4), then re-suspended at about 0.4 l/l hematocrit in PBS. The actual cell concentration in these suspensions was determined by an automated hematology analyzer (Micros 60, Horiba Co., Irvine, CA). Small aliquots of the RBC suspensions were treated with 0.5% glutaraldehyde in PBS and gently mixed; at this concentration, glutaraldehyde does not alter RBC volume or the biconcave shape and preserves cellular morphology for later microscopic analysis.
2.2. Ektacytometry of RBC
Erythrocyte deformation at 37°C over a 0.5–50 Pa shear stress range was evaluated using a LORCA (Mechatronics Instruments BV, Zwaag, The Netherlands) [17]. As described above (see Introduction), this ektacytometer employs a Couette shearing system with dilute RBC suspensions contained in the narrow gap between the cylinders. The stationary inner cylinder has a 670 nm red laser that passes through the suspension and projects the resulting diffraction pattern onto a screen; this screen image is captured by a CCD video camera and analyzed using software provided by the manufacturer. The lens used to image the diffraction pattern onto the video camera was part of the LORCA as supplied by the manufacturer: “television lens”, 8.5 mm focal length, 1:1.5 f-number.
RBC were suspended at ~2 × 10⁷ RBC/ml in an isotonic (296 ± 3 mOsm/kg) viscous solution of 70 kDa dextran (Sigma Chemical Co., St Louis, MO); the viscosity of the dextran solution was η = 31.4 mPa · s at 37°C. In operation, the computer software attempts to fit a circular or elliptical outline to the diffraction pattern, then reports an elongation index (EI) based on the length and width of the fitted ellipse: EI = (length − width)/(length + width), is zero for randomly oriented RBC, and increases with cell deformation.
2.3. LORCA adjustments
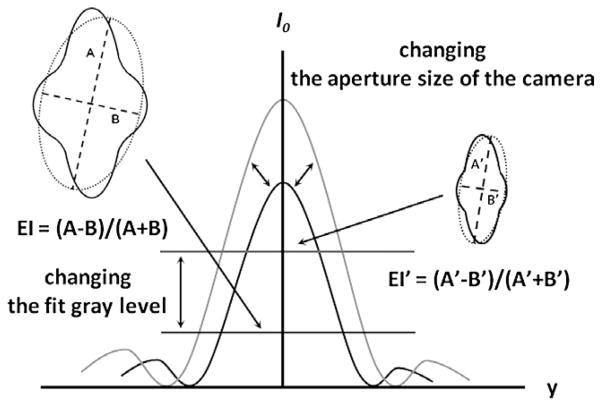
Two adjustments to the LORCA operation were used and are shown schematically in Fig. 1: (1) Altering the height of the digitized diffraction pattern as viewed on the computer monitor. The LORCA was briefly operated at maximum shear stress (i.e., 50 Pa) and the image height adjusted by changing the opening of the aperture in the camera lens. The image height was measured directly on the monitor using calibrated plastic strips at 50 Pa and standardized at 7 cm, termed the “control size”. The image height was then reduced by 15% or by 30% and deformability testing repeated. The 7 cm image height was selected based on several pragmatic considerations: (a) it was found to be an easily achievable size encompassing all of the RBC populations (i.e., deformable to very rigid); (b) it allowed height to be decreased in two steps while still yielding analyzable diffraction patterns; (c) use of a height greater than 7 cm resulted in pattern distortion due to the 1st order of the diffracted laser light. (2) Altering the light intensity level at which the computer fits the diffraction pattern. As shown in Fig. 1, light intensity has a characteristic pattern with a maximum at the center and decreasing intensities on either side. It is possible to select the vertical level at which the fit is attempted, termed the “fit gray level”, by designating the height at which a horizontal “slice” is analyzed; arbitrary height values are utilized, with higher fit gray levels being closer to the apex and hence fitting at higher levels of light (Fig. 1).
Fig. 1.
Schematic intensity pattern of diffracted laser light for sickle cell disease red blood cells at high shear (e.g., 50 Pa). The effects of both techniques used herein are illustrated: altering the image height via changing camera aperture or changing gray level (i.e., light intensity) used for fitting. The distorted diffraction pattern and the resulting EI are shown for control height or a low gray level (left drawing) with the pattern and resulting EI shown for reduced image height or higher gray level (right drawing).
2.4. Deformation – Shear stress analysis
Data from the LORCA are presented as tabulated EI values at nine pre-selected shear stresses (i.e., 0.5, 0.89, 1.58, 2.81, 5.0, 8.89, 15.8, 28.1 and 50 Pa). A Lineweaver–Burke approach was used to characterize these paired data sets; this method provides a calculated estimate of the maximum EI at infinite shear stress (EImax) [6]. In addition, an Error of Fit (EoF) value is provided at each shear stress. The EoF represents the average distance, in pixel units, of the iso-intensity pixels to the best-fit ellipse determined by the software. It reflects how well the iso-intensity coordinates comply with the ellipse model, and hence a closer agreement of the ellipse with the pattern yields lower EoF values.
Note that at low shear stresses, elongation index (EI) values can be “negative” due to some RBC (e.g., ISC) not being aligned with the fluid streamlines. Of course, a “negative” EI has no real meaning and only results from the protocol employed for image analysis and the equation used to calculate EI. In our shear stress – elongation index curve analysis, the non-linear regression form of the Lineweaver–Burke equation was used [6] and EI values below a stress of one Pa were not utilized in the calculation, thus avoiding possible artifacts related to negative values.
2.5. Determination of percent ISC
Percent ISC in a sickle cell disease RBC population was determined by phase contrast light microscopy. Cells fixed with glutaraldehyde (see Section 2.1) were diluted as necessary in order to avoid overlap when the suspension was introduced into a standard glass hemocytometer. At least 1,000 cells were evaluated and classified as ISC if the length to width ratio was two or greater.
2.6. Statistics
SPSS statistical software, version 11.0.1. was used to conduct descriptive analyses and to describe the sample. Differences were evaluated by a repeated ANOVA statistical test (Tamhane post-hoc test) after using the Kolmogorov–Smirnov test to check the normality of the data distribution. Bivariate-Pearson correlation analysis was performed with regard to connection between differences in EImax and ISC count. Data are shown as means ± SEM. Significance level was defined as p < 0.05.
3. Results
3.1. Normal RBC
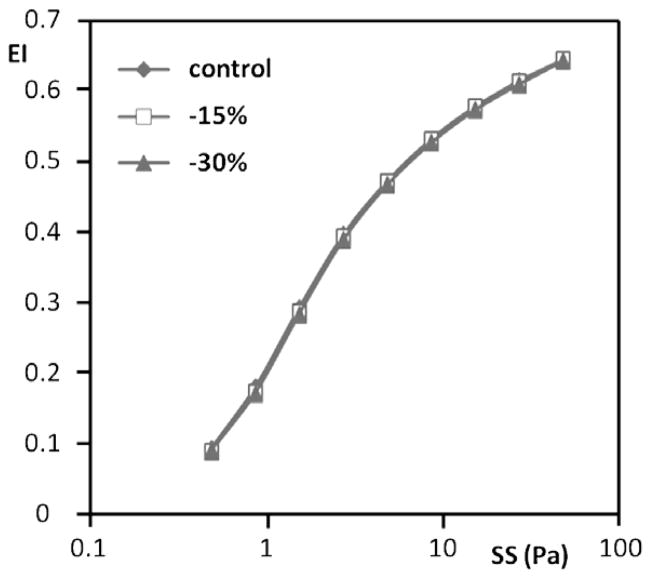
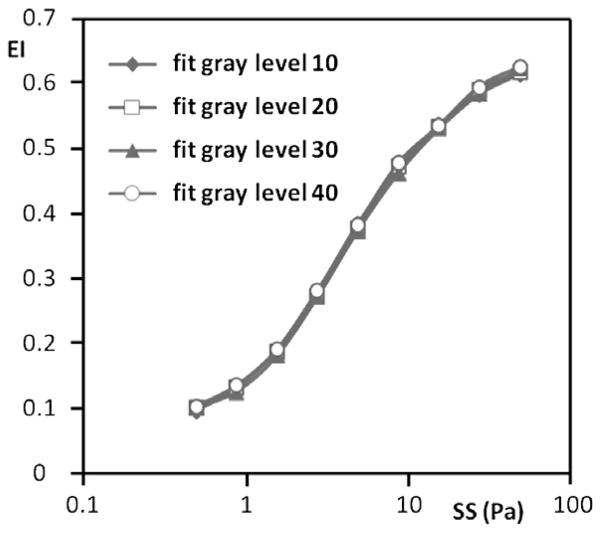
In order to assure that the operational adjustments to the LORCA did not alter or degrade data for normal, non-sickle RBC, these normal cells were tested at 15% and 30% reduction of image height and at various fit gray levels. Representative results are presented in Fig. 2 (reduced height) and Fig. 3 (vary gray level). As can be easily appreciated, neither changing image height nor fit gray level affected the EI-stress relations; accuracy in fitting the diffraction image (EoF) was also not affected (Table 1(A)). Thus, within the ranges used for image height adjustment and gray level, LORCA data for normal erythrocytes are not affected by these adjustments.
Fig. 2.
Representative elongation index (EI) versus shear stress (SS) results for normal RBC from a single donor obtained using different aperture settings and hence different image heights (control, 15% and 30% reduction). No differences were detected between these three heights.
Fig. 3.
Representative elongation index (EI) versus shear stress (SS) results for normal RBC from a single donor obtained using different gray level settings and hence different light intensities for fitting; an increased gray level indicates a higher light intensity. No meaningful differences were observed in the deformability results after changing the fit gray level.
Table 1.
Effects of image height on Error of Fit (EoF) results for: (A) normal subjects (n = 8); (B) sickle cell disease (SCD) subjects (n = 23)
| Image height | 0.50 (Pa) | 0.89 (Pa) | 1.58 (Pa) | 2.81 (Pa) | 5.00 (Pa) | 8.89 (Pa) | 15.8 (Pa) | 28.1 (Pa) | 50.0 (Pa) |
|---|---|---|---|---|---|---|---|---|---|
| (A) Effects of image height on EoF for normal red blood cells | |||||||||
| Control | 3.86 ± 0.07 | 3.64 ± 0.08 | 3.34 ± 0.06 | 3.14 ± 0.06 | 3.04 ± 0.07 | 3.06 ± 0.1 | 3.16 ± 0.11 | 3.11 ± 0.11 | 3.09 ± 0.11 |
| −15% | 3.52 ± 0.06 | 3.23 ± 0.04 | 3.06 ± 0.05 | 2.93 ± 0.06 | 2.85 ± 0.06 | 2.84 ± 0.06 | 2.8 ± 0.07 | 2.85 ± 0.09 | 2.8 ± 0.1 |
| −30% | 3.8 ± 0.06 | 3.45 ± 0.05 | 3.31 ± 0.07 | 3.21 ± 0.05 | 3.21 ± 0.07 | 3.16 ± 0.08 | 3.05 ± 0.09 | 3.03 ± 0.06 | 3.05 ± 0.12 |
| (B) Effects of image height on EoF for SCD red blood cells | |||||||||
| Control | 6.91 ± 0.64 | 5.94 ± 0.44 | 5.69 ± 0.29 | 6.33 ± 0.42 | 7.59 ± 0.66 | 9.14 ± 0.92 | 10.4 ± 1.12 | 11.5 ± 1.31 | 12.5 ± 1.45 |
| −15% | 4.49 ± 0.17 | 4.27 ± 0.17 | 4.43 ± 0.2 | 5.03 ± 0.33 | 5.91 ± 0.51 | 6.8 ± 0.69 | 7.61 ± 0.83 | 8.4 ± 1.01 | 9.28 ± 1.16 |
| −30% | 4.01 ± 0.16 | 3.73 ± 0.16 | 3.68 ± 0.17 | 3.96 ± 0.22 | 4.49 ± 0.33 | 5 ± 0.46 | 5.36 ± 0.54 | 5.71 ± 0.64 | 6 ± 0.73 |
Notes: The EoF (Error of Fit) represents the average distance in pixel units of the iso-intensity pixels to the best-fit ellipse determined by the software. It reflects how well the iso-intensity coordinates comply with the ellipse model. Data are mean ± SEM for the shear stresses used in this study. There was no meaningful effect for normal RBC (A), while EoF values decreased with decreasing height and increasing stress for sickle cell RBC (B): changing from control to 30% reduced height lowered EoF by ~40% up to about 5 Pa and by 50% at the four higher stresses.
3.2. Sickle RBC
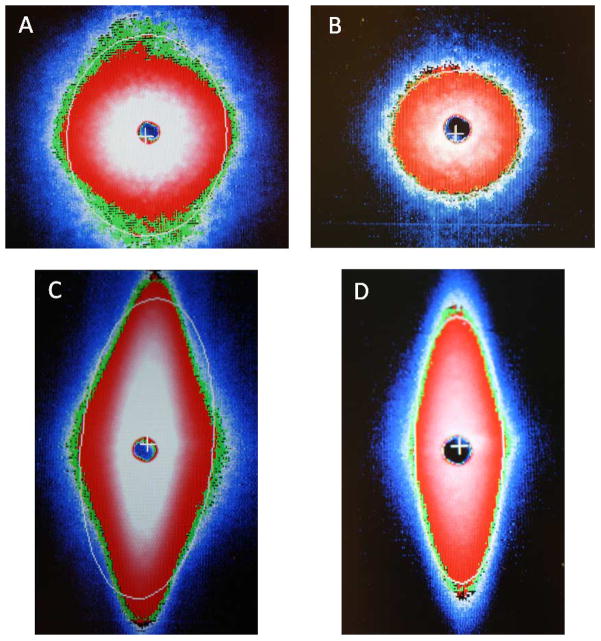
In contrast to results obtained with normal RBC, EI-shear stress relations were markedly affected by both image height and the gray level used for fitting. Representative diffraction images are presented in Fig. 4 for the same population of SCD RBC: (1) (A) and (B) were obtained at low stress (0.5 Pa) for control (panel A) and 30% reduced image height (panel B). Both images are essentially circular although the control fit is slightly elliptical while the 30% reduced height is well-fitted by a circle. (2) (C) and (D) were obtained at high stress (i.e., 50 Pa) for control (panel C) and 30% reduced height (panel D). There is a marked difference between the images and the fit provided by the system’s software, in that the control has a bulge at its horizontal axis and is poorly fitted such that the top and bottom portions are not part of the calculated fit. Conversely, a 30% reduction of height removes almost the entire bulge with the image well fitted as an ellipse.
Fig. 4.
Diffraction images and resulting fitting of the images (bright lines) for the same SCD red cell population at two levels of shear stress and two image heights: (A) and (B) are both at 0.5 Pa showing control image height (A) and 30% reduction (B); (C) and (D) are both at 50 Pa with (C) at control height and (D) at 30% reduction. Note the horizontal bulge and poor fitting at control height (C) and the minimal bulge and improved fitting at 30% reduction (D). (Colors are visible in the online version of the article; http://dx.doi.org/10.3233/BIR-140660.)
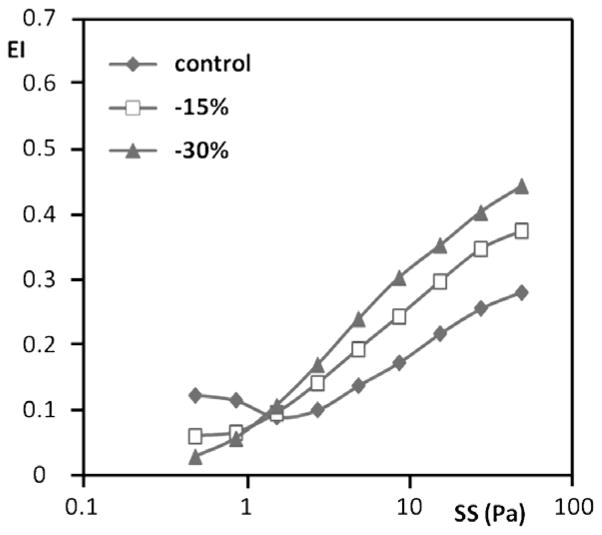
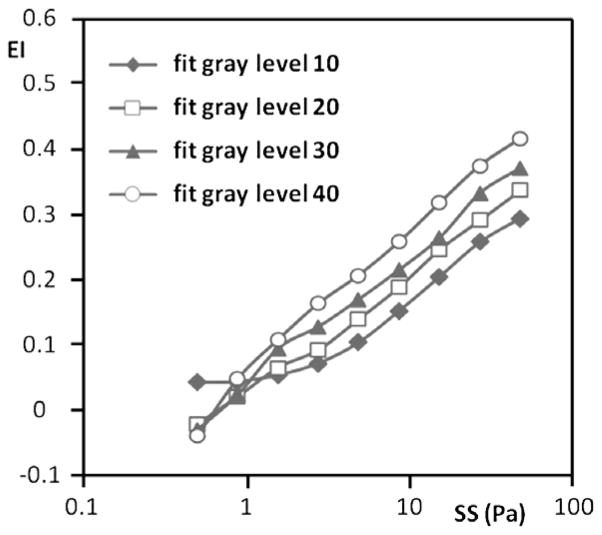
In general, decreasing the image height resulted in higher values of EI at stresses greater than ~2 Pa (Fig. 5). At the highest stress used (50 Pa), there was about a 55% increase of EI when going from control to a 30% smaller image. EI changes at stresses below ~2 Pa were more complex, with the control image and the 30% smaller image being the inverse of that observed at higher stress levels (Fig. 5). The gray level selected for computer fitting also affected EI values, with increasing levels yielding higher EI values at essentially all stresses (Fig. 6). Interesting, image height affected the fit of the image to an ellipse, with EoF values decreasing with decreasing height and increasing stress: changing from control to 30% smaller height lowered EoF by ~40% up to about 5 Pa and by 50% at the four higher stresses (Table 1(B)).
Fig. 5.
Representative elongation index (EI) versus shear stress (SS) results for sickle cell disease RBC from a single donor obtained using different aperture settings and hence different image heights (control, 15% and 30% reduction). Note that at stresses ≳2 Pa there is an inverse relation between EI and image height.
Fig. 6.
Representative elongation index (EI) versus shear stress (SS) results for sickle cell disease RBC from a single donor obtained using different gray level settings and hence different light intensities for fitting; an increased gray level indicates a higher light intensity. Note that at ≳2 Pa an increased gray level yields a higher EI.
3.3. Estimation of percent ISC
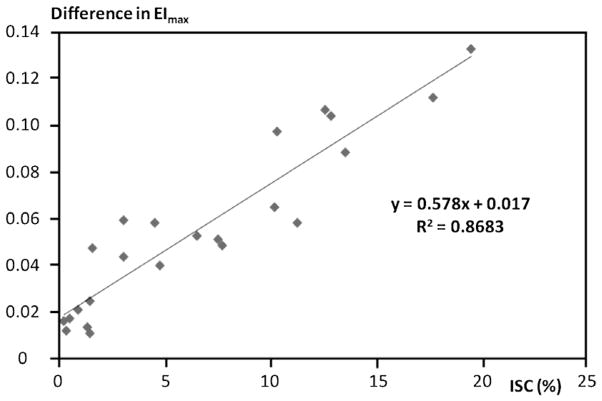
The results presented in Figs 5 and 6 and in Table 1(B) suggested that decreasing the height or increasing the gray level for fitting yielded a more “normal” diffraction pattern and hence a smaller influence of poorly deformable cells (i.e., ISC). To test this suggestion, the Lineweaver–Burke approach was used to calculate EImax for each sickle blood sample (see Methods). The numerical difference between EImax at the control image and at the 15% smaller image was correlated with percent ISC determined by light microscopy of fixed cells (Fig. 7). Over a range of ISC from 1–20%, the association was strong and linear: R2 = 0.87, p < 0.001 with linear regression yielding an intercept of 0.017 and hence very close to the origin.
Fig. 7.
The effects of percentage ISC in sickle cell disease RBC populations on the numerical difference of EImax between control and 15% reduced heights. Percent ISC was determined by optical microscopy for 1,000 cells per subject. Data are for 23 SCD subjects; the straight line was determined by linear regression (R2 = 0.8683, p < 0.001).
4. Discussion
The ability of the RBC to deform has long been known to be an important determinant of blood viscosity, flow in the microcirculation, and the overall perfusion of vascular beds. In order to describe this physical property, many studies have employed ektacytometry to determine RBC deformation-shear stress relations. This technique has been applied successfully to both normal and pathological RBC and mathematical models exist for characterizing EI-stress results [6,20]. Regardless of the system used for ektacytometry (e.g., diffraction image captured by video system, projection of this image onto four photodiodes, Couette or rectangular shearing system, steady or decaying shear stress) [4,14,20], results for normal RBC are comparable and are congruent with the expected relations between RBC shape and diffraction shape [24].
In contrast to ektacytometry with normal erythrocytes, applying this technique to mixtures of RBC having a wide range of deformability has always been problematic. There are now papers describing methods to analyze populations containing both rigid, biconcave cells and normally deforming RBC [24–27]; these methods can provide useful information yet require post-experimental mathematical treatment. In addition, these approaches dealt with rigid circular RBC and their application to sickle cell blood containing ISC is still awaiting evaluation.
The earliest recognition of difficulties associated with ektacytometry of sickle red blood cells appears to the 1977 report by Bessis and Mohandas [8]. They present a diffraction pattern for sickle blood that clearly exhibits the cross-like shape. In addition, they provide a stylized drawing of what they believe occurs during shear flow of this blood: deformable cells align with fluid stream lines and elongate, while ISC are orientated at 90° to stream lines, do not deform, and rotate along their long axis. Johnson has considered this situation and, when using a 4-diode array to sample the diffracted light, indicates that ISC contribute a “negative EI signal” and suggests that this negative EI term be considered in studies involving sickle cells. Others have published using the 4-diode array approach and report that EI values, under specific conditions, are less than zero (i.e., negative), but do not suggest a method for dealing with the problem [12,19,21,22].
Unlike 4-diode systems, the LORCA employs an 8-bit CCD array to capture the diffraction pattern projected onto a flat screen and digitally stores these data for subsequent analysis. The two techniques used herein for analyzing patterns from sickle erythrocytes differ in their approach but achieve similar results: (1) Varying the aperture in the CCD camera’s lens to modify the pattern of light sensed by the camera (Fig. 4), thereby reducing the contribution of ISC to the overall pattern. In practice, decreasing the physical height of the pattern viewed on a computer monitor serves to reduce the non-elliptical portion of the pattern seen by the camera and to increase EI at moderate to high stresses (Fig. 5); (2) Using the unmodified image without changes of the lens aperture and selecting a specific light intensity (i.e., gray level) of the diffraction pattern for use when fitting an ellipse (Fig. 6). That is, analyze “slices” of the intensity pattern at progressively increasing light intensities (i.e., higher values of gray level) so that the gray level is above the light intensity generated by ISC (Fig. 1).
The efficacy of the first approach (i.e., decreasing imagine height via aperture) is clearly evident from Table 1: the Error of Fit (EoF) and hence the goodness of fit of the image to an elliptical shape for sickle RBC is greatly improved as the height of the image is decreased, whereas the EoF is unaltered for normal red blood cells. In addition, the first method suggests a useful approach for estimating percentage of ISC in a sample of sickle blood (Fig. 7). It is acknowledged that this procedure requires additional experimental steps, including EI-stress measurements at two image heights, fitting each set of data to calculate EImax, and determining the difference between these EImax values. However, it is faster than manual microscopic examination and counting of cells and seems equally reliable (R2 = 0.87, Fig. 7). Although the number of ISC does not completely describe the severity of the disease, it has been used as an indicator of the extent of hemolysis and of the effectiveness of available therapy (e.g., chronic transfusion therapy) [1,28]. It is important to note that the results presented in Fig. 7, as well as those in Figs 4–6 and Table 1, are probably somewhat specific to the details of our ektacytometer (e.g., initial image height, percent reduction of height). Nevertheless, the general approach described herein should be applicable to ektacytometric studies of RBC.
Finally, it will be important to determine whether either of the two approaches described herein for dealing with EI-shear stress data provide physiologically relevant information. Both result in deformability results that are a function of either optical or computer software alterations (Figs 5 and 6). Yet neither suggests which aperture opening or light intensity level should be used to predict in vivo flow dynamics or the probability of disturbed microcirculatory blood flow dynamics. Obviously, additional studies are warranted: pressure-flow studies in vascular beds, RBC distribution within tissues and the effects of vascular tone as carried out by Baskurt and co-workers seem especially important [2,7,29].
Acknowledgments
This research was supported in part by the European Union and the State of Hungary, co-financed by the European Social Fund in the frame work of TÁMOP 4.2.4. A/2-11-1-2012-0001 ‘National Excellence Program’, CIRM 2301-S-NA159, HL11771, the Southern California Clinical Translational Science Institute (UL1 TR000130 04) and the National Heart Lung and Blood Institute (1RC HL099412-0, 1U54 HL090511-01, 5UO1 HL117718).
Footnotes
All authors have seen and agreed with the content of the manuscript and there is no financial interest to report.
References
- 1.Bartolucci P, Brugnara C, Teixeira-Pinto A, Pissard S, Moradkhani K, Jouault H, et al. Erythrocyte density in sickle cell syndromes is associated with specific clinical manifestations and hemolysis. Blood. 2012;120:3136–3141. doi: 10.1182/blood-2012-04-424184. [DOI] [PubMed] [Google Scholar]
- 2.Baskurt OK. In vivo correlates of altered blood rheology. Biorheol. 2008;45:629–638. [PubMed] [Google Scholar]
- 3.Baskurt OK, Farley RA, Meiselman HJ. Erythrocyte aggregation tendency and cellular properties in horse, human, and rat: a comparative study. Am J Physiol. 1997;273:H2604–H2612. doi: 10.1152/ajpheart.1997.273.6.H2604. [DOI] [PubMed] [Google Scholar]
- 4.Baskurt OK, Hardeman MR, Uyuklu M, Ulker P, Cengiz M, Nemeth N, et al. Comparison of three commercially available ektacytometers with different shearing geometries. Biorheol. 2009;46:251–264. doi: 10.3233/BIR-2009-0536. [DOI] [PubMed] [Google Scholar]
- 5.Baskurt OK, Meiselman HJ. Susceptibility of equine erythrocytes to oxidant-induced rheologic alterations. Am J Vet Res. 1999;60:1301–1306. [PubMed] [Google Scholar]
- 6.Baskurt OK, Meiselman HJ. Data reduction methods for ektacytometry in clinical hemorheology. Clin Hemorheol Microcirc. 2013;54:99–107. doi: 10.3233/CH-2012-1616. [DOI] [PubMed] [Google Scholar]
- 7.Baskurt OK, Yalcin O, Gungor F, Meiselman HJ. Hemorheological parameters as determinants of myocardial tissue hematocrit values. Clin Hemorheol Microcirc. 2006;35:45–50. [PubMed] [Google Scholar]
- 8.Bessis M, Mohandas N. Laser diffraction patterns of sickle cells in fluid shear flows. Blood Cells. 1977;3:229–239. [Google Scholar]
- 9.Bor-Kucukatay M, Wenby RB, Meiselman HJ, Baskurt OK. Effects of nitric oxide on red blood cell deformability. Am J Physiol Heart Circ Physiol. 2003;284:H1577–H1584. doi: 10.1152/ajpheart.00665.2002. [DOI] [PubMed] [Google Scholar]
- 10.Chien S. Principles and techniques for assessing erythrocyte deformability. Blood Cells. 1977;3:71–95. [Google Scholar]
- 11.Chien S. Red cell deformability and its relevance to blood flow. Annu Rev Physiol. 1987;49:177–192. doi: 10.1146/annurev.ph.49.030187.001141. [DOI] [PubMed] [Google Scholar]
- 12.Clark MR, Mohandas N, Shohet S. Deformability of oxygenated irreversibly sickled cells. J Clin Invest. 1980;65:189–196. doi: 10.1172/JCI109650. [DOI] [PMC free article] [PubMed] [Google Scholar]
- 13.Dobbe JGG, Hardeman MR, Streekstra GJ, Grimbergen CA. Validation and application of an automated rheo-scope for measuring red blood cell deformability distributions in different species. Biorheol. 2004;41:65–77. [PubMed] [Google Scholar]
- 14.ECSH Expert Panel on Blood Rheology. Guidelines for measurement of blood-viscosity and erythrocyte deformability. Clin Hemorheol. 1986;6:439–453. [Google Scholar]
- 15.Evans EA. Structure and deformation properties of human red blood cells: concepts and quantitative methods. Methods Enzymol. 1989;173:3–35. doi: 10.1016/s0076-6879(89)73003-2. [DOI] [PubMed] [Google Scholar]
- 16.Groner W, Mohandas N, Bessis M. New optical technique for measuring erythrocyte deformability with the ektacytometer. Clin Chem. 1980;26:1435–1442. [PubMed] [Google Scholar]
- 17.Hardeman MR, Goedhart PT, Dobbe JGG, Lettinga KP. Laser assisted optical rotational cell analyser (L.O.R.C.A); 1. A new instrument for measurement of various structural hemorheological parameters. Clin Hemorheol. 1994;14:605–618. [Google Scholar]
- 18.Hardeman MR, Goedhart PT, Shin S. Methods in hemorheology. In: Baskurt OK, Hardeman MR, Rampling MW, Meiselman HJ, editors. Handbook of Hemorheology and Hemodynamics. IOS Press; Amsterdam: 2007. pp. 242–266. [Google Scholar]
- 19.Huang Z, Hearne L, Irby CE, King SB, Ballas SK, Kim-Shapiro DB. Kinetics of increased deformability of deoxygenated sickle cells upon oxygenation. Biophys J. 2003;85:2374–2383. doi: 10.1016/s0006-3495(03)74661-x. [DOI] [PMC free article] [PubMed] [Google Scholar]
- 20.Johnson RM. Ektacytometry of red blood cells. Methods Enzymol. 1989;173:35–54. doi: 10.1016/s0076-6879(89)73004-4. [DOI] [PubMed] [Google Scholar]
- 21.Johnson RM, Féo CJ, Nossal M, Dobo I. Evaluation of covalent antisickling compounds by PO2 scan ektacytometry. Blood. 1985;66:432–438. [PubMed] [Google Scholar]
- 22.Kuypers FA, Scott MD, Schott MA, Lubin B, Chiu DT. Use of ektacytometry to determine red cell susceptibility to oxidative stress. J Lab Clin Med. 1990;116:535–545. [PubMed] [Google Scholar]
- 23.Mohandas N, Clark MR, Jacobs MS, Shohet SB. Analysis of factors regulating erythrocyte deformability. J Clin Invest. 1980;66:563–573. doi: 10.1172/JCI109888. [DOI] [PMC free article] [PubMed] [Google Scholar]
- 24.Rabai M, Meiselman HJ, Wenby RB, Detterich JA, Feinberg J. Analysis of light scattering by red blood cells in ektacytometry using global pattern fitting. Biorheol. 2012;49:317–328. doi: 10.3233/BIR-2012-0616. [DOI] [PMC free article] [PubMed] [Google Scholar]
- 25.Streekstra GJ, Dobbe JGG, Hoekstra AG. Quantification of the fraction of poorly deformable red blood cells using ektacytometry. Opt Express. 2010;18:14173–14182. doi: 10.1364/OE.18.014173. [DOI] [PubMed] [Google Scholar]
- 26.Streekstra GJ, Hoekstra AG, Heethaar RM. Anomalous diffraction by arbitrarily oriented ellipsoids: applications in ektacytometry. Appl Optics. 1994;33:7288–7296. doi: 10.1364/AO.33.007288. [DOI] [PubMed] [Google Scholar]
- 27.Streekstra GJ, Hoekstra AG, Nijhof EJ, Heethaar RM. Light scattering by red blood cells in ektacytometry: Fraunhofer versus anomalous diffraction. Appl Optics. 1993;32:2266–2272. doi: 10.1364/AO.32.002266. [DOI] [PubMed] [Google Scholar]
- 28.Stuart J. Sickle cell disease and vascular occlusion – rheological aspects. Clin Hemorheol. 1984;4:193–207. [Google Scholar]
- 29.Yalcin O, Meiselman HJ, Armstrong JK, Baskurt OK. Effect of enhanced red blood cell aggregation on blood flow resistance in an isolated-perfused guinea pig heart preparation. Biorheol. 2005;42:511–520. [PubMed] [Google Scholar]


