Abstract
Endoscopic and interstitial diffuse optical tomography have been studied in clinical investigations for imaging prostate tissues, yet, there is no comprehensive comparison of how these two imaging geometries affect the quality of the reconstruction images. In this study, the effect of imaging geometry is investigated by comparing the cross-section of the Jacobian sensitivity matrix and reconstructed images for three-dimensional mathematical phantoms. Next, the effect of source-detector configurations and number of measurements in both geometries is evaluated using singular value analysis. The amount of information contained for each source-detector configuration and different number of measurements are compared. Further, the effect of different measurements strategies for 3D endoscopic and interstitial tomography is examined. The pros and cons of using the in-plane measurements and off-plane measurements are discussed. Results showed that the reconstruction in the interstitial geometry outperforms the endoscopic geometry when deeper anomalies are present. Eight sources 8 detectors and 6 sources 12 detectors are sufficient for 2D reconstruction with endoscopic and interstitial geometry respectively. For a 3D problem, the quantitative accuracy in the interstitial geometry is significantly improved using off-plane measurements but only slightly in the endoscopic geometry.
Keywords: Endoscopic, interstitial, diffuse optical tomography, prostate
1. Introduction
Diffuse optical tomography (DOT) is a new imaging modality with potential applications in determining hemoglobin concentration, oxygen saturation, lipid and water in tissue with spatial resolution of centimeters [1]. For the past few decades, the DOT has been demonstrated in the application of neonatal cerebral monitoring [2], breast cancer diagnosis [3], and bones and joints [4]. This imaging technique seeks to recover the optical parameters of tissue from boundary measurements of transmitted near-infrared or visible light. A typical DOT system often consists of a light source (lasers, white light), illuminating the biological tissue from the surface at different source positions in succession [1]. The photons which propagate through tissue are then collected at multiple detector positions on the tissue surface [1]. Three measurement schemes are used for these measurements: time domain, frequency domain and continuous wave (cw). Of these three measurement types, the cw method is the simplest and least expensive, and can provide fastest data acquisition and greatest signal-to-noise level [5].
One of the applications of cw DOT system is the light dosimetry for interstitial prostate photodynamic therapy (PDT). The effectiveness of PDT treatment largely depends on the number of photons absorbed by the photosensitizers located in the tumor tissue [6]. Thus the light and photosensitizer dosimetry are essential for PDT treatments [7]. In our prostate PDT protocol, optical properties of prostate are first determined before the treatment, so that a real-time modeling and monitoring of photons deposition in the prostate can be achieved. Prostate optical properties are determined via an interstitial DOT system where light sources and detectors are interstitially inserted in the prostate tissue [8].
Recently, there has been consideration of the diffuse optical tomography for prostate imaging, such as a non-invasive endoscopic approach and an interstitial approach. In endoscopic approach, a trans-rectal probe similar to the standard ultrasound probe is used for the data acquisition. Many sources and detectors are deployed on the tomographic probe with diameter no larger than 35mm. The imaging geometry is a hollow annular shape with the source-detectors placed in the inner region of the prostate. In the interstitial approach, multiple point sources and isotropic detectors are interstitially inserted in the prostate tissue with multiple separations. The boundary measurements in the conventional DOT are replaced with the in-field measurements. Both image geometries are apparently different than the classic circular or planar DOT image geometries and require different implement of modeling and reconstruction methods with relevant geometry based modifications. Thus, it is quite important to assess the effects of the imaging geometry and source-detector configurations on the image reconstruction.
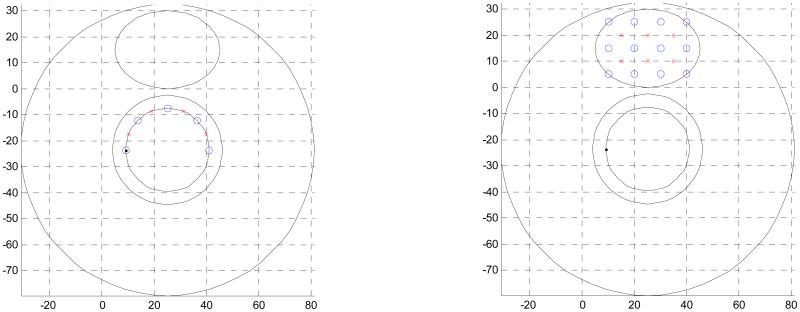
In this study, the same DOT reconstruction algorithm is used to examine the xxxx of the endoscopic and interstitial diffuse optical tomography as shown in Fig. 1. The goal of this study is to examine the effects of the imaging geometry and the source-detector configuration on the accuracy and quality of the reconstruction via the Jacobian sensitivity analysis and reconstruct images, and to determine the optimal data acquisition strategy to characterize the prostate optical properties for diagnosis and PDT light dosimetry purposes.
Figure. 1.
Schematic of endoscopic and interstitial source-detector geometry cross-sections used in prostate diffuse optical tomography applications. Endoscopic geometry (a) has been reported being used non-invasively in the canine experiments, while the interstitial geometry has been used for light dosimetry during PDT treatment. Blue circles are the detector positions, the red crosses are the source positions.
2. Materials and Methods
2.1 Theory and Computation Methods
The propagation of near-infrared light through highly scattering media (such as biological tissues) is often modeled as a second order elliptic partial differential equation [9]. For continuous-wave diffuse optical tomography system, steady-state attenuation measurements are made, and the light fluence rate can be calculated using steady-state diffusion approximation to the radiation transfer equation:
| (1) |
where Φ is the isotropic photon density and q is an isotropic source distribution. The model is characterized by two spatially varying functions μa (absorption coefficient) and κ=1/3(μa + μ′s) (diffusion coefficient)(μ′s scattering coefficient), which gives rise to the dual parameter search space nature of the optimization problem. We use the modified Robin boundary condition , where α = (1-|cosθc|2)/(2/(1-R0)-1+|cosθc|3) and R0 = (n-1)2/(n+1)2, n=ntissue/noutside is the ratio of refraction index between tissue (ntissue) and outside medium (noutside), and θc=arcsin(1/n) is the critical angle. In prostate tissue, a matched non-scattering boundary: is used where ntissue = 1.4, noutside = 1.4 and α = 1.
Newton-Raphson iterative method is used to minimize the objective function:
| (2) |
where is the data for the j-th measurements from i-th source. Use the subscript i to represent the data for a single source i, is the projection operator for source i, is the projection data obtained by sampling at the discrete measurements positions [9].
Following the L-M scheme, the parameter update can be obtained by:
| (3) |
where
| (4) |
is the Jacobian matrix at i-th iteration, representing the sensitivity between the field distribution with respect to the perturbations of optical properties [9]. The Jacobian matrix contains the first derivatives of the log of the amplitude of the i-th measurements with respect to the optical properties at the j-th nodes, and is calculated using the adjoint method in this study:
| (5) |
| (6) |
Since only the cw measurements are used, the Jacobian matrix presented here only contains the amplitude sensitivity sub-matrices, where the phase sensitivity sub-matrices are eliminated. Examples of individual rows in the Jacobian matrix plotted as images are shown in the Fig. 2. These maps relate small changes in the log amplitude of the measurements for a given source-detector configuration, due to the small perturbations in the optical absorption and diffusing properties at all nodal locations.
Figure. 2.
The Jacobian sensitivity maps for two source-detector configurations. In each image, the source position and detector position are labeled as S and D respectively.
2.2 Singular Value Analysis
Using singular value analysis, the Jacobian matrix is decomposed as:
| (7) |
where U and V are the orthonormal matrices containing the eigenvectors of the Jacobian corresponding to the modes in the measurement space and the property space; S is a diagonal matrix containing the singular values of the Jacobian, representing the importance of the corresponding eigenvectors between the measurement space and the property space. The number of nonzero singular values in the diagonal matrix S determines the effectiveness between these two spaces, and usually the more nonzero singular values, the more details and improved resolution can be recovered in the property space[10]. Typically, only those singular values are above certain noise level (e.g., 1% noise in amplitude) contain the useful information. Thus, one can use this metric to determine the sensitivity of different image geometries (e.g., endoscopic vs. interstitial), sensitivity of certain source-detector configurations, and optimal number of measurements which lead to more singular values above the noise level, and in turn, improve the image resolution.
2.3 Experiment sets
In 3D analysis, a cylindrical medium with a diameter of 56mm, and height 60mm centered at (25,-23.5,0) with homogeneous optical properties of μa=0.03mm-1, and μs′=1.4mm-1 is used. The prostate is modeled as an ellipsoid with semi-axes of 15mm, 15mm and 20mm, centered at (25,15,0). The rectum wall is modeled as a cylindrical shell with inner diameter of 32mm, and outer diameter of 42, height of 60mm, centered at (25,-23.5,0).
The following source-detector configurations are studied:
(1) Single layer in-plane configuration
In endoscopic geometry, 3 sources and 4 detectors are equally spaced on the rectum wall in a single layer fashion, where one source is used while all the 4 detectors are used to give 12 measurements. In interstitial geometry, 6 sources and 12 detectors are inserted in the prostate according to Fig. 1. All the sources and detectors are placed on the same plane. The measurements are acquired when one source is on while only the four most adjacent detectors are used leading to 6×4 total measurements.
(2) Single layer off-plane configuration
This source-detector configuration is not applicable for the endoscopic geometry, since all the sources and detectors placed on the probe are on the same plane. In the interstitial geometry, 6 sources are placed on one plane, while the detectors are scanned along the axial direction at the following positions: in-plane (z=0mm), and off-plane z=±5mm, z=±10mm. The measurements are acquired when one source is on while only the four most adjacent detectors are used leading to 6×20 total measurements.
(3)Three layers in-plane configuration
In endoscopic approach, 3 sources and 4 detectors are scanned along the axial direction and taking the amplitude data at the following positions: in-plane (z=0mm), z=±10mm, leading to 36 measurements. Interstitial measurements are obtained where one source is used at a time while only the most adjacent detectors in the source layer are used, to give 18×4 measurements.
(4) Three layers off-plane configuration
This configuration is only applicable to the interstitial approach. The source positions are the same as above, the detector fibers are scanned at in-plane (z=0mm), z=±5mm, z=±10mm positions when each source is lit, lead to 18×20measurements.
3. Results and Discussions
3.1 Jacobian sensitivity analysis
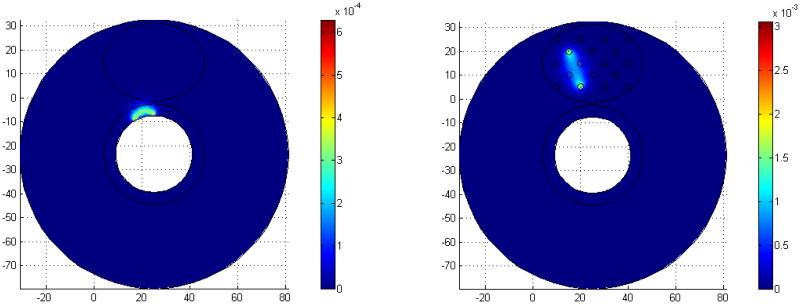
To ensure the accuracy of the forward FEM calculation, the mesh density near the sources and detectors are set 20 times higher than the whole domain mesh density. A total number of 11714 nodes and 66976 tetrahedral elements are used for the Jacobian calculation in interstitial geometry, and 10313 nodes and tetrahedral 64054 elements for the endoscopic geometry. To compare the Jacobian sensitivity maps, the sum of all source detector measurements were calculated and shown in Fig. 3. Homogeneous optical properties are used for the calculation with μa=0.03mm-1, and μs'=1.4mm-1. The Jacobian sensitivity maps shown in Fig. 3 (a) and (b) are drastically different in terms of the values and the sensitive region because of the difference in the imaging geometries. In the endoscopic geometry, the measurements are hypersensitive at the boundary of the rectum wall. In contrast, the hypersensitive region is inside the prostate in the interstitial geometry. By definition, the Jacobian matrix represents the projections between the measurements and optical property field. Thus, the magnitude and the locations of the sensitive Jacobian directly relate the accuracy and quality of reconstruction images.
Figure 3.
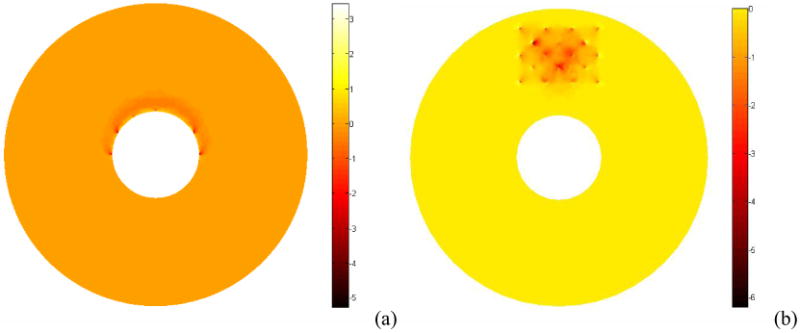
Plot of the absorption Jacobian values summed over all source detector configurations for endoscopic geometry (a) and interstitial geometry (b).
3.2 Singular value analysis
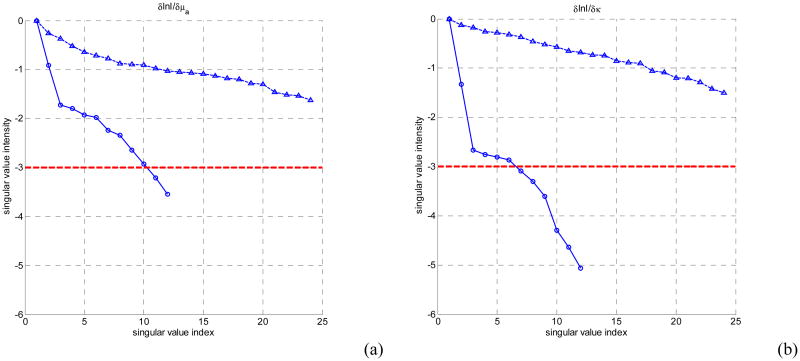
The purpose of the singular value analysis is to determine the number of useful singular values above the noise threshold level for each geometry. Examples of singular value spectra associated with source-detector configurations are plotted on a logarithm scale. The threshold of 10-3 [11] are plotted as horizontal dashed lines in each geometry configuration.
(1) Effects of imaging geometry
Taking noise level into consideration, Fig. 3 shows that more singular values above the practical noise level for the source detector configurations studied for the interstitial imaging geometry than for the endoscopic geometry. This in turn corresponds to more accurate optical property reconstruction, resulting in better image resolution and quantitative localizations. The locations of the singular values that are above the noise threshold are mainly around the rectum wall in the endoscopic geometry, limiting the ability of recovering the optical properties at deeper depth in this case. However, since the all the sources and detectors in the interstitial case are inserted at the locations where the prostate tissue is, the measurements obtained in the interstitial approach are more sensitive to the prostate tissue optical properties. This indicates that the interstitial tomography can provide better accuracy and localization of the optical anomalies than the endoscopic approach. In Fig. 4, the singular values for three-layer in-plane source-detector configurations are shown in for the endoscopic geometry (circles) and interstitial geometry (triangles).
Figure 4.
The log of amplitudes of Jacobian matrix singular values for homogeneous single layer in-plane models for endoscopic (circles) and interstitial geometry (triangles). (a) absorption sensitivity sub-matrix, (b) diffusion coefficient sensitivity sub-matrix. The noise threshold level is set as 10-3.
(2) Effects of in-plane, off-plane measurement for interstitial geometry
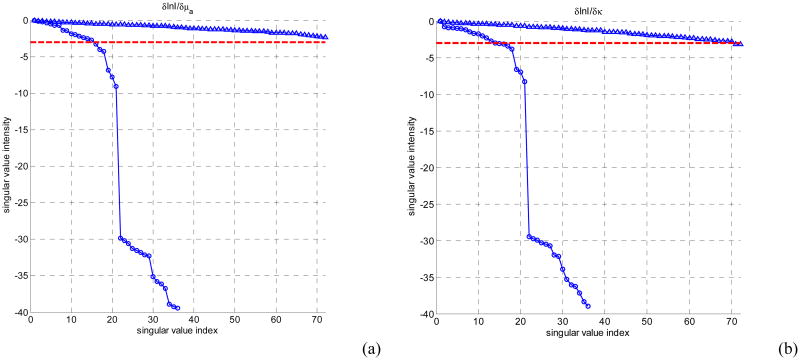
An increase in number of measurements, i.e., use of the off-plane measurements means more data acquisition time and more computation cost. Jacobian calculation in the non-linear iterative reconstruction algorithm requires repetitive computation of forward data when the sources are at source locations and detector positions. Thus increasing the number of off-plane measurement locations substantially increases the computation time and memory requirements. However, as shown in Fig. 6, increase number of measurements at off-plane locations does not increase the number of useful measurements. The benefits of using the off-plane data are not significant if both the data acquisition time and computation time is considered.
Figure 6.
The log of amplitudes of Jacobian matrix singular values for homogeneous 3 layers in-plane models for endoscopic (circles) and interstitial geometry (triangles). (a) absorption sensitivity sub-matrix, (b) diffusion coefficient sensitivity sub-matrix. The noise threshold level is set as 10-3.
4. Conclusion
In this paper, the effect of imaging geometry is investigated by comparing the cross-section of the Jacobian sensitivity matrix and reconstructed images for three-dimensional mathematical phantoms. The effect of source-detector configurations and number of measurements in both geometries is evaluated using singular value analysis. The amount of information contained for each source-detector configuration and different number of measurements are compared. The effect of different measurements strategies for 3D endoscopic and interstitial tomography is examined. The pros and cons of using the in-plane measurements and off-plane measurements are discussed. Our results showed that the reconstruction in the interstitial geometry outperforms the endoscopic geometry when deeper anomalies are present. For a 3D problem, the quantitative accuracy in the interstitial geometry is significantly improved using off-plane measurements but only slightly in the endoscopic geometry.
Figure 5.
The log of amplitudes of Jacobian matrix singular values for homogeneous 3 layers in-plane models for endoscopic (circles) and interstitial geometry (triangles). (a) absorption sensitivity sub-matrix, (b) diffusion coefficient sensitivity sub-matrix. The noise threshold level is set as 10-3.
Table 1.
Source-detector configurations for endoscopic and interstitial DOT geometries.
| Endoscopic geometry | Interstitial geometry | |
|---|---|---|
| Single layer in-plane configuration | 3 sources, 4 detectors (12 meas.) | 6 sources, 12 detectors (24 meas.) |
| Single layer off-plane configuration | NA | 6 sources, 36 detectors (120 meas.) |
| Three layers in-plane configuration | 9 sources, 12 detectors (36 meas.) | 18 sources, 36 detectors (72 meas.) |
| Three layers off-plane configuration | NA | 18 sources, 108 detectors (360meas.) |
Acknowledgments
This work is supported by Department of Defense Grant DAMD 17-03-1-0132 and National Institute of Health (NIH) R01 CA109456 and PO1 CA87971.
References
- 1.Gibson AP, Hebden JC, Arridge SR. Recent advances in diffuse optical imaging. Phys Med Biol. 2005;50(4):R1–43. doi: 10.1088/0031-9155/50/4/r01. [DOI] [PubMed] [Google Scholar]
- 2.Boas DA, Dale AM. Simulation study of magnetic resonance imaging-guided cortically constrained diffuse optical tomography of human brain function. Appl Opt. 2005;44(10):1957–68. doi: 10.1364/ao.44.001957. [DOI] [PubMed] [Google Scholar]
- 3.Pogue BW, et al. Quantitative hemoglobin tomography with diffuse near-infrared spectroscopy: Pilot results in the breast. Radiology. 2001;218(1):261–266. doi: 10.1148/radiology.218.1.r01ja51261. [DOI] [PubMed] [Google Scholar]
- 4.Zhang QZ, Jiang HB. Three-dimensional diffuse optical tomography of simulated hand joints with a 64x64-channel photodiodes-based optical system. Journal of Optics a-Pure and Applied Optics. 2005;7(5):224–231. [Google Scholar]
- 5.Franceschini MA, Boas DA. Noninvasive measurement of neuronal activity with near-infrared optical imaging. Neuroimage. 2004;21(1):372–86. doi: 10.1016/j.neuroimage.2003.09.040. [DOI] [PMC free article] [PubMed] [Google Scholar]
- 6.Wilson BC. Photodynamic therapy for cancer: principles. Can J Gastroenterol. 2002;16(6):393–6. doi: 10.1155/2002/743109. [DOI] [PubMed] [Google Scholar]
- 7.Dougherty TJ, et al. Photodynamic therapy. J Natl Cancer Inst. 1998;90(12):889–905. doi: 10.1093/jnci/90.12.889. [DOI] [PMC free article] [PubMed] [Google Scholar]
- 8.Zhu TC, Finlay JC, Hahn SM. Determination of the distribution of light, optical properties, drug concentration, and tissue oxygenation in-vivo in human prostate during motexafin lutetium-mediated photodynamic therapy. J Photochem Photobiol B. 2005;79(3):231–41. doi: 10.1016/j.jphotobiol.2004.09.013. [DOI] [PMC free article] [PubMed] [Google Scholar]
- 9.Arridge SR, Hebden JC. Optical imaging in medicine: II. Modelling and reconstruction. Phys Med Biol. 1997;42(5):841–53. doi: 10.1088/0031-9155/42/5/008. [DOI] [PubMed] [Google Scholar]
- 10.Yalavarthy PK, et al. Critical computational aspects of near infrared circular tomographic imaging: Analysis of measurement number, mesh resolution and reconstruction basis. Optics Express. 2006;14(13):6113–6127. doi: 10.1364/oe.14.006113. [DOI] [PubMed] [Google Scholar]
- 11.Xu H, et al. Near-infrared imaging in the small animal brain: optimization of fiber positions. Journal of Biomedical Optics. 2003;8(1):102–110. doi: 10.1117/1.1528597. [DOI] [PubMed] [Google Scholar]


