

Abstract
Cortical thickness (CT) is related to normal development and neurodevelopmental disorders. It remains largely unclear how the characteristic patterns of CT evolve in the first 2 years. In this paper, we systematically characterized for the first time the detailed vertex-wise patterns of spatial distribution, longitudinal development, and hemispheric asymmetries of CT at 0, 1, and 2 years of age, via surface-based analysis of 219 longitudinal magnetic resonance images from 73 infants. Despite the dynamic increase of CT in the first year and the little change of CT in the second year, we found that the overall spatial distribution of thin and thick cortices was largely present at birth, and evolved only modestly during the first 2 years. Specifically, the precentral gyrus, postcentral gyrus, occipital cortex, and superior parietal region had thin cortices, whereas the prefrontal, lateral temporal, insula, and inferior parietal regions had thick cortices. We revealed that in the first year thin cortices exhibited low growth rates of CT, whereas thick cortices exhibited high growth rates. We also found that gyri were thicker than sulci, and that the anterior bank of the central sulcus was thicker than the posterior bank. Moreover, we showed rightward hemispheric asymmetries of CT in the lateral temporal and posterior insula regions at birth, which shrank gradually in the first 2 years, and also leftward asymmetries in the medial prefrontal, paracentral, and anterior cingulate cortices, which expanded substantially during this period. This study provides the first comprehensive picture of early patterns and evolution of CT during infancy.
Keywords: cortical thickness, early brain development, hemispheric asymmetry, infant, spatial distribution, sulci and gyri
Introduction
The human cerebral cortex is a highly convoluted, sheet-like structure of gray matter (GM). In histological studies, cortical thickness (CT) varies regionally between 1 and 4.5 mm (Brodmann, 1909; Economo and Parker, 1929), with gyri having thicker cortices than sulci and also the anterior bank of the central sulcus (CS) having thicker cortices than the posterior bank. Recent advances of magnetic resonance imaging (MRI) techniques make it possible to measure CT based on the boundaries of white matter (WM) and GM in T1-weighted and T2-weighted MRI in vivo. The clarity of these boundaries and therefore the precision of these measurements highly depend on the imaging tissue contrast and thus the underlying cortical microstructures, such as dendritic and synaptic arborization, intracortical myelination, water content, etc. In the adult MRI studies, CT exhibits the largely similar characteristic patterns as those observed in histological studies (Fischl and Dale, 2000; MacDonald et al., 2000). Hence, CT has become an important macroscopic morphological measure of the cerebral cortex in MRI studies. Changes of CT are found in normal development, aging, and brain disorders, and may indicate differential underlying microstructural changes of the cortex in different states (Shaw et al., 2008; Lyall et al., 2014).
The human cerebral cortex also exhibits hemispheric asymmetries in both structure and function (Toga and Thompson, 2003). Distinct hemispheric asymmetries of various anatomical attributes, e.g., surface area (SA), sulcal depth, and vertex position, are already present before term birth, and are particularly pronounced around the perisylvian cortex and superior temporal sulcus (STS), largely resembling those observed in adults (Li et al., 2014d). Meanwhile, hemispheric asymmetries of CT are observed in both adults and older children from 5 years of age (Luders et al., 2006; Zhou et al., 2013; Koelkebeck et al., 2014). On the other hand, disrupted CT asymmetries are found in neurodevelopmental disorders (Shaw et al., 2009).
The first 2 years is the most dynamic period of postnatal structural and functional development of the human cerebral cortex (Knickmeyer et al., 2008; Gilmore et al., 2012; Nie et al., 2012). Many neurodevelopmental disorders may already exhibit abnormal development of CT during this early postnatal stage (Lyall et al., 2014). However, unlike adult MRI, infant T1-weighted and T2-weighted MRI exhibits extremely poor and dynamic tissue contrast during development, making CT measurement based on the tissue contrast of a single time point less reliable. To address this critical issue, we have developed a set of infant-specific computational techniques for cortical surface-based analysis by capitalizing on longitudinal information from both T1-weighted and T2-weighted MRI during infancy (Li et al., 2013, 2014c; Wang et al., 2014). These techniques enable accurate and reliable measurement of CT, SA, and cortical folding. Leveraging our computational techniques, we have for the first time characterized the development of regional GM volume (Gilmore et al., 2012), expansion of vertex-wise SA (Li et al., 2013), hemispheric asymmetries of SA, sulcal depth, vertex coordinate position (Li et al., 2014d), development of deep sulcal landmarks (Meng et al., 2014), and growth of cortical local gyrification index (LGI; Li et al., 2014b) during the first 2 years. However, our knowledge of the characteristics of CT still remains limited for this early postnatal stage. Greater understanding would provide fundamental insights into neurodevelopmental disorders. Recently, Lyall et al., 2014 first examined regional CT development in infants by parcellating the cortex into 76 gyral-level regions, and revealed heterogeneous growth patterns across regions. However, there still exists a significant knowledge gap on the spatially fine-scaled spatiotemporal patterns and hemispheric asymmetries of CT in infants. To bridge this knowledge gap, this study took the unprecedented step of systematically characterizing the detailed vertex-wise patterns of spatial distributions, longitudinal development, sulcal–gyral differences, anterior–posterior differences in CS, and hemispheric asymmetries of CT at 0, 1, and 2 years of age, via surface-based analysis of 219 longitudinal T1-weighted and T2-weighted MRI from 73 infants.
Materials and Methods
Subjects.
The Institutional Review Board of the University of North Carolina (UNC) School of Medicine approved this study. The UNC hospitals recruited pregnant mothers during the second trimester of pregnancy, with the informed consents obtained from both parents. Exclusion criteria included abnormalities on fetal ultrasound, gestational age (GA) at birth <35 weeks, major medical or neurologic illness after birth, and major medical or psychotic illness in the mother (Gilmore et al., 2012; Lyall et al., 2014). These subjects were part of large prospective longitudinal studies of early brain development in healthy children (Knickmeyer et al., 2008; Gilmore et al., 2012).
The study group contained 73 healthy infants with GA at birth >35 weeks, including 31 singletons (20 males; 11 females) and 42 twins (22 males; 20 females; 7 monozygotic twin pairs, 10 dizygotic pairs, and 8 “single” twins; Gilmore et al., 2012). Medical records indicated that two subjects had intrauterine growth restriction. For all infants, the average 5 min Apgar score was 8.9 ± 0.4 (range, 7–10). By excluding any infant who was in the neonatal intensive care unit for >1 d, we excluded infants with significant perinatal problems, as well as significant medication exposure. All infants were scanned shortly after birth, and also at 1 and 2 years of age. The distributions of GA at birth, chronological age, and corrected age at MRI scanning of the infant cohort are provided in Table 1. No significant difference between males and females on their scanning ages has been found. This dataset has been used in prior studies (Gilmore et al., 2012; Li et al., 2013, 2014b,d; Lyall et al., 2014; Meng et al., 2014; Nie et al., 2014).
Table 1.
The distributions of gestational age at birth, chronological age, and corrected age (according to a term reference at 40 weeks of GA) at MRI scanning among the 73 subjects
| All (N = 73) | Male (N = 42) | Female (N = 31) | Singleton (N = 31) | Twin (N = 42) | |
|---|---|---|---|---|---|
| GA at birth (weeks) | 37.9 ± 1.7 (35.3–42.1) | 38.1 ± 1.5 (36.1–42.1) | 37.7 ± 1.8 (35.3–39.0) | 39.3 ± 1.4 (36.1–42.1) | 36.9 ± 1.0 (35.3–39.0) |
| Age at neonatal MRI (months) | 0.85 ± 0.36 (0.3–2.0) | 0.91 ± 0.44 (0.3–2.0) | 0.77 ± 0.20 (0.3–1.1) | 0.39 ± 0.24 (0.3–1.4) | 0.96 ± 0.39 (0.3–2.0) |
| Corrected age at neonatal MRI (months) | 0.37 ± 0.42 (−0.3–1.5) | 0.48 ± 0.43 (−0.3–1.5) | 0.22 ± 0.36 (−0.23–1.2) | 0.53 ± 0.32 (−0.28–1.2) | 0.25 ± 0.45 (−0.3–1.5) |
| Age at year 1 MRI (years) | 1.08 ± 0.06 (0.94–1.25) | 1.07 ± 0.06 (0.94–1.21) | 1.09 ± 0.06 (0.96–1.25) | 1.05 ± 0.08 (0.94–1.21) | 1.09 ± 0.05 (1.00–1.25) |
| Corrected age at year 1 MRI (years) | 1.04 ± 0.06 (0.92–1.18) | 1.03 ± 0.06 (0.92–1.18) | 1.04 ± 0.05 (0.96–1.17) | 1.04 ± 0.06 (0.94–1.18) | 1.04 ± 0.05 (0.92–1.17) |
| Age at year 2 MRI (years) | 2.08 ± 0.10 (1.81–2.40) | 2.10 ± 0.10 (1.93–2.40) | 2.05 ± 0.10 (1.81–2.32) | 2.03 ± 0.05 (1.93–2.21) | 2.11 ± 0.12 (1.81–2.40) |
| Corrected age at year 2 MRI (years) | 2.04 ± 0.10 (1.75–2.37) | 2.06 ± 0.09 (1.93–2.37) | 2.01 ± 0.10 (1.75–2.23) | 2.02 ± 0.05 (1.93–2.20) | 2.05 ± 0.12 (1.75–2.37) |
MR image acquisition
Images were acquired on a Siemens head-only 3T scanner (Allegra, Siemens Medical System) with a circular polarized head coil. Children were scanned unsedated while asleep, fitted with ear protection and with their heads secured in a vacuum-fixation device (Gilmore et al., 2012; Lyall et al., 2014). T1-weighted MR images (160 sagittal slices) were acquired by using 3D magnetization-prepared rapid gradient echo sequence: TR = 1900 ms; TE = 4.38 ms; inversion time, 1100 ms; flip angle, 7°; resolution, 1 × 1 × 1 mm3. T2-weighted MR images (70 transverse slices) were obtained with a turbo spin-echo sequence: TR = 7380 ms; TE = 119 ms; flip angle, 150°; resolution, 1.25 × 1.25 × 1.95 mm3. Data with motion artifacts were discarded, and a rescan was made when possible.
Image preprocessing and brain tissue segmentation
All images were visually inspected to ensure reasonable quality before analysis. All images were preprocessed by using an automatic, infant-specific computational pipeline as detailed previously (Li et al., 2013, 2014b,d; Meng et al., 2014). Briefly, it contains the following major steps: (1) rigid alignment of the T2-weighted MR image onto its counterpart T1-weighted MR image and further resampled to the resolution of 1 × 1 × 1 mm3; (2) removal of skull via a learning-based method (Shi et al., 2012a), and also removal of both cerebellum and brain stem by registration of an atlas to the subject image (Shen and Davatzikos, 2002; Wu et al., 2006, 2011); (3) correction of intensity inhomogeneity using N3 method (Sled et al., 1998); (4) rigid alignment of each image onto the infant age-matched, population-averaged volumetric brain atlas (Shi et al., 2011, 2012b); (5) longitudinally consistent tissue segmentation of infant brain MR images into WM, GM, and CSF, by using an infant-dedicated, longitudinally guided level-sets method (Wang et al., 2011, 2013, 2014); and (6) masking and filling of noncortical structures, and separation of each brain into left and right hemispheres.
Of note, primary and secondary cortical folding is established at term birth and preserved during postnatal development (Hill et al., 2010a; Li et al., 2013, 2014e). Hence, to deal with the challenging problems of poor tissue contrast and large within-tissue intensity variability in neonates and 1 year olds, their tissue segmentation was guided by subject-specific longitudinal image at 2 years of age, which typically has much better image contrast and clear cortical folding structures (Wang et al., 2013, 2014). Specifically, this method contained the following two major steps: (1) initializing tissue segmentation at each age using patch-driven coupled level-sets method based on the subject-specific tissue probability maps obtained by spares representation (Wang et al., 2014); and (2) applying longitudinal information at 2 years of age by using nonlinear image registration based on the initial segmentation, to guide the tissue segmentation of neonates and 1 year olds (Wang et al., 2013, 2014). This strategy significantly mitigated the ambiguity and increased the accuracy and longitudinal consistency in tissue segmentation, thus greatly facilitating the subsequent cortical surface reconstruction in early infancy (Wang et al., 2013; Li et al., 2014c).
Cortical surface reconstruction and registration
Cortical surface reconstruction and registration were performed by an infant-specific computational pipeline for surface-based analysis, which has been extensively verified on >500 infant brain MR images (Li et al., 2013, 2014a,c,f; Lyall et al., 2014; Meng et al., 2014). Based on tissue segmentation results, for each hemisphere of each image, the inner and outer cortical surfaces (represented by triangular meshes) were reconstructed by using a topology-preserving deformable surface method (Li et al., 2012, 2014c). Specifically, the inner cortical surface (GM–WM interface) was first reconstructed by correction of topological defects in the WM (to ensure a spherical topology) and then tessellation of the corrected WM as a triangular mesh. Due to the strong partial volume effects in infant brain MR images, the opposite tight sulci might not be fully visible in the tissue segmentation results, which will lead to incorrect reconstruction of the outer cortical surface. Therefore, we further recovered the buried sulci to generate a thin CSF separation between opposite tight sulci (Li et al., 2012, 2014c). Next, the inner cortical surface was deformed under the control of both internal force (for ensuring spatially adaptive smoothness of the surface) and external force (for driving the surface using the forces derived from Laplace's equation) to reconstruct the outer cortical surface (Li et al., 2012, 2014c). To prevent surface meshes from self-intersection, in each step of the surface deformation at each vertex, a fast triangle–triangle intersection detection method was also performed in the local region. Once any triangle–triangle intersection was detected, the deformation was reduced to a location with the triangle–triangle intersection no longer existing. It should be noted that, in the recovered sulci, the outer cortical surface will continue to deform until the opposite sulcal banks closely approaching each other, while still being free of mesh self-intersection, to locate the outer cortical surface (Li et al., 2014c). Finally, for each vertex, its CT was computed as the average value of the minimum distance from inner to outer surfaces and the minimum distance from outer to inner surfaces (Li et al., 2014c). Figure 1 shows an example of cortical surface reconstruction and CT measurement for a neonatal MR image. Our constructed cortical surfaces achieved submillimeter accuracy, as these surfaces were not constrained to voxel grids of the image with 1 mm resolution and also the surface distance error was <0.5 mm in simulated infant brain images (Li et al., 2014c). To study the differences of CT between sulci and gyri, each inner cortical surface was further partitioned into sulcal regions and gyral regions by using the method in Li et al. (2009), which employed the hidden Markov random field model and the expectation maximization algorithm on the maximum principal curvatures (Fig. 1b) of the cortical surface. Finally, to analyze hemispheric asymmetries, the cortical surfaces of the right hemisphere were mirror-flipped onto the counterparts of the left hemisphere along the midsagittal plane (Li et al., 2014d). For cortical surface registration, all inner cortical surfaces of the left and mirror-flip right hemispheres were further smoothed, inflated, and mapped to a sphere by minimizing the metric distortion (Fischl et al., 1999).
Figure 1.

An illustration of reconstructed cortical surfaces for a neonatal MRI at 40.4 weeks of gestational age. a, Reconstructed inner (green) and outer cortical surface (red) overlaid on the T2-weighted MRI. b, Inner cortical surface color-coded by maximum principal curvature. c, Outer cortical surface color-coded by CT (in millimeters).
To analyze longitudinal development, for each hemisphere of each subject, the cortical surface at 0 year of age was aligned onto the corresponding cortical surface at 1 year of age using Spherical Demons (Yeo et al., 2010). Similarly, the cortical surface at 1 year of age was aligned onto the corresponding cortical surface at 2 years of age. To analyze population patterns and hemispheric asymmetries, we also established both intersubject and left–right hemispheric vertex-to-vertex cortical correspondences for each age. Specifically, for each age, a hemisphere-unbiased surface-based atlas of cortical structures was first built by nonlinear groupwise registration of the left and mirror-flipped right spherical cortical surfaces of all subjects by using Spherical Demons based on their cortical folding geometries (Yeo et al., 2010), thus ensuring no bias toward any particular individual and any hemisphere in the generated surface atlas. Next, the left and mirror-flipped right cortical surfaces of all subjects at each age were nonlinearly aligned onto the age-matched, hemisphere-unbiased surface-based atlas. At each age, the left and mirror-flipped right cortical surfaces of each subject were then resampled to standard-mesh tessellations with 163,842 vertices (eighth-order icosahedral tessellation), based on the deformation fields from the surface-based atlas to the individual cortical surfaces, thus establishing the vertex-to-vertex cortical correspondences across all subjects and both hemispheres at the same age. Of note, we chose mesh tessellation with 163,842 vertices to well preserve the spatially detailed information of the convoluted cortical surface in 2 year olds, which typically had around 110,000 vertices for each native cortical surface. For each vertex, its asymmetry index (AI) of CT was computed as AI = (left − right)/[0.5 (left + right)]. Herein, a positive AI indicates leftward hemispheric asymmetry (with the left thicker than the right), and a negative AI indicates rightward asymmetry.
Regions of interest definition
To analyze CT patterns in CS, we first manually labeled its anterior and posterior sulcal banks on cortical surface atlas at each age, and then propagated these labels from surface atlases onto each individual cortical surface based on surface registration results. To parcellate each cortical surface into four lobes (i.e., frontal, parietal, temporal, and occipital lobes), we also manually delineated four lobes on surface atlases based on parcellation protocol defined in Desikan et al. (2006), and then propagated labels from surface atlases onto each individual cortical surface. Compared with manual labeling of each individual cortical surface, this strategy greatly reduced both time and effort and also was less sensitive to inter-rater variations, and thus had been widely used in current neuroimaging studies.
Statistical analysis
To test the statistical significance of thick/thin regions, longitudinal changes, and hemispheric asymmetries of CT, we adopted a surface-based threshold-free cluster enhancement (TFCE) method in Caret software (Hill et al., 2010b). The TFCE method was originally developed for volumetric neuroimaging data (Smith and Nichols, 2009) and then was extended to the surface data (Hill et al., 2010a,b). In particular, the surface-based TFCE method has been used for statistical analysis in prior studies of (1) cortical surface expansion during postnatal development and evolution (Hill et al., 2010b), (2) cortical local gyrification growth in infants (Li et al., 2014b), and (3) hemispheric asymmetries of sulcal depth and SA in both infants and adults (Hill et al., 2010a; Van Essen et al., 2012; Li et al., 2014d). In this paper, to use the surface-based TFCE method, the following operations were carried out. First, the CT map of each resampled cortical surface was smoothed 160 times by using an iterative nearest-neighbor-averaging procedure to account for possible noises in CT measurement. At each iteration, the thickness value at a vertex was replaced by the average of its value and the mean value of its immediate neighbors. Second, (1) to test the statistical significance of thin or thick cortices, for each CT map, its “paired thickness map” with all vertices being assigned its average thickness was generated, and then a paired t statistic was calculated between them at each vertex for each age; (2) to test the statistical significance of longitudinal CT change, a paired t statistic was calculated between CT at i-th and i +1-th (i ϵ 0, 1) years of age at each vertex; (3) to test the statistical significance of hemispheric asymmetries, a paired t statistic was calculated between left and right hemispheres at each vertex for each age. Third, the surface identities of each CT map were randomized 5000 times, and the corresponding paired t maps were generated. Finally, the surface-based TFCE was used to identify the statistically significant clusters (Hill et al., 2010b). More details on the surface-based TFCE can be found in Hill et al. (2010a).
Gender, twin/singleton status, and GA at birth have been reported to possibly affect CT in adults and older children (Sowell et al., 2007; Dubois et al., 2008; Nagy et al., 2011; Baron et al., 2012; Lyall et al., 2014). To test the effects of these factors on CT in infants, we adopted SurfStat, a toolbox for statistical analysis of cortical surface data based on random field theory (Chung et al., 2010). Specifically, in each age group, parameter estimates for dependent variable yi (CT of a vertex or its asymmetry index) were obtained by regression of a general linear model for subject i, with the gender, age at MRI, total brain volume (TBV), GA at birth, and twin/singleton status as covariates: yi = β0 + β1Genderi + β2Agei + β3TBVi + β4GAi + β5Twini + εi, where εi in an error term.
Note that TBV was also incorporated into the statistical model as in Lyall et al. (2014) for studying regional CT, since gender effects may be caused by differences in TBV. Multiple comparisons were corrected by a random field theory-based cluster analysis (Worsley et al., 2004), using p < 0.05 (two-tailed) cluster-significance threshold.
To test the statistical significance of CT between sulci and gyri, a paired t test was performed between sulci and gyri at each lobe of each hemisphere for each age. Similarly, a paired t test was performed between different banks of CS and also between different lobes at each hemisphere for each age.
To study the correlation between CT and its growth percentage on the whole-cortex and whole-population level, the Pearson's correlation coefficient was calculated between the population-average CT map and its growth percentage map across the whole cortex.
Results
Spatial patterns of CT
On the left hemisphere, the average CT across the 73 subjects was 1.97 ± 0.06 mm at year 0, 2.81 ± 0.08 mm at year 1, and 2.83 ± 0.07 mm at year 2. On the right hemisphere, the value was 1.99 ± 0.06 mm at year 0, 2.83 ± 0.08 mm at year 1, and 2.85 ± 0.07 mm at year 2. As we can see, CT increased dramatically (42.4% increase on average) in the first year, and then changed relatively little (0.7% increase on average) in the second year. The average CT of each lobe was significantly different from those of the other lobes (p < 1E-10, by using paired t test). Overall, frontal and temporal lobes consistently had relatively thick cortices in the first 2 years, while occipital lobe consistently had relatively thin cortices. Figure 2a further depicted the vertex-wise maps of the spatial distribution of the longitudinal CT at 0, 1, and 2 years of age on the age-matched average cortical surfaces. At each age, CT varied considerably across different regions on the cortex. Figure 2b showed the cortical regions that were significantly thicker (red clusters) or thinner (blue clusters) than the average CT of the cortex at 0, 1, and 2 years of age, by TFCE method (p < 0.01). Strikingly, the spatial distribution of thick and thin cortices was generally quite consistent at 0, 1, and 2 years of age, with bilaterally relatively symmetric patterns. Specifically, the regions consistently having thick cortices were mainly found in (1) the superior frontal gyrus, inferior frontal gyrus, frontal pole, and Rolandic operculum; (2) superior, middle, and inferior temporal gyri, temporal pole, and insula cortex; (3) supramarginal and angular gyri; (4) medial superior frontal and orbitofrontal gyri; (5) cingulate gyrus and precuneus cortex. Meanwhile, the regions consistently having thin cortices were found in the precentral gyrus, postcentral gyrus, paracentral lobule, superior parietal cortex, and occipital cortex, as well as many major sulci, including the superior frontal, inferior frontal, superior temporal, precentral, postcentral, intraparietal, posterior cingulate, calcarine, parieto-occipital, and collateral sulci. In the first year, notable changes of the relative distribution of CT presented in some regions, including middle frontal gyrus (converting from a relatively thin region at birth to a relatively thick region at year 1), cuneus cortex (converting from a relatively thick region at birth to a relatively thin region at year 1), and lingual gyrus (converting from a relatively thick region at birth to a nonsignificant region at year 1). No significant effect of gender and TBV on CT was found in any region at 0, 1, and 2 years of age. Similarly, no significant effect of singleton/twin status and GA at birth on CT was identified in any region at the three ages.
Figure 2.

Spatial distribution of CT of 73 infants at 0, 1, and 2 years of age. a, Vertex-wise maps of CT (in millimeters). b, Regions with CT significantly thicker (red clusters) or thinner (blue clusters) than the average thickness by TFCE (p < 0.01).
Longitudinal development of CT
To show the regionally heterogeneous development of CT, Figure 3 depicted the vertex-wise average growth rate of CT and its statistically significant clusters in the first and second years. In the first year, CT increased dynamically and significantly in almost all regions, except CS and calcarine fissure. Intriguingly, high-growth regions of CT in the first year were mainly found in regions with thick cortices, such as the lateral and medial superior frontal gyrus, inferior frontal gyrus, superior temporal gyrus, middle temporal gyrus, inferior parietal cortex, insula cortex, and orbitofrontal cortex. On the other hand, low-growth regions of CT were mainly found in regions with thin cortices, such as the precentral gyrus, postcentral gyrus, paracentral lobule, superior parietal cortex, and occipital cortex. We further performed correlation analysis between population-average CT growth map in the first year and the population-average CT maps at 0 and 1 year of age on the whole-surface level, respectively. At both ages, significant correlation was found (at 0 year, Pearson correlation coefficient r = 0.30 for left hemisphere, r = 0.26 for right hemisphere, p < 0.000001; at 1 year, r = 0.79 for left hemisphere, r = 0.77 for right hemisphere, p < 0.000001). To further confirm the correlation, Figure 4 provided the scatter plots of population-average CT growth percentage in the first year versus the population-average CT at 0 and 1 year at each 100th vertex (represented by a small circle), approximately uniformly distributing on the cortical surface. All these results suggested that on a whole-surface level the growth rate of CT in the first year was correlated with absolute CT at 0 and 1 year of age.
Figure 3.

Longitudinal development of CT of 73 infants in the first 2 years. a, Vertex-wise maps of thickness change percentage. b, Significant regions of thickness change by TFCE (p < 0.01).
Figure 4.

Scatter plots of CT growth percentage in the first year (y-axis) versus CT in millimeters (x-axis) at 0 year and 1 year at each 100th vertex (represented by a small circle) of the whole population.
In the second year, CT continuously increased significantly in the precentral gyrus, postcentral gyrus, superior frontal sulcus, inferior frontal sulcus, STS, superior parietal cortex, paracentral lobule, posterior portions of cingulate sulcus, occipital pole, and entorhinal cortex (EC). Meanwhile, CT decreased significantly in bilateral medial superior frontal, orbitofrontal, and superior temporal cortices, left pars opercularis, right inferior frontal gyrus, right frontal pole, and right cuneus cortex.
Sulcal–gyral differences of CT
To further investigate the region-specific differences of CT between sulci and gyri, Figure 5 showed the means and SDs of CT on sulci and gyri of each of the four lobes (i.e., frontal, parietal, temporal, and occipital lobes) at 0, 1, and 2 years of age (obtained from the 73 subjects). On both gyri and sulci, the average CT of each lobe was significant different from those of other lobes (p < 0.0001, by using paired t test). On gyri, from 0 to 2 years of age, the frontal and temporal lobes consistently exhibited relatively large CT, whereas the occipital lobe consistently showed small CT. On sulci, the frontal, temporal, and parietal lobes consistently exhibited relatively large CT, whereas the occipital lobe consistently showed small CT. In all four lobes, CT on gyri was consistently significantly larger than that on sulci (p < 1E-10, by using paired t test for each lobe) at 0, 1, and 2 years of age. The temporal lobes consistently exhibited larger difference of CT between sulci and gyri than the parietal and occipital lobes (Fig. 6).
Figure 5.

Means and SDs of CT on sulci, gyri, and whole cortex of each lobe at 0, 1, and 2 years of age (obtained from 73 infants).
Figure 6.

Percentages of CT on gyri larger than on sulci in the four lobes at 0, 1, and 2 years of age.
We further studied CT patterns in CS. As can be seen from Table 2, the anterior bank of CS had thicker cortex consistently at 0, 1, and 2 years of age than the posterior bank, except that the left hemisphere at year 0 did not reach the statistical significance (p = 0.068).
Table 2.
Means and SDs of CT in the anterior and posterior banks of the CS at 0, 1, and 2 years of age
| 0 year |
1 year |
2 years |
||||
|---|---|---|---|---|---|---|
| Left hemisphere | Right hemisphere | Left hemisphere | Right hemisphere | Left hemisphere | Right hemisphere | |
| Anterior bank thickness (mm) | 1.99 ± 0.10 | 2.03 ± 0.12 | 2.22 ± 0.11 | 2.21 ± 0.11 | 2.34 ± 0.10 | 2.32 ± 0.09 |
| Posterior bank thickness (mm) | 1.97 ± 0.11 | 1.96 ± 0.12 | 2.06 ± 0.12 | 2.02 ± 0.13 | 2.13 ± 0.08 | 2.10 ± 0.09 |
| P valuea | 0.068 | 9.81E-10 | 5.00E-22 | 1.96E-26 | 4.61E-34 | 3.06E-31 |
a Statistical significance is based on paired t test.
Hemispheric asymmetries of CT
The average CT of the right hemisphere was 1.02, 0.71, and 0.71% larger than that of the left hemisphere at 0, 1, and 2 years of age, respectively, with p value <0.0001 for each age. On the parietal and temporal lobes, the right hemisphere consistently had larger average CT than the left hemisphere at 0, 1, and 2 years of age, with p < 0.001 for each age. On the occipital lobe, the right hemisphere had larger average CT than the left hemisphere at 0 year of age, with p < 0.01, but no significant asymmetries at 1 and 2 years of age. On the frontal lobe, the right hemisphere had larger average CT than the left hemisphere at 0 year of age (p < 0.001), but no significant asymmetries at 1 and 2 years of age. To characterize the region-specific patterns of CT asymmetries, Figure 7a showed the vertex-wise map of the AI of CT at 0, 1, and 2 years of age. As we can see, CT exhibited regionally quite variable and age-specific asymmetric patterns. In general, the regions of rightward asymmetries mainly located on the lateral cortex, whereas the regions of leftward asymmetries mainly presented on the medial surface (Fig. 7b). At 0 year of age, the lateral temporal cortex, insula cortex, portions of lateral occipital cortex, and pars orbitalis cortex exhibited rightward asymmetries (covering 16.6% of total SA), whereas the cingulate sulcus and medial temporal cortex exhibited leftward asymmetries (covering 3.6% of total SA). At 1 year of age, the clusters of rightward asymmetries gradually shrunk to include only the lateral temporal cortex and posterior insula cortex (covering 13.4% of total SA), while the regions of leftward asymmetries expanded dramatically to include the superior frontal gyrus, cingulate cortex, medial orbitofrontal cortex, medial temporal cortex, lingual gyrus, and a portion of inferior temporal gyrus (covering 14.1% of total SA). At 2 years of age, the clusters of rightward asymmetries (covering 12.7% of total SA) were similar to those at 1 year of age, and more regions of leftward asymmetries (covering 20.2% of total SA) emerge, e.g., calcarine sulcus, portions of superior frontal gyrus, and an inferior portion of precentral gyrus. To better inspect hemispheric asymmetries and spatial distribution of CT, Figure 8 superposed significant clusters of left–right asymmetries onto significant clusters of thick/thin cortices. As we can see, asymmetric clusters were found in both thick and thin cortices, suggesting no strong association between left–right asymmetries and thick/thin cortices. Table 3 provided area overlaps between thin/thick cortices and asymmetric regions of CT at 0, 1, and 2 years of age. To further examine the individual and longitudinal variability of hemispheric asymmetries, Figure 9 provided the scatter plots of CT differences between the left and right hemispheres along with the longitudinal information in the representative significant regions at 0, 1, and 2 years of age. Note that left–right CT differences were computed based on the entire significant regions outlined on the cortical surface. As can be seen, there was considerable intersubject variability in terms of left–right CT differences at each age and also its longitudinal trajectories. For example, during the first 2 years, many subjects presented maximum leftward CT differences at 1 year, but a few subjects exhibited minimum leftward CT differences at 1 year. In addition, at 1 year of age, leftward CT differences exhibited larger intersubject variability than at 0 and 2 years of age. No significant effects of gender, TBV, twin/singleton, and GA at birth on CT asymmetries were found in any region at 0, 1, and 2 years of age.
Figure 7.
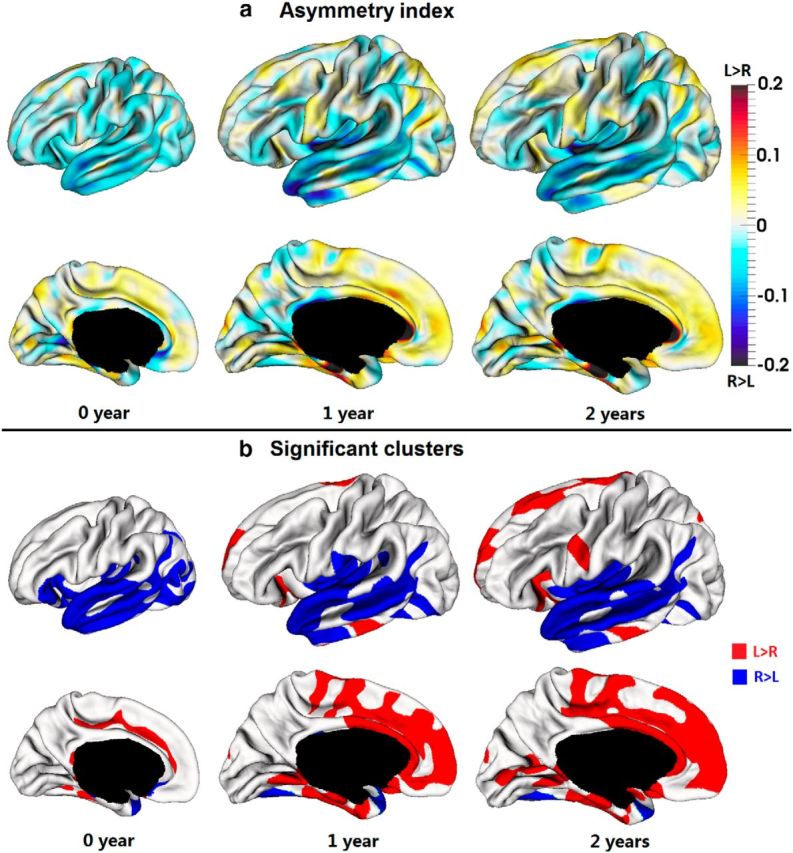
Hemispheric asymmetries of CT at 0, 1, and 2 years of age. a, Asymmetry index of CT. b, Regions with significant CT asymmetries by TFCE (p < 0.01).
Figure 8.

Overlaying significant clusters of CT asymmetry onto the significant clusters of thick/thin cortices on the inflated surfaces at 0, 1, and 2 years of age.
Table 3.
Area overlap percentages between thin/thick cortices and asymmetric regions of CT on the whole cortex at 0, 1, and 2 years of age
| Overlap | 0 year | 1 year | 2 years |
|---|---|---|---|
| Thick and leftward asymmetries | 1.0% | 6.7% | 10.9% |
| Thick and rightward asymmetries | 7.8% | 7.6% | 7.8% |
| Thin and leftward asymmetries | 1.2% | 2.8% | 4.8% |
| Thin and rightward asymmetries | 5.2% | 2.1% | 1.6% |
Figure 9.

Scatter plots of CT differences between left and right hemispheres with longitudinal information in the representative significant regions at 0, 1, and 2 years of age.
To compare CT asymmetries to SA asymmetries in our previous study (Li et al., 2014d), Figure 10 overlaid the significant clusters of these two cortical attributes in infants. As shown, CT and SA exhibited distinct asymmetry patterns. For example, in the lateral temporal cortex, rightward SA asymmetries were located in the posterior portion of STS, while leftward SA asymmetries were in the anterior portion of the lateral temporal cortex and transverse temporal gyrus (TTG) in infants. In contrast, all these regions showed rightward CT asymmetries. Quantitatively, the area overlaps of leftward CT asymmetries and leftward SA asymmetries were as follows: 1.1% at year 0, 0.9% at year 1, and 2.2% at year 2. While, the area overlaps between rightward CT asymmetries and rightward SA asymmetries were as follows: 3.6% at year 0, 4.0% at year 1, and 3.0% at year 2.
Figure 10.

Overlaying the significant clusters of SA asymmetries onto the significant clusters of CT asymmetries at 0, 1, and 2 years of age.
Discussion
Spatiotemporal patterns of CT
We showed that CT increased dynamically in the first year and changed relatively little thereafter. However, the relative spatial distribution of thin and thick cortices was largely consistent at 0, 1, and 2 years of age. Specifically, the precentral gyrus, postcentral gyrus, superior parietal cortex, and occipital cortex had thin cortices, whereas the prefrontal, lateral temporal, inferior parietal, and insula regions had thick cortices, supporting the region of interest (ROI)-based analysis in infants (Lyall et al., 2014), and also largely resembling those observed in adults and older children (Fischl and Dale, 2000; MacDonald et al., 2000; Sowell et al., 2004b; Nie et al., 2013). Moreover, gyri were significantly thicker than sulci in infants, consistent with adult histological (Brodmann, 1909; Economo and Parker, 1929) and MRI studies (Fischl and Dale, 2000; Fjell et al., 2009) and also postmortem infant studies (Bayer and Altman, 2004). In addition, the anterior bank of CS was found to be thicker than the posterior bank in infants, matching the findings in adult MRI studies (Meyer et al., 1996; Fischl and Dale, 2000; MacDonald et al., 2000). Taken together, our results suggest that the overall relative spatial patterns of CT are established at birth and change only modestly thereafter.
We revealed that CT exhibited regionally variable growth in the first year, except no significant changes in CS and calcarine fissure. Specifically, high-growth regions were found in the gyral regions of prefrontal, temporal, and inferior parietal cortices, as well as insula cortex and orbitofrontal cortex largely corresponding to heteromodal association cortices. Low-growth regions were mainly found in the precentral gyrus, postcentral gyrus, paracentral lobule, superior parietal cortex, and occipital cortex largely corresponding to unimodal cortices. Interestingly, we found that thin cortices experienced low growth of CT and thick cortices exhibited high growth in the first year. Actually, thin and thick cortices also exhibited distinct patterns in terms of evolution, development, and variability of functional connectivity. Studies of cortical surface expansion between macaque and human identified low expansion in thin cortices (precentral gyrus, medial temporal, and occipital cortices), and high expansion in thick cortices (prefrontal, lateral temporal, and inferior parietal cortices; Hill et al., 2010b). Studies of cortical LGI in the first year revealed low growth of LGI in thin cortices (precentral gyrus, postcentral gyrus, and occipital cortex) and high growth in thick cortices (lateral prefrontal, lateral temporal, and inferior parietal cortices; Li et al., 2014b). Resting-state functional MRI studies in adults showed low intersubject variability of functional connectivity in thin cortices (precentral gyrus, postcentral gyrus, and occipital cortex) and high variability in thick cortices (prefrontal, lateral temporal, and inferior parietal cortices; Mueller et al., 2013). These patterns are likely related to the cellular, genetic, and functional nonuniformities during evolution and development.
In the second year, CT continuously increased in many regions, such as precentral gyrus, postcentral gyrus, superior parietal, paracentral, superior frontal, middle frontal, occipital pole, and entorhinal regions. A recent study of children from 4 years of age showed no significant CT change in the EC during development (Amlien et al., 2014), suggesting that the EC may reach the maximum thickness between 2 and 4 years of age. The EC is the main gateway between the hippocampus and neocortex, and contains grid cells that constitute a positioning system in the brain (Hafting et al., 2005). Despite the prominent species differences in cortex complexity, the EC largely conserves its anatomy and functional roles during brain evolution (Kaas, 2009). Studies of rhesus macaque showed that the EC at 1 year of age, approximately corresponding to 3 years in human (Makris et al., 2007), reached 98% of CT in adults (Bogolepova, 1984), largely supporting our results.
We also revealed that CT in the second year decreased in several regions, including bilateral medial superior frontal, orbitofrontal, gyrus rectus, Rolandic operculum, and right frontal pole, inferior frontal, and cuneus cortices. ROI-based analysis also found cortical thinning in gyrus rectus, Rolandic operculum, and medial orbitofrontal regions (Lyall et al., 2014). More thinning regions identified in this study were likely attributable to the increased accuracy of our latest methods for infant tissue segmentation (Wang et al., 2014) and surface reconstruction (Li et al., 2014c). In two recent large-scale studies of cortical development from 3 (Brown et al., 2012) and 4 years of age (Amlien et al., 2014), CT exhibited a monotonic negative trajectory across almost the whole cortex. These results suggest that thickness may peak in infancy, contrary to some previous reports of thickness peaking in childhood (Shaw et al., 2008; Raznahan et al., 2011). To better define the developmental trajectories of CT, we are following up this infant cohort.
Hemispheric asymmetries of CT
We showed that hemispheric asymmetries of CT existed at birth and evolved substantially thereafter, which is consistent with the reports that CT asymmetries were age related (Shaw et al., 2009; Zhou et al., 2013). In the first 2 years, the clusters of rightward asymmetries shrank, while the clusters of leftward asymmetries expanded. These patterns are likely related to the bilaterally nonuniform development of cortex cytoarchitecture (Lyall et al., 2014). Specifically, we revealed rightward asymmetries in the lateral temporal and posterior insula regions in infants. MRI studies in adults and older children (from 5 years of age) also observed rightward CT asymmetries in the lateral temporal cortex (Kang et al., 2012; Koelkebeck et al., 2014), including the TTG (Meyer et al., 2014) and STS (Zhou et al., 2013). Of note, rightward CT asymmetries in STS are also consistent with the observation of maturation in the STS favoring the right side in terms of T2-weighted MR signals in infants (Leroy et al., 2011). We identified leftward CT asymmetries in the medial superior frontal cortex in infants, consistent with MRI studies in adults and older children (Luders et al., 2006; Kim et al., 2012; Zhou et al., 2013; Plessen et al., 2014). We found CT asymmetries in both thick and thin cortices, suggesting no strong association between left–right asymmetries and thick/thin cortices, consistent with the results in older children (Zhou et al., 2013).
We found CT and SA exhibited distinct hemispheric asymmetries in infants. Adult MRI studies also showed their distinct hemispheric asymmetries in the auditory-related cortex (Meyer et al., 2014), with TTG having rightward CT asymmetries and leftward SA asymmetries, consistent with our results. These results support the notion that CT and SA have distinct genetic underpinnings and cellular mechanisms (Rakic, 1988; Panizzon et al., 2009).
Limitations
This study has several potential limitations. First, due to the low spatial resolution and poor tissue contrast in the neonatal MRI, CT measurements of neonates are likely less accurate than those of 2 year olds. To address these problems, neonatal tissue segmentation was guided by the subject-specific longitudinal image at 2 years, which substantially increased the accuracy in surface reconstruction. However, as the neonatal cortex typically only has 1–2 voxels in thickness in current MRI, high-resolution MRI is highly needed. Second, due to the strong partial volume effects in neonatal MRI, the boundaries between deep, tight opposing sulci might not be noticeable, leading to less accuracy of thickness measure in deep sulci, compared with gyral crests. Last but not least, measuring CT using MRI is highly affected by the cortical fiber myelination (Sowell et al., 2004a; Glasser and Van Essen, 2011). In infants, each cortical region undergoes dynamic and differential maturation and myelination, thus leading to the regionally variable contrast at GM/WM transition zones in MRI. This causes potential biases in thickness comparison across regions, hemispheres, and ages. Actually, this is a common limitation in all structural MRI studies of brain development, but may be more pronounced in infants and also much more critical for measurement of CT than SA and LGI. In postmortem studies of term infants (Bayer and Altman, 2004) and adults (Economo and Parker, 1929), the occipital cortex is relatively thin, while the frontal and lateral temporal cortices are relatively thick, supporting our MRI findings in infants. One exception is that the precentral gyrus is relatively thick in adult histological studies (Economo and Parker, 1929), but its superior portion appears to be thin in our infant studies and in many adult studies using MRI (MacDonald et al., 2000; Han et al., 2004; Salat et al., 2004; Hutton et al., 2009; Zhou et al., 2013), which is likely caused by the ambiguous GM–WM boundaries in MRI. However, our observation that the anterior bank of CS is thicker than the posterior bank in infants is consistent with the adult histological studies (Economo and Parker, 1929) and postmortem MRI studies of infants (Bayer and Altman, 2004), suggesting that this is less likely caused by the differential myelinations in the two banks.
Conclusion
In summary, this study provides the first comprehensive and detailed picture of early patterns and evolution of CT in the first 2 years, and reveals several hitherto unseen characteristics of CT during infancy. Many neurodevelopmental disorders (Thompson et al., 2005; Shaw et al., 2007; Rimol et al., 2012; Zielinski et al., 2014) may already exhibit abnormal development of CT during this early postnatal stage. Therefore, it would be of great interest to study CT in high-risk infants as a possible tool for better detection of neurodevelopmental disorders.
Footnotes
References
- Amlien IK, Fjell AM, Tamnes CK, Grydeland H, Krogsrud SK, Chaplin TA, Rosa MG, Walhovd KB. Organizing principles of human cortical development—thickness and area from 4 to 30 years: insights from comparative primate neuroanatomy. Cereb Cortex. 2014 doi: 10.1093/cercor/bhu214. pii.bhu214. Advance online publication. Retrieved May 13, 2015. [DOI] [PubMed] [Google Scholar]
- Baron IS, Litman FR, Ahronovich MD, Baker R. Late preterm birth: a review of medical and neuropsychological childhood outcomes. Neuropsychol Rev. 2012;22:438–450. doi: 10.1007/s11065-012-9210-5. [DOI] [PubMed] [Google Scholar]
- Bayer SA, Altman J. Atlas of human central nervous system development v 2. Boca Raton, FL: CRC; 2004. The human brain during the third trimester. [Google Scholar]
- Bogolepova IN. Development of the entorhinal cortex in Macaca rhesus during ontogeny. Neurosci Behav Physiol. 1984;14:1–7. doi: 10.1007/BF01148722. [DOI] [PubMed] [Google Scholar]
- Brodmann K. Vergleichende Lokalisationslehre der Grosshirnrinde in ihren Prinzipien dargestellt auf Grund des Zellenbaues. Leipzig: Barth; 1909. [Google Scholar]
- Brown TT, Kuperman JM, Chung Y, Erhart M, McCabe C, Hagler DJ, Jr, Venkatraman VK, Akshoomoff N, Amaral DG, Bloss CS, Casey BJ, Chang L, Ernst TM, Frazier JA, Gruen JR, Kaufmann WE, Kenet T, Kennedy DN, Murray SS, Sowell ER, et al. Neuroanatomical assessment of biological maturity. Curr Biol. 2012;22:1693–1698. doi: 10.1016/j.cub.2012.07.002. [DOI] [PMC free article] [PubMed] [Google Scholar]
- Chung MK, Worsley KJ, Nacewicz BM, Dalton KM, Davidson RJ. General multivariate linear modeling of surface shapes using SurfStat. Neuroimage. 2010;53:491–505. doi: 10.1016/j.neuroimage.2010.06.032. [DOI] [PMC free article] [PubMed] [Google Scholar]
- Desikan RS, Ségonne F, Fischl B, Quinn BT, Dickerson BC, Blacker D, Buckner RL, Dale AM, Maguire RP, Hyman BT, Albert MS, Killiany RJ. An automated labeling system for subdividing the human cerebral cortex on MRI scans into gyral based regions of interest. Neuroimage. 2006;31:968–980. doi: 10.1016/j.neuroimage.2006.01.021. [DOI] [PubMed] [Google Scholar]
- Dubois J, Benders M, Borradori-Tolsa C, Cachia A, Lazeyras F, Ha-Vinh Leuchter R, Sizonenko SV, Warfield SK, Mangin JF, Hüppi PS. Primary cortical folding in the human newborn: an early marker of later functional development. Brain. 2008;131:2028–2041. doi: 10.1093/brain/awn137. [DOI] [PMC free article] [PubMed] [Google Scholar]
- Economo C, Parker S. The cytoarchitectonics of the human cerebral cortex. London: Oxford UP; 1929. [Google Scholar]
- Fischl B, Dale AM. Measuring the thickness of the human cerebral cortex from magnetic resonance images. Proc Natl Acad Sci U S A. 2000;97:11050–11055. doi: 10.1073/pnas.200033797. [DOI] [PMC free article] [PubMed] [Google Scholar]
- Fischl B, Sereno MI, Dale AM. Cortical surface-based analysis. II: Inflation, flattening, and a surface-based coordinate system. Neuroimage. 1999;9:195–207. doi: 10.1006/nimg.1998.0396. [DOI] [PubMed] [Google Scholar]
- Fjell AM, Westlye LT, Amlien I, Espeseth T, Reinvang I, Raz N, Agartz I, Salat DH, Greve DN, Fischl B, Dale AM, Walhovd KB. High consistency of regional cortical thinning in aging across multiple samples. Cereb Cortex. 2009;19:2001–2012. doi: 10.1093/cercor/bhn232. [DOI] [PMC free article] [PubMed] [Google Scholar]
- Gilmore JH, Shi F, Woolson SL, Knickmeyer RC, Short SJ, Lin W, Zhu H, Hamer RM, Styner M, Shen D. Longitudinal development of cortical and subcortical gray matter from birth to 2 years. Cereb Cortex. 2012;22:2478–2485. doi: 10.1093/cercor/bhr327. [DOI] [PMC free article] [PubMed] [Google Scholar]
- Glasser MF, Van Essen DC. Mapping human cortical areas in vivo based on myelin content as revealed by T1- and T2-weighted MRI. J Neurosci. 2011;31:11597–11616. doi: 10.1523/JNEUROSCI.2180-11.2011. [DOI] [PMC free article] [PubMed] [Google Scholar]
- Hafting T, Fyhn M, Molden S, Moser MB, Moser EI. Microstructure of a spatial map in the entorhinal cortex. Nature. 2005;436:801–806. doi: 10.1038/nature03721. [DOI] [PubMed] [Google Scholar]
- Han X, Pham DL, Tosun D, Rettmann ME, Xu C, Prince JL. CRUISE: cortical reconstruction using implicit surface evolution. Neuroimage. 2004;23:997–1012. doi: 10.1016/j.neuroimage.2004.06.043. [DOI] [PubMed] [Google Scholar]
- Hill J, Dierker D, Neil J, Inder T, Knutsen A, Harwell J, Coalson T, Van Essen D. A surface-based analysis of hemispheric asymmetries and folding of cerebral cortex in term-born human infants. J Neurosci. 2010a;30:2268–2276. doi: 10.1523/JNEUROSCI.4682-09.2010. [DOI] [PMC free article] [PubMed] [Google Scholar]
- Hill J, Inder T, Neil J, Dierker D, Harwell J, Van Essen D. Similar patterns of cortical expansion during human development and evolution. Proc Natl Acad Sci U S A. 2010b;107:13135–13140. doi: 10.1073/pnas.1001229107. [DOI] [PMC free article] [PubMed] [Google Scholar]
- Hutton C, Draganski B, Ashburner J, Weiskopf N. A comparison between voxel-based cortical thickness and voxel-based morphometry in normal aging. Neuroimage. 2009;48:371–380. doi: 10.1016/j.neuroimage.2009.06.043. [DOI] [PMC free article] [PubMed] [Google Scholar]
- Kaas JH. Evolutionary neuroscience. Oxford: Academic; 2009. [Google Scholar]
- Kang XJ, Herron TJ, Cate AD, Yund EW, Woods DL. Hemispherically-unified surface maps of human cerebral cortex: reliability and hemispheric asymmetries. PLoS One. 2012;7:e45582. doi: 10.1371/journal.pone.0045582. [DOI] [PMC free article] [PubMed] [Google Scholar]
- Kim JH, Lee JW, Kim GH, Roh JH, Kim MJ, Seo SW, Kim ST, Jeon S, Lee JM, Heilman KM, Na DL. Cortical asymmetries in normal, mild cognitive impairment, and Alzheimer's disease. Neurobiol Aging. 2012;33:1959–1966. doi: 10.1016/j.neurobiolaging.2011.06.026. [DOI] [PubMed] [Google Scholar]
- Knickmeyer RC, Gouttard S, Kang C, Evans D, Wilber K, Smith JK, Hamer RM, Lin W, Gerig G, Gilmore JH. A structural MRI study of human brain development from birth to 2 years. J Neurosci. 2008;28:12176–12182. doi: 10.1523/JNEUROSCI.3479-08.2008. [DOI] [PMC free article] [PubMed] [Google Scholar]
- Koelkebeck K, Miyata J, Kubota M, Kohl W, Son S, Fukuyama H, Sawamoto N, Takahashi H, Murai T. The contribution of cortical thickness and surface area to gray matter asymmetries in the healthy human brain. Hum Brain Mapp. 2014;35:6011–6022. doi: 10.1002/hbm.22601. [DOI] [PMC free article] [PubMed] [Google Scholar]
- Leroy F, Glasel H, Dubois J, Hertz-Pannier L, Thirion B, Mangin JF, Dehaene-Lambertz G. Early maturation of the linguistic dorsal pathway in human infants. J Neurosci. 2011;31:1500–1506. doi: 10.1523/JNEUROSCI.4141-10.2011. [DOI] [PMC free article] [PubMed] [Google Scholar]
- Li G, Guo L, Nie J, Liu T. Automatic cortical sulcal parcellation based on surface principal direction flow field tracking. Neuroimage. 2009;46:923–937. doi: 10.1016/j.neuroimage.2009.03.039. [DOI] [PMC free article] [PubMed] [Google Scholar]
- Li G, Nie J, Wu G, Wang Y, Shen D, Shen D. Consistent reconstruction of cortical surfaces from longitudinal brain MR images. Neuroimage. 2012;59:3805–3820. doi: 10.1016/j.neuroimage.2011.11.012. [DOI] [PMC free article] [PubMed] [Google Scholar]
- Li G, Nie J, Wang L, Shi F, Lin W, Gilmore JH, Shen D. Mapping region-specific longitudinal cortical surface expansion from birth to 2 years of age. Cereb Cortex. 2013;23:2724–2733. doi: 10.1093/cercor/bhs265. [DOI] [PMC free article] [PubMed] [Google Scholar]
- Li G, Wang L, Shi F, Lin W, Shen D. Constructing 4D infant cortical surface atlases based on dynamic developmental trajectories of the cortex. In: Golland P, Hata N, Barillot C, Hornegger J, Howe R, editors. Medical image computing and computer-assisted intervention—MICCAI 2014. Cham, Switzerland: Springer International Publishing; 2014a. pp. 89–96. [DOI] [PMC free article] [PubMed] [Google Scholar]
- Li G, Wang L, Shi F, Lyall AE, Lin W, Gilmore JH, Shen D. Mapping longitudinal development of local cortical gyrification in infants from birth to 2 years of age. J Neurosci. 2014b;34:4228–4238. doi: 10.1523/JNEUROSCI.3976-13.2014. [DOI] [PMC free article] [PubMed] [Google Scholar]
- Li G, Nie J, Wang L, Shi F, Gilmore JH, Lin W, Shen D. Measuring the dynamic longitudinal cortex development in infants by reconstruction of temporally consistent cortical surfaces. Neuroimage. 2014c;90:266–279. doi: 10.1016/j.neuroimage.2013.12.038. [DOI] [PMC free article] [PubMed] [Google Scholar]
- Li G, Nie J, Wang L, Shi F, Lyall AE, Lin W, Gilmore JH, Shen D. Mapping longitudinal hemispheric structural asymmetries of the human cerebral cortex from birth to 2 years of age. Cereb Cortex. 2014d;24:1289–1300. doi: 10.1093/cercor/bhs413. [DOI] [PMC free article] [PubMed] [Google Scholar]
- Li G, Wang L, Shi F, Lin W, Shen D. Simultaneous and consistent labeling of longitudinal dynamic developing cortical surfaces in infants. Med Image Anal. 2014e;18:1274–1289. doi: 10.1016/j.media.2014.06.007. [DOI] [PMC free article] [PubMed] [Google Scholar]
- Li G, Wang L, Shi F, Lyall AE, Ahn M, Peng Z, Zhu H, Lin W, Gilmore JH, Shen D. Cortical thickness and surface area in neonates at high risk for schizophrenia. Brain Struct Funct. 2014f doi: 10.1007/s00429-014-0917-3. Advance online publication. Retrieved May 13, 2015. [DOI] [PMC free article] [PubMed] [Google Scholar]
- Luders E, Narr KL, Thompson PM, Rex DE, Jancke L, Toga AW. Hemispheric asymmetries in cortical thickness. Cereb Cortex. 2006;16:1232–1238. doi: 10.1093/cercor/bhj064. [DOI] [PubMed] [Google Scholar]
- Lyall AE, Shi F, Geng X, Woolson S, Li G, Wang L, Hamer RM, Shen D, Gilmore JH. Dynamic development of regional cortical thickness and surface area in early childhood. Cereb Cortex. 2014 doi: 10.1093/cercor/bhu027. Advance online publication. Retrieved May 13, 2015. [DOI] [PMC free article] [PubMed] [Google Scholar]
- MacDonald D, Kabani N, Avis D, Evans AC. Automated 3-D extraction of inner and outer surfaces of cerebral cortex from MRI. Neuroimage. 2000;12:340–356. doi: 10.1006/nimg.1999.0534. [DOI] [PubMed] [Google Scholar]
- Makris N, Papadimitriou GM, van der Kouwe A, Kennedy DN, Hodge SM, Dale AM, Benner T, Wald LL, Wu O, Tuch DS, Caviness VS, Moore TL, Killiany RJ, Moss MB, Rosene DL. Frontal connections and cognitive changes in normal aging rhesus monkeys: a DTI study. Neurobiol Aging. 2007;28:1556–1567. doi: 10.1016/j.neurobiolaging.2006.07.005. [DOI] [PubMed] [Google Scholar]
- Meng Y, Li G, Lin W, Gilmore JH, Shen D. Spatial distribution and longitudinal development of deep cortical sulcal landmarks in infants. Neuroimage. 2014;100:206–218. doi: 10.1016/j.neuroimage.2014.06.004. [DOI] [PMC free article] [PubMed] [Google Scholar]
- Meyer JR, Roychowdhury S, Russell EJ, Callahan C, Gitelman D, Mesulam MM. Location of the central sulcus via cortical thickness of the precentral and postcentral gyri on MR. AJNR Am J Neuroradiol. 1996;17:1699–1706. [PMC free article] [PubMed] [Google Scholar]
- Meyer M, Liem F, Hirsiger S, Jäncke L, Hänggi J. Cortical surface area and cortical thickness demonstrate differential structural asymmetry in auditory-related areas of the human cortex. Cereb Cortex. 2014;24:2541–2552. doi: 10.1093/cercor/bht094. [DOI] [PubMed] [Google Scholar]
- Mueller S, Wang D, Fox MD, Yeo BT, Sepulcre J, Sabuncu MR, Shafee R, Lu J, Liu H. Individual variability in functional connectivity architecture of the human brain. Neuron. 2013;77:586–595. doi: 10.1016/j.neuron.2012.12.028. [DOI] [PMC free article] [PubMed] [Google Scholar]
- Nagy Z, Lagercrantz H, Hutton C. Effects of preterm birth on cortical thickness measured in adolescence. Cereb Cortex. 2011;21:300–306. doi: 10.1093/cercor/bhq095. [DOI] [PMC free article] [PubMed] [Google Scholar]
- Nie J, Li G, Wang L, Gilmore JH, Lin W, Shen D. A computational growth model for measuring dynamic cortical development in the first year of life. Cereb Cortex. 2012;22:2272–2284. doi: 10.1093/cercor/bhr293. [DOI] [PMC free article] [PubMed] [Google Scholar]
- Nie J, Li G, Shen D. Development of cortical anatomical properties from early childhood to early adulthood. Neuroimage. 2013;76:216–224. doi: 10.1016/j.neuroimage.2013.03.021. [DOI] [PMC free article] [PubMed] [Google Scholar]
- Nie J, Li G, Wang L, Shi F, Lin W, Gilmore JH, Shen D. Longitudinal development of cortical thickness, folding, and fiber density networks in the first 2 years of life. Hum Brain Mapp. 2014;35:3726–3737. doi: 10.1002/hbm.22432. [DOI] [PMC free article] [PubMed] [Google Scholar]
- Panizzon MS, Fennema-Notestine C, Eyler LT, Jernigan TL, Prom-Wormley E, Neale M, Jacobson K, Lyons MJ, Grant MD, Franz CE, Xian H, Tsuang M, Fischl B, Seidman L, Dale A, Kremen WS. Distinct genetic influences on cortical surface area and cortical thickness. Cereb Cortex. 2009;19:2728–2735. doi: 10.1093/cercor/bhp026. [DOI] [PMC free article] [PubMed] [Google Scholar]
- Plessen KJ, Hugdahl K, Bansal R, Hao X, Peterson BS. Sex, age, and cognitive correlates of asymmetries in thickness of the cortical mantle across the life span. J Neurosci. 2014;34:6294–6302. doi: 10.1523/JNEUROSCI.3692-13.2014. [DOI] [PMC free article] [PubMed] [Google Scholar]
- Rakic P. Specification of cerebral cortical areas. Science. 1988;241:170–176. doi: 10.1126/science.3291116. [DOI] [PubMed] [Google Scholar]
- Raznahan A, Shaw P, Lalonde F, Stockman M, Wallace GL, Greenstein D, Clasen L, Gogtay N, Giedd JN. How does your cortex grow? J Neurosci. 2011;31:7174–7177. doi: 10.1523/JNEUROSCI.0054-11.2011. [DOI] [PMC free article] [PubMed] [Google Scholar]
- Rimol LM, Nesvåg R, Hagler DJ, Jr, Bergmann O, Fennema-Notestine C, Hartberg CB, Haukvik UK, Lange E, Pung CJ, Server A, Melle I, Andreassen OA, Agartz I, Dale AM. Cortical volume, surface area, and thickness in schizophrenia and bipolar disorder. Biol Psychiatry. 2012;71:552–560. doi: 10.1016/j.biopsych.2011.11.026. [DOI] [PubMed] [Google Scholar]
- Salat DH, Buckner RL, Snyder AZ, Greve DN, Desikan RS, Busa E, Morris JC, Dale AM, Fischl B. Thinning of the cerebral cortex in aging. Cereb Cortex. 2004;14:721–730. doi: 10.1093/cercor/bhh032. [DOI] [PubMed] [Google Scholar]
- Shaw P, Eckstrand K, Sharp W, Blumenthal J, Lerch JP, Greenstein D, Clasen L, Evans A, Giedd J, Rapoport JL. Attention-deficit/hyperactivity disorder is characterized by a delay in cortical maturation. Proc Natl Acad Sci U S A. 2007;104:19649–19654. doi: 10.1073/pnas.0707741104. [DOI] [PMC free article] [PubMed] [Google Scholar]
- Shaw P, Kabani NJ, Lerch JP, Eckstrand K, Lenroot R, Gogtay N, Greenstein D, Clasen L, Evans A, Rapoport JL, Giedd JN, Wise SP. Neurodevelopmental trajectories of the human cerebral cortex. J Neurosci. 2008;28:3586–3594. doi: 10.1523/JNEUROSCI.5309-07.2008. [DOI] [PMC free article] [PubMed] [Google Scholar]
- Shaw P, Lalonde F, Lepage C, Rabin C, Eckstrand K, Sharp W, Greenstein D, Evans A, Giedd JN, Rapoport J. Development of cortical asymmetry in typically developing children and its disruption in attention-deficit/hyperactivity disorder. Arch Gen Psychiatry. 2009;66:888–896. doi: 10.1001/archgenpsychiatry.2009.103. [DOI] [PMC free article] [PubMed] [Google Scholar]
- Shen D, Davatzikos C. HAMMER: hierarchical attribute matching mechanism for elastic registration. IEEE Trans Med Imaging. 2002;21:1421–1439. doi: 10.1109/TMI.2002.803111. [DOI] [PubMed] [Google Scholar]
- Shi F, Yap PT, Wu G, Jia H, Gilmore JH, Lin W, Shen D. Infant brain atlases from neonates to 1- and 2-year-olds. PLoS One. 2011;6:e18746. doi: 10.1371/journal.pone.0018746. [DOI] [PMC free article] [PubMed] [Google Scholar]
- Shi F, Wang L, Dai Y, Gilmore JH, Lin W, Shen D. LABEL: pediatric brain extraction using learning-based meta-algorithm. Neuroimage. 2012a;62:1975–1986. doi: 10.1016/j.neuroimage.2012.05.042. [DOI] [PMC free article] [PubMed] [Google Scholar]
- Shi F, Yap PT, Gao W, Lin W, Gilmore JH, Shen D. Altered structural connectivity in neonates at genetic risk for schizophrenia: a combined study using morphological and white matter networks. Neuroimage. 2012b;62:1622–1633. doi: 10.1016/j.neuroimage.2012.05.026. [DOI] [PMC free article] [PubMed] [Google Scholar]
- Sled JG, Zijdenbos AP, Evans AC. A nonparametric method for automatic correction of intensity nonuniformity in MRI data. IEEE Trans Med Imaging. 1998;17:87–97. doi: 10.1109/42.668698. [DOI] [PubMed] [Google Scholar]
- Smith SM, Nichols TE. Threshold-free cluster enhancement: addressing problems of smoothing, threshold dependence and localisation in cluster inference. Neuroimage. 2009;44:83–98. doi: 10.1016/j.neuroimage.2008.03.061. [DOI] [PubMed] [Google Scholar]
- Sowell ER, Thompson PM, Toga AW. Mapping changes in the human cortex throughout the span of life. Neuroscientist. 2004a;10:372–392. doi: 10.1177/1073858404263960. [DOI] [PubMed] [Google Scholar]
- Sowell ER, Thompson PM, Leonard CM, Welcome SE, Kan E, Toga AW. Longitudinal mapping of cortical thickness and brain growth in normal children. J Neurosci. 2004b;24:8223–8231. doi: 10.1523/JNEUROSCI.1798-04.2004. [DOI] [PMC free article] [PubMed] [Google Scholar]
- Sowell ER, Peterson BS, Kan E, Woods RP, Yoshii J, Bansal R, Xu D, Zhu H, Thompson PM, Toga AW. Sex differences in cortical thickness mapped in 176 healthy individuals between 7 and 87 years of age. Cereb Cortex. 2007;17:1550–1560. doi: 10.1093/cercor/bhl066. [DOI] [PMC free article] [PubMed] [Google Scholar]
- Thompson PM, Lee AD, Dutton RA, Geaga JA, Hayashi KM, Eckert MA, Bellugi U, Galaburda AM, Korenberg JR, Mills DL, Toga AW, Reiss AL. Abnormal cortical complexity and thickness profiles mapped in Williams syndrome. J Neurosci. 2005;25:4146–4158. doi: 10.1523/JNEUROSCI.0165-05.2005. [DOI] [PMC free article] [PubMed] [Google Scholar]
- Toga AW, Thompson PM. Mapping brain asymmetry. Nat Rev Neurosci. 2003;4:37–48. doi: 10.1038/nrn1009. [DOI] [PubMed] [Google Scholar]
- Van Essen DC, Glasser MF, Dierker DL, Harwell J, Coalson T. Parcellations and hemispheric asymmetries of human cerebral cortex analyzed on surface-based atlases. Cereb Cortex. 2012;22:2241–2262. doi: 10.1093/cercor/bhr291. [DOI] [PMC free article] [PubMed] [Google Scholar]
- Wang L, Shi F, Lin W, Gilmore JH, Shen D. Automatic segmentation of neonatal images using convex optimization and coupled level sets. Neuroimage. 2011;58:805–817. doi: 10.1016/j.neuroimage.2011.06.064. [DOI] [PMC free article] [PubMed] [Google Scholar]
- Wang L, Shi F, Yap PT, Lin W, Gilmore JH, Shen D. Longitudinally guided level sets for consistent tissue segmentation of neonates. Hum Brain Mapp. 2013;34:956–972. doi: 10.1002/hbm.21486. [DOI] [PMC free article] [PubMed] [Google Scholar]
- Wang L, Shi F, Li G, Gao Y, Lin W, Gilmore JH, Shen D. Segmentation of neonatal brain MR images using patch-driven level sets. Neuroimage. 2014;84:141–158. doi: 10.1016/j.neuroimage.2013.08.008. [DOI] [PMC free article] [PubMed] [Google Scholar]
- Worsley KJ, Taylor JE, Tomaiuolo F, Lerch J. Unified univariate and multivariate random field theory. Neuroimage. 2004;23(suppl 1):S189–S195. doi: 10.1016/j.neuroimage.2004.07.026. [DOI] [PubMed] [Google Scholar]
- Wu G, Qi F, Shen D. Learning-based deformable registration of MR brain images. IEEE Trans Med Imaging. 2006;25:1145–1157. doi: 10.1109/TMI.2006.879320. [DOI] [PubMed] [Google Scholar]
- Wu G, Jia H, Wang Q, Shen D. SharpMean: groupwise registration guided by sharp mean image and tree-based registration. Neuroimage. 2011;56:1968–1981. doi: 10.1016/j.neuroimage.2011.03.050. [DOI] [PMC free article] [PubMed] [Google Scholar]
- Yeo BT, Sabuncu MR, Vercauteren T, Ayache N, Fischl B, Golland P. Spherical Demons: fast diffeomorphic landmark-free surface registration. IEEE Trans Med Imaging. 2010;29:650–668. doi: 10.1109/TMI.2009.2030797. [DOI] [PMC free article] [PubMed] [Google Scholar]
- Zhou D, Lebel C, Evans A, Beaulieu C. Cortical thickness asymmetry from childhood to older adulthood. Neuroimage. 2013;83:66–74. doi: 10.1016/j.neuroimage.2013.06.073. [DOI] [PubMed] [Google Scholar]
- Zielinski BA, Prigge MB, Nielsen JA, Froehlich AL, Abildskov TJ, Anderson JS, Fletcher PT, Zygmunt KM, Travers BG, Lange N, Alexander AL, Bigler ED, Lainhart JE. Longitudinal changes in cortical thickness in autism and typical development. Brain. 2014;137:1799–1812. doi: 10.1093/brain/awu083. [DOI] [PMC free article] [PubMed] [Google Scholar]