

Abstract
Chronic heavy alcohol use is known to cause gut leakiness and alcoholic liver disease (ALD), but only 30% of heavy drinkers develop increased intestinal permeability and ALD. The hypothesis of this study was that disruption of circadian rhythms is a potential risk factor in actively drinking alcoholics for gut leakiness and endotoxemia. We studied 20 subjects with alcohol use disorder (AD) and 17 healthy controls (HC, 6 day workers, 11 night workers). Subjects wore a wrist actiwatch for 7 days and underwent a 24-h dim light phase assessment and urine collection for intestinal permeability. The AD group had significantly less total sleep time and increased fragmentation of sleep (P < 0.05). AD also had significantly lower plasma melatonin levels compared with the HC [mean area under the curve (AUC) 322.78 ± 228.21 vs. 568.75 ± 304.26 pg/ml, P = 0.03]. In the AD group, AUC of melatonin was inversely correlated with small bowel and colonic intestinal permeability (lactulose-to-mannitol ratio, r = −0.39, P = 0.03; urinary sucralose, r = −0.47, P = 0.01). Cosinor analysis of lipopolysaccharide-binding protein (marker of endotoxemia) and lipopolysaccharide every 4 h for 24 h in HC and AD subjects had a midline estimating statistic of rhythm of 5,026.15 ± 409.56 vs. 6,818.02 ± 628.78 ng/ml (P < 0.01) and 0.09 ± 0.03 vs. 0.15 ± 0.19 EU/ml (P < 0.05), respectively. We found plasma melatonin was significantly lower in the AD group, and lower melatonin levels correlated with increased intestinal permeability and a marker of endotoxemia. Our study suggests the suppression of melatonin in AD may promote gut leakiness and endotoxemia.
Keywords: alcohol, lipopolysaccharide-binding protein, lipopolysaccharide
alcohol is consumed by about one-half of the U.S. population and is the most frequently abused drug in the world (31). However, the most serious complication of heavy drinking, alcoholic liver disease (ALD), remains only partially understood. The amount and duration of alcohol consumed appear to be the most important risk factors for the development of ALD. About 20–30% of individuals who consume over 30 g/day for 10 years go on to develop cirrhosis (46). However, there does not appear to be a clearly linear dose effect above this threshold, since certain groups of extremely heavy drinkers (>120 g/day) developed cirrhosis at a low rate (18.5%) (5). Therefore, epidemiological studies have shown that alcohol is a necessary cofactor to cause clinically significant ALD and cirrhosis, but other additional cofactors are required.
The most well-supported pathogenesis of ALD is that alcohol increases intestinal permeability, which increases gut-derived endotoxin, such as lipopolysaccharide (LPS), in the blood. This increase in gut-derived endotoxin initiates endotoxin-mediated hepatocellular damage and other alcohol-induced, inflammation-mediated tissue injury and organ failure. LPS causes damage by activating the innate immune system via Toll-like receptor-4, which stimulates NADPH oxidase and causes an increase in reactive oxygen species and inflammatory cytokines through NF-κB and early growth response-1-dependent pathways (49). The role of this pathway has been supported by a number of experimental findings, including: 1) eliminating bacteria in the gut prevents endotoxemia and ALD in rats (1); 2) alcohol causes hyperpermeability in rats that precedes the development of endotoxemia and ALD (19); and 3) gut leakiness is present in 80% of human alcoholics with ALD but not in alcoholics without liver injury (21, 33, 35).
Yet, not all alcoholics develop gut leakiness and endotoxemia. Identifying other risk factors for increased intestinal permeability related to heavy alcohol consumption is important to identify individuals at risk for clinically significant ALD and to better understand alcohol-related mechanisms of liver injury. The finding that clock genes are present in the epithelial cells of the intestinal tract (18, 41) makes it highly plausible that the disruption of circadian homeostasis could be a cofactor and negatively impact intestinal function, such as intestinal barrier. Indeed several inflammatory gastrointestinal and systemic disorders are more common in shift workers who have disrupted circadian rhythms, such as peptic ulcer disease (34), colon cancer (22), and irritable bowel syndrome (29). Taken together, these epidemiological and experimental findings suggest that disruption of circadian rhythms, which synchronize an organism's internal physiology to the external environment, could impact intestinal barrier function. Whether circadian desychrony is a cofactor in alcohol-induced intestinal hyperpermeability is a gap in our current knowledge.
In humans, the central circadian clock is located in the suprachiasmatic nucleus, which during the biological night triggers the pineal gland to secrete melatonin. Thus the measurement of melatonin rhythm is a commonly used method to assess central circadian timing in humans (6). A method of assessing integrity of peripheral circadian homeostasis is the measurement of core circadian genes such as CLOCK and PER genes in circulating blood monocytes or tissue clock genes in intestine or liver. Our recent work showed that alcohol increased circadian clock genes, CLOCK and PER2, in intestinal epithelial cells, CaCo-2 cells, and blocking CLOCK or PER2 with small-interfering RNA prevented alcohol-induced hyperpermeability (44). Our subsequent studies in mice have shown that circadian disruption, either environmental or genetic, increases alcohol-induced intestinal permeability and liver injury (43). Therefore in both in vitro and in vivo models, circadian homeostasis appears critical to intestinal barrier function in response to an injurious agent like alcohol. However, the relationship between alcohol-induced hyperpermeability and central circadian rhythms in humans has not been studied.
We hypothesized that the disruption of circadian rhythms in alcoholics is a cofactor that promotes gut leakiness to endotoxin. Accordingly, the goals of the current study were to: 1) determine if alcoholics have altered central circadian rhythms, as measured by plasma melatonin phase and amplitude over 24 h compared with nonalcoholic healthy controls and 2) determine if alcoholics with circadian misalignment and/or altered melatonin secretion have increased intestinal permeability and endotoxemia compared with AD without increased intestinal permeability, as assessed by correlating markers of intestinal permeability/endotoxemia and marker of circadian homeostasis. We measured intestinal permeability by 24-h urinary sugar probes (sucrose, lactulose/mannitol, and sucralose) and assessed endotoxin exposure by plasma LPS and serum lipopolysaccharide-binding protein (LBP), which is an acute-phase protein produced by the liver and binds to the endotoxin LPS.
METHODS
Participants
Participants were recruited through a combination of advertisements, posted flyers, the Rush University Medical Center gastrointestinal clinic, or self-referral. Alcohol use disorder (AD) was defined by the Lifetime Drinking History (LDH) questionnaire as previously reported (40). Controls (HC) were healthy shift workers (primarily nurses) who did not fulfill the criteria for AD per LDH questionnaire and had never been a daily drinker. The work schedule for controls was either day or night shift. We elected to study both day and night workers because it is well-established that a subset of AD have abnormal sleep patterns (8), and thus the healthy night workers represented a control group with disrupted sleep. All subjects had been on a stable work schedule for three months. All subjects completed blood tests and questionnaires at their initial visit and were excluded if they met any of the following criteria: 1) unreliable drinking history; 2) clinically detectable liver disease defined as abnormal liver function tests or any history of ascites, jaundice, or variceal bleeding; 3) renal impairment (creatinine >1.2 mg/dl); 4) AD positive for other markers of liver disease such as smooth muscle antibody, hepatitis B surface antigen, or hemochromatosis; 5) major depression (score ≥15 or any endorsement of suicidal intent on the Beck Depression Inventory) (4); 6) sleep apnea (score high risk ≥2 or more categories on the Berlin Questionnaire) (28); 7) International Restless Leg Syndrome Study Group consensus criteria for restless leg syndrome; 8) insulin-requiring diabetes and/or uncontrolled diabetes (HgbA1c >8%); 9) significant peripheral edema; 10) sepsis; 11) clinically significant cardiac failure (New York classification stage III/IV); 12) patients with low platelet counts (<80 k), uncorrectable prolonged prothrombin time (>15 s); 13) infection in the previous month, recent history of antibiotic use (within past 4 wk); 14) regular use of medications that affect intestinal permeability, intestinal motility, and/or endogenous melatonin, including metoclopramide, nonsteroidal anti-inflammatory drugs, β-blocker, psychotropic medication, hypnotics, and exogenous melatonin products during 4 wk before the study; and 15) Asians because of the possible confounding effect of a different polymorphism of enzymes involved in alcohol metabolism.
Baseline Measures
The Pittsburgh Sleep Quality Index.
The Pittsburgh Sleep Quality Index (PSQI) is a 19-item self-administered questionnaire of seven components (10). Overall scores ranged from 0 to 21 with, lower scores indicating better sleep.
Lifetime drinking history.
The LDH is a structured interview that is designed to provide quantitative indexes of an individual's alcohol consumption patterns from the onset of regular drinking. Attention is focused on quantity, frequency, variability in consumption, types of beverages, and life events that mark a change in drinking pattern. Solitary vs. social drinking and time of day when alcohol is consumed are also recorded. The interview takes ∼20–30 min to complete and has been shown to be a validated measure of alcohol consumption (23).
Sleep schedule.
After a baseline questionnaire assessment and blood tests, all subjects were asked to keep their usual sleep schedule for the week before the 24-h circadian phase assessment in the Biological Rhythms Research Laboratory. All subjects kept a sleep diary and a food diary and wore a wrist monitor (30-s epochs, Spectrum Actiwatch; Phillips) on their nondominant wrist for 7 days before the phase assessment. Actigraphy data were scored for sleep intervals, and variables of interest were calculated by the Actiware 5.70.1 program (Respironics, Bend, OR). Actigraphic-derived sleep indexes included sleep duration (or total time in bed), wake after sleep onset, total sleep time, and sleep percentage.
Melatonin assessment and analysis.
Plasma melatonin was collected hourly for 24 h between 1300 and 1200, for a total of 24 samples. Patients were kept in dim light (<5 lux, measured every 2 h with a Minolta TIL-1 light meter) and seated in a recliner chair in the Biological Rhythms Research Laboratory. After 30 min in dim light, a 3-ml blood sample was collected every 60 min. An intravenous line was placed to avoid multiple needle sticks, and the intravenous line was kept patent by a slow drip (10 ml/h) of heparinized saline, 7,500 IU/l in one-half normal saline. To prevent sample dilution, before a blood sample was collected through the plastic tubing, 2 ml of the saline solution admixed with blood were removed via a three-way stopcock system and returned to the patient after the sample was drawn. During the session, subjects were kept awake, watched a dim television, or talked to each other. After collection, the samples were centrifuged at 4°C and 1,000 revolutions/min for 15 min. The plasma was then frozen and shipped on dry ice to SolidPhase (Portland, ME) using the Bühlmann Direct Plasma Melatonin RIA kit (ALPCO Diagnostics, Windham, NH), which has an analytical sensitivity of 0.2 pg/ml. Interassay variability ranged from 7.9 to 11.7%.
The peak value or maximum point of each melatonin profile was identified. Additionally, the area under the curve (AUC) was calculated for each melatonin profile using the trapezoidal method (38). The dim light melatonin onset (DLMO) was calculated as the point in time when the melatonin concentration exceeded and remained above the threshold for 1 h. The threshold was calculated from the mean of three low consecutive daytime values plus two times the SD of these points as previously reported (48).
Intestinal permeability measurement.
Ingestion of sugar probes, or large and difficult-to-absorb sugars, is a common method to measure intestinal permeability in vivo that has been previously used in humans (16). After a 4-h fast, each subject ingested 300 ml of liquid containing 7.5 g of lactulose, 2 g of mannitol, 40 g of sucrose, and 2 g of sucralose. Before ingestion of the sugar probes, each subject was asked to empty his bladder completely. Thereafter, all urine was collected for 24 h in the first 5-h, next 7-h, and last 12-h aliquots. Subjects were not allowed to eat for 4 h after the start of the urine collection. Urine volumes were recorded, and aliquots of urine were stored at −80°C until analysis. Measurement of urinary sugars was done by gas chromatography and calculated as percent excretion of oral intake. Five-hour urinary sucrose excretion is primarily a marker of gastroduodneal permeability; 5-h urinary lactulose, mannitol, and lactulose-to-mannitol (L/M) ratio are primarily markers of small bowel permeability; and 24-h urinary sucralose and lactulose excretion are markers of total gut permeability, with sucralose primarily representing colonic permeability (2). This is because of both sucralose and lactulose being able to permeate through both the small and large intestine (colon). However, sucralose is not fermented by colonic bacteria, whereas ∼75% of lactulose and mannitol are fermented by colonic bacteria (25).
Lipopolysaccharide-binding protein.
LBP (ng/ml) was determined from blood samples collected every 4 h and was measured in serum using an ELISA kit from Cell Sciences (catalog no. HK315).
Lipopolypsaccharide measurement.
LPS (EU/ml) was determined from blood samples collected every 4 h and was measured in plasma citrate using a Kinetic Turbidmetric LAL assay, the PYROGENT-5000 from Lonza (catalog no. N383).
Statistical Analysis
Chi square tests, independent t-test, and Mann-Whitney U-test were used to compare the two subject groups. To assess the relationship between melatonin and intestinal permeability, different parameters of melatonin (AUC, DLMO) were analyzed by linear regression. The LBP and LPS levels were taken at six time points and were analyzed by cosine rhythmometric analysis (cosinor) as previously described (13, 27). To access differences in rhythmicity, the midline estimating statistic of rhythm (mesor), amplitude, and acrophase were calculated for each 24-h period. All statistical analyses were two tailed, and statistical significance was determined by using a P value of <0.05. Statistics were performed using SPSS version 19.0 or R (version 3.8.1) in the cosinor package.
RESULTS
Subjects
A total of 56 subjects were consented for the trial, and 37 participated. The enrollment and outcomes for subjects that did not participate are shown in Fig. 1. The main reason subjects did not participate after being screened was they were lost to follow up or voluntarily withdrew.
Fig. 1.

Consort flow diagram of this study. Fifty six research subjects were invited to participate in this study. Seven withdrew, 6 were lost to follow up, 1 was excluded because of failure to meet inclusion criteria (prohibited medication), 3 had medical conditions that failed to meet the inclusion criteria, and a reliable iv could not be established in 2 subjects. Thirty seven study subjects completed all study assessments. AD, alcohol use disorder; HC, healthy controls; OSA, obstructive sleep apnea.
Clinical Variables
The baseline characteristics were different between the two groups and are outlined in Table 1. AD subjects were more likely to be older, male, African American, have a higher body mass index (BMI), have less education, and could be unemployed. The AD group also reported a poorer sleep quality by PSQI compared with HC, 7.2 ± 3.8 vs. 4.6 ± 2.9 (P = 0.03). AD subjects had a higher back depression inventory (BDI) score for depression (9.5 ± 6.5 vs. 3.5 ± 4.1, P < 0.01), but it is important to note that patients with major depression defined as BDI score of >15 were excluded.
Table 1.
Subject characteristics
| AD (n = 20) |
HC (n = 17) |
P Value | |||
|---|---|---|---|---|---|
| Mean | SD | Mean | SD | ||
| Age, mean yr | 45.9 | 12.2 | 27.7 | 6.8 | <0.00 |
| Gender (male n; female n) | 15 M; 5 F | 15 F; 2 M | <0.00 | ||
| Ethnicity | 4 C; 16 AA | 15 C; 2 L | <0.00 | ||
| Education, median yr | 14.0 | 1.9 | 16.0 | 2.1 | <0.01 |
| Employment, yr | 10 U; 10 E | 15 E | <0.01 | ||
| Heavy drinking, yr | 27.5 | 11.3 | 0 | 0 | <0.00 |
| BMI | 28.9 | 5.6 | 24.5 | 5.4 | <0.02 |
| Average drinks/wk | 55.0 | 41.3 | 0.25 | 4.3 | <0.00 |
| Maximum drinks/day | 10.5 | 4.9 | 1 | 0.55 | <0.00 |
| Days drink/mo | 18.1 | 8.9 | 2 | 4.65 | <0.00 |
| Adverse life events related to alcohol; n, % | 13, 70 | 0 | 0 | <0.00 | |
| Tobacco use, n, % | 9, 45 | 2, 13 | <0.00 | ||
| Illicit drug use, n, % | 8, 40 | 0 | <0.00 | ||
| PSQI | 7.2 | 3.8 | 4.6 | 2.9 | <0.03 |
| PIDS | 7.8 | 4.9 | 5.4 | 3.3 | <0.10 |
| BDI | 9.5 | 6.5 | 3.5 | 4.1 | <0.00 |
| DLMO, h:min | 19:58 | 1:18 | 21:03 | 3:00 | <0.04 |
n, No. of subjects except for adverse life events where n is the no. of adverse events; AD, alcoholic use disorder; HC, health controls; C, Caucasian; AA, African American; L, latino; U, enemployed; E, employed; BMI,body mass index; PSQI, Pittsburgh Sleep Quality Indes; PIDS, Personal Inventory for Depression and Seasonal Affective Disorder; BDI, Back Depression Inventory; DLMO, dim light melatonin onset.
Actigraphy Data
Actigraphy-derived sleep parameter data are shown in Table 2. In AD, one subject was excluded for actiwatch failure, and three other subjects were not compliant with wearing the actiwatch for the full week. In the remaining 16 subjects with AD, sleep duration (time in bed) and total sleep time were significantly lower than HC (404.8 ± 67.3 vs. 462.5 ± 45.5.2 and 340.3 ± 60.7 vs. 409.6 ± 45.1, respectively; P < 0.01). In addition, AD subjects had more fragmented sleep (27.7 ± 9.1 vs. 16.9 ± 4.10 compared with HC, P < 0.01). In addition, there was no difference in the control group day workers and night workers, which is also shown in Table 2.
Table 2.
Actigraphy data 7 days before circadian assessment
| AD (n = 16) |
HC (n = 17) |
HC Group Day Workers (n = 6) |
HC Group Night Workers (n = 11) |
|||||||
|---|---|---|---|---|---|---|---|---|---|---|
| Mean | SD | Mean | SD | P Value | Mean | SD | Mean | SD | P Value | |
| Sleep duration, time in bed | 404.8 | 67.3 | 462.5 | 45.5 | 0.01 | 431.3 | 42.9 | 448.9 | 43.5 | 0.44 |
| Wake after sleep onset | 63.3 | 31.9 | 52.8 | 25.3 | 0.18 | 47.1 | 15.3 | 56.0 | 29.7 | 0.51 |
| Total sleep time | 340.3 | 60.7 | 409.8 | 45.1 | <0.00 | 389.3 | 45.8 | 420.9 | 42.6 | 0.78 |
| Sleep percentage | 85.1 | 6.1 | 89.1 | 5.5 | 0.03 | 89.8 | 6.1 | 88.6 | 6.1 | 0.67 |
| Fragmentation | 27.7 | 9.1 | 16.9 | 4.1 | <0.00 | 17.7 | 3.2 | 17.0 | 4.3 | 0.97 |
Units are minutes.
n, No. of subjects.
Intestinal Permeability Data between Groups
There was no difference in intestinal permeability from day workers or night workers by 5-h sucrose, 5-h L/M ratio, or 24-h sucralose with P values of 0.21, 0.37, and 0.18, respectively. Figure 2 shows the difference in gastroduodenal (A), small bowel (B), and whole gut/colonic permeability (C) between the AD and HC group with 0.45 ± 0.29 vs. 0.46 ± 0.23 (P = 0.53), 0.05 ± 0.06 vs. 0.13 ± 0.18 (P = 0.01), and 0.84 ± 0.48 vs. 1.41 ± 1.43 (P = 0.08) for 5-h sucrose, 5-h L/M ratio, and 24-h sucralose, respectively, with all values as percent excretion of oral dose. The range for the 5-h sucrose, 5-h L/M ratio, and 24-h sucralose was 0.78, 0.65, and 6.08, respectively. There was not a statistical difference between either 24-h urinary lactulose or the second 12-h urinary sucralose excretion at 5.40 ± 6.55 vs. 6.24 ± 5.57 (P = 0.11) and 0.12 ± 0.22 vs. 0.20 ± 0.18 (P = 0.09), respectively. It is important to note that our AD group excluded subjects with liver disease, so not all the subjects would be expected to have increased intestinal permeability even with heavy alcohol consumption.
Fig. 2.
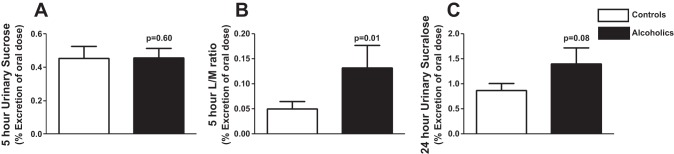
Intestinal permeability in the control and alcohol use disorder (AD) groups. AD subjects and healthy controls were assessed for intestinal permeability using an oral sugar solution containing sucrose, lactulose, mannitol, and sucralose and gas chromatography (GC) analysis of 5- and 24-h urine samples as described in materials and methods. A and C: 5-h urinary sucrose (A) and 24-h urinary sucralose (C) (makers of gastroduodenal and colonic permeability, respectively) were not significantly different in AD subjects compared with controls. B: 5-h urinary lactulose-to-mannitol (L/M) ratio (markers of small intestinal permeability) was significantly higher in AD patients compared with controls. Data are presented as mean %urinary excretion of the oral dose ± SE. Statistical significance, P < 0.05.
Comparison of Melatonin Profiles between Groups
The mean DLMO for the AD group was significantly earlier than the HC group (19 h and 58 min ± 1 h and 18 min vs. 21 h and 3 min ± 3 h, P = 0.04). This difference was found, however, mainly between the AD group and the night workers, with a later DLMO in the night workers group. The night workers had a mean DLMO of 21 h and 29 min ± 3 h and 25 min and the day workers were 20 h and 38 min ± 1 h and 52 min. The DLMO was not statistically different (P = 0.30) between the AD group and the HC day workers, whereas it was when compared with the night shift workers (P = 0.03). The AUC of the plasma melatonin profiles in the AD and HC groups are shown in Fig. 3. There was significantly lower plasma melatonin AUC in AD subjects compared with HC, 322.78 ± 228.21 vs. 568.75 ± 304.26 pg·ml−1·h−1 (P = 0.03). The mean AUC for day subjects was 401.38 ± 100.27 pg·ml−1·h−1 and for night workers was 661.13 ± 342.17 pg·ml−1·h−1, which was not statistically different (P = 0.13). One AD subject's data were excluded, since he/she lost the intravenous line, and it could not be successfully replaced. Similarly, there was a significant decrease in median peak melatonin amplitude in AD subjects compared with HC (41.41 ± 30.09 vs. 70.81 ± 41.41 pg/ml, P = 0.04). The AUC of melatonin in the control group did not significantly correlate with age (r = 0.10, P = 0.20), but the AUC of melatonin in the AD group was significantly correlated with age (r = 0.64, P = 0.01).
Fig. 3.
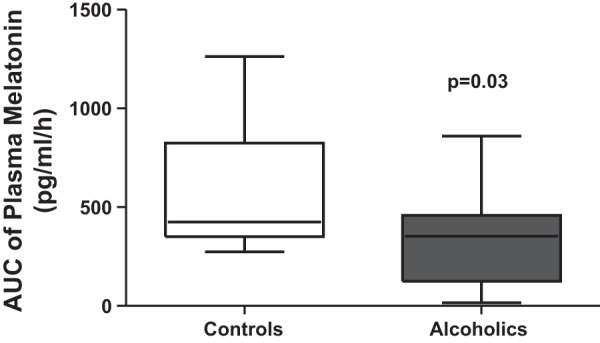
Comparison of area under the curve (AUC) of melatonin in controls and alcoholics. Blood was drawn every hour under dim light (<5 lux), and plasma melatonin was measured by RIA as described in materials and methods. Melatonin AUC was calculated by the trapezoidal method. Plasma melatonin AUC was significantly low in AD subjects vs. healthy controls. Data are presented as a boxplot of AUC in pg·ml−1·h−1.
Correlation between Intestinal Permeability and Melatonin
Figure 4 shows a linear regression analysis of AUC of plasma melatonin compared with 5-h urinary L/M ratio (A) and 24-h urinary sucralose (B). There was a statistically significant negative correlation of both small bowel and whole gut/colonic permeability at r = −0.39, P = 0.03 and r = −0.47, P = 0.01, respectively. This analysis excluded eight subjects (3 in the AD group and 1 in the control groups who were extremely leaky with >2 × SD of mean sugar probe excretion, 3 in the control group with melatonin AUC >2 × SD of mean, and 1 subject who lost his/her intravenous line). Of the subjects with markedly increased permeability, two had a BMI of 40, and one was a polysubstance abuser.
Fig. 4.

Intestinal permeability correlates with plasma melatonin AUC and lipopolysaccharide-binding protein (LBP). Plasma melatonin AUC measured in dim light by RIA and intestinal permeability as measured using an oral sugar solution containing sucrose, lactulose, mannitol, and sucralose after 24 h by GC analysis were performed as described in materials and methods. A and B: comparison by linear regression showed a significant negative correlation between melatonin AUC in 5-h urinary L/M ratio (small bowel) (A) and 24-h urinary sucralose (colonic) (B) intestinal permeability. C: serum levels of LBP, an indirect measure of systemic endotoxin exposure, positively correlated with urinary sucralose (colonic) permeability. All analysis was done by linear regression. A log transformation of the L/M ratio was done because of a positive skew of the data. Analysis excluded subjects with values >2 SD, which included 8 subjects (7 with elevated intestinal permeability and 1 with elevated melatonin AUC); 1 subject was excluded because of the loss of the iv line.
Correlation between Actigraphy and Intestinal Permeability or Melatonin
There was no correlation by linear regression between whole gut permeability or 24-h urinary sucralose and actigraphy measures (sleep duration, sleep fragmentation, and sleep percentage) with a P = 0.76, 0.27, and 0.56, respectively. Similarly, there was no correlation found between small bowel permeability or L/M ratio and actigraphy markers (sleep duration, sleep fragmentation, or sleep percentage) with a P value of 0.62, 0.21, and 0.78, respectively. Melatonin AUC also did not show a correlation between sleep duration (P = 0.44), fragmentation (P = 0.60), or sleep percentage (P = 0.37).
Correlation between Intestinal Permeability and Markers of endotoxemia (Lipopolysaccharide-Binding Protein and Lipopolysaccharide)
To determine whether there is any relationship between changes in intestinal permeability and endotoxemia, we performed a correlation analysis. By linear regression, the mean LBP levels did correlate with urinary sucralose in the AD group (r = 0.50, P = 0.01), as seen in Fig. 4C, but LBP did not correlate with urinary L/M ratio (P = 0.63). This is not surprising, since bacteria levels are higher in the colon than small bowel, so the colon should be a greater source of endotoxemia. Mean LPS levels did not correlate with intestinal permeability by 24-h sucralose (P = 0.20) or L/M ratio (P = 0.58). The LBP and LPS levels at six different time points were measured in 19 of 20 AD subjects and 14 of 17 HC subjects. There was no significant difference between mean LBP levels or LPS levels in the AD and HC group, at 5,026.15 ± 2,979.01 and 6,818.02 ± 4,402.26 ng/ml (P = 0.20) for LBP and 0.10 ± 0.10 and 0.11 ± .15 EU/ml for LPS. However, linear statistical analysis is not appropriate to analyze readouts with circadian oscillation, and a cosinor analysis can test the rhythm of biological measures over a period of time (in this case 24 h). The mesor, amplitude, and acrophase (duration of one cycle) were calculated from a cosinor regression model. The results of the cosinor model are shown in Fig. 5. For LBP, in the AD and HC group the mesor, amplitude, and acrophase of the model was 6,818.02 ± 628.78 vs. 5,026.15 ± 409.56 (P < 0.01), 549.12 ± 579.02 vs. 485.23 ± 674.75 (P = 0.47), and 0.35 ± 1.06 vs. 1.05 ± 1.39 (P = 0.44), respectively. For LPS, in the AD and HC group, the mesor, amplitude, and acrophase of the model was 0.15 ± 0.19 vs. 0.09 ± 0.03 (P < 0.05), 0.01 ± 0.03 vs. 0.02 ± 0.03 (P = 0.68), and −0.75 ± 1.88 (P = 0.75), respectively. The mesor, or Midline Estimating Statistic of Rhythm, which is an estimate of central distribution or mean of an oscillating variable, was the only value that was significantly different between the two groups.
Fig. 5.

Vector angle of LBP in controls compared with alcoholics. Serum levels of LBP, an indirect measure of systemic endotoxin exposure (A), and plasma levels of LPS (B) were determined for AD subjects and healthy controls every 4 h over 24 h in dim light (<5 lux) at 1600, 2000, 2400, 0400, 0800, and 1200, respectively, by ELISA or Turbidmetric LAL assay as described in materials and methods. For each subject, the 6 values were analyzed with a cosinor model that fits a single cosine wave function to the data with a period of 24 h. From this model, the midline estimating statistic of rhythm (mesor), amplitude, and acrophase were calculated. The fitted values are plotted. The P value for the mesor, which represents the mean distribution of the model, is shown between the two groups (AD and HC).
DISCUSSION
The hypothesis of the current study was that AD would have altered central circadian rhythms as measured by 24-h plasma melatonin profile and that circadian disruption is a key cofactor in alcohol-induced intestinal permeability. Markers of intestinal permeability, L/M ratio (small bowel) and sucralose (whole gut/colonic), are known to be increased in AD (20), but, if our hypothesis is correct, subjects with abnormal melatonin profiles would be more likely to develop gut leakiness. Indeed, we found the AUC of plasma melatonin was significantly lower in the AD group and that there was an inverse correlation between AUC and both small bowel and colonic intestinal permeability. In addition, a marker of endotoxemia, LBP, correlated with colonic permeability, possibly reflecting the impact of systemic inflammation from gut leakiness. These data suggest melatonin may be an effective marker to help determine which AD subjects have disrupted circadian homeostasis and are at risk for intestinal hyperpermeability, endotoxemia, liver disease, and perhaps other alcohol-associated, inflammatory-mediated tissue injury. To our knowledge, this is the first study to report this finding.
For our control group, we chose day workers and also night workers as a control group with sleep disruption, since actively drinking AD are known to have disrupted sleep (7, 8, 17). Despite including night shift workers, the AD group still had significantly more disrupted sleep than the control group by wrist actigraphy as assessed by sleep fragmentation, sleep duration, and sleep percentage. Our control group therefore still had less disordered sleep that our AD group. We did find a difference in DLMO between the AD and HC participants; however, this finding was present only when compared with night shift workers in the HC group, which would be expected. There was no statistically significant difference between the DLMO of day workers and the AD group. The finding that the AD group did not have a significant difference in DLMO compared with controls is consistent with another previous large human study (12). Our finding that AD had lower plasma melatonin secretion measured by AUC or peak melatonin is novel.
Low melatonin may indicate disrupted circadian homeostasis, and low secretion of melatonin has also been associated with diabetes (24), obesity (45), Parkinson's disease (47), and aging (32). Melatonin is a powerful antioxidant and is known in multiple animal models to be protective of colitis and intestinal hyperpermeability (26, 30), including ethanol-induced intestinal hyperpermeability (42). Our finding is also supported by our animal data that alcohol-fed rodents that have circadian alteration induced either environmentally (light/dark phase shift) or by genetic manipulation (clock mutant) have increased alcohol-induced hyperpermeability and liver pathology (43).
There are a number of important limitations to the present study. Our AD group had more men, more African American subjects, and was older compared with the HC group. The impact of age and gender on melatonin levels is controversial. Salivary melatonin was not found to decrease with age or gender in one large healthy control cohort (9), but other groups have reported that melatonin levels decreased with age in middle-aged subjects (51). In another study comparing young subjects with subjects over age 65, salivary melatonin was found to be decreased by 37 ± 12.5% in men but was not significantly lowered in women (50). The age difference in our study was under 20 years, and we included no subjects over the age of 65. In addition, shift work could also affect melatonin, but the years of shift work were not associated with melatonin levels in the Nurse Health Study (39). It is therefore unlikely that our findings of differences in plasma melatonin AUC can be explained by differences in age, gender, or shift work between AD and HC groups, but this study is unable to definitely answer that question, which is a limitation. Finally, it is important to note that cirrhotic AD were excluded from the present study. This was because of changes in melatonin amplitude or phase that can occur with end-organ damage like cirrhosis, which has been demonstrated previously in hepatic encephalopathy (11) but limit the ability of this study to make any definitive conclusions about subjects with ALD.
There are other data to support alcohol decreasing melatonin. In two studies, acute alcohol intake at night was associated with reducing melatonin levels in salivary melatonin (15) or plasma melatonin (37) but was not associated with a change in the timing or phase of melatonin as measured by DLMO. An additional study that evaluated two doses of acute alcohol consumption found a dose effect for alcohol to inhibit melatonin (35, 36). In studies with AD subjects, there were higher levels of melatonin during active drinking compared with levels during abstinence (17). The largest age- and gender-matched study comparing subjects with AD and healthy controls found DLMO mildly delayed (40 min) by one but not by the other method of DLMO calculation (12). The key difference between the current study and the study by Conroy et al. (12) was our study was assessing active drinkers, whereas Conroy et al. studied subjects that were sober or in a recovery program for 3–13 wk. Although our AD subjects were actively drinking, they were all breathalyzed on arrival and were negative for alcohol, so this appears to be a carryover effect of recent alcohol consumption. Another key difference between the present study and previous data on melatonin and alcohol was we used plasma melatonin and not salivary melatonin, since levels of melatonin are 10-fold higher in the plasma compared with saliva (14).
In our study, we examined the endotoxin, LPS, and a marker of endotoxemia, LBP. LBP has been previously reported to be elevated in AD particularly during (19) and elevated in cirrhotic patients with increased permeability and bacterial translocation (37). In our study, we did not find significantly elevated LBP levels or LPS levels in our AD group compared with controls. However, when examining the timing of six different measurements of LBP and LPS levels by a cosinor analysis (Fig. 5), we found a significantly different mesor between the two groups correlating with higher levels of LBP and LPS in the AD group during the day. This is interesting because the robust circadian rhythm of the immune system (41) resulting in relatively elevated levels of LPS would normally be anticipated to be at night. The AD group had their highest levels of LBP and LPS during the day, which may further indicate a disruption of circadian homeostasis in the peripheral organs like the intestine. The alteration in LBP and LPS we observed in the AD group could be from a change in the rate of endotoxin leak from the intestine, alteration in liver production of LBP, or decreased clearance. Further mechanistic studies are needed to examine these possibilities and to correlate whether our finding may be from loss of circadian homeostasis, alterations in melatonin, or sleep disruption.
In summary, the main finding of this study was low melatonin secretion correlates with alcohol-induced intestinal hyperpermeability. This novel finding could potentially help to identify alcoholics at risk for intestinal leakiness, endotoxemia, ALD, or other inflammation-mediated, alcohol-induced tissue injury and organ failure. If confirmed, it could offer risk stratification for clinicians accessing individuals with heavy drinking and proposes possible chronotherapeutics for future investigations such as melatonin supplementation in alcoholics at risk for ALD. Melatonin could be a marker of disrupted central circadian homeostasis or could be acting locally as an antioxidant in the gastrointestinal tract, where levels are known to be 50-fold higher than in plasma. It is not well understood how plasma levels of melatonin correlate with levels in the gastrointestinal tract, since studies comparing plasma and gastrointestinal levels of melatonin have not been done. Further studies are needed to assess this question and whether decreased plasma melatonin AUC correlates with alterations in peripheral circadian rhythms that could lead to altered metabolism, tight junction protein function, increased intestinal permeability, and inflammation.
GRANTS
This work was supported by National Institute on Alcohol Abuse and Alcoholism Grant AA-019966-K to G. R. Swanson.
DISCLOSURES
No conflicts of interest, financial or otherwise, are declared by the authors.
AUTHOR CONTRIBUTIONS
Author contributions: G.R.S., A.G., C.B.F., H.J.B., and A.K. conception and design of research; G.R.S., A.G., M.S., and H.J.B. performed experiments; G.R.S., A.G., M.S., V.D., L.F., H.J.B., and A.K. analyzed data; G.R.S., A.G., and L.F. interpreted results of experiments; G.R.S. prepared figures; G.R.S., A.G., H.J.B., and A.K. drafted manuscript; G.R.S., H.J.B., and A.K. edited and revised manuscript; G.R.S., H.J.B., and A.K. approved final version of manuscript.
REFERENCES
- 1.Adachi Y, Moore LE, Bradford BU, Gao W, Thurman RG. Antibiotics prevent liver injury in rats following long-term exposure to ethanol. Gastroenterology 108: 1: 218–224, 1995. [DOI] [PubMed] [Google Scholar]
- 2.Arrieta MC. Alterations in intestinal permeability. Gut 55: 10: 1512–1520, 2006. [DOI] [PMC free article] [PubMed] [Google Scholar]
- 3.Batschelet E. Circular Statistics in Biology. London, UK: Academic, 1981, p. 371. [Google Scholar]
- 4.Beck AT, Ward CH, Mendelson M, Mock J, Erbaugh J. An inventory for measuring depression. Arch Gen Psychiatry 4: 561–571, 1961. [DOI] [PubMed] [Google Scholar]
- 5.Bellentani S, Saccoccio G, Costa G, Tiribelli C, Manenti F, Sodde M, Saveria Croce L, Sasso F, Pozzato G, Cristianini G, Brandi G. Drinking habits as cofactors of risk for alcohol induced liver damage. The Dionysos Study Group. Gut 41: 845–850, 1997. [DOI] [PMC free article] [PubMed] [Google Scholar]
- 6.Benloucif S, Burgess HJ, Klerman EB, Lewy AJ, Middleton B, Murphy PJ, Parry BL, Revell VL. Measuring melatonin in humans. J Clin Sleep Med 4: 66–69, 2008. [PMC free article] [PubMed] [Google Scholar]
- 7.Brower KJ. Insomnia, alcoholism and relapse. Sleep Med Rev 7: 523–539, 2003. [DOI] [PubMed] [Google Scholar]
- 8.Brower KJ. Alcohol's effects on sleep in alcoholics. Alcohol Res Health 25: 110–125, 2001. [PMC free article] [PubMed] [Google Scholar]
- 9.Burgess HJ, Fogg LF. Individual differences in the amount and timing of salivary melatonin secretion. PLoS One 3: e3055, 2008. [DOI] [PMC free article] [PubMed] [Google Scholar]
- 10.Buysse DJ, Reynolds CF 3rd Monk TH, Berman SR, Kupfer DJ. The Pittsburgh Sleep Quality Index: a new instrument for psychiatric practice and research. Psychiatry Res 28: 193–213, 1989. [DOI] [PubMed] [Google Scholar]
- 11.Chojnacki C, Wachowska-Kelly P, Blasiak J, Reiter RJ, Chojnacki J. Melatonin secretion and metabolism in patients with hepatic encephalopathy. J Gastroenterol Hepatol 28: 342–347, 2013. [DOI] [PubMed] [Google Scholar]
- 12.Conroy DA, Hairston IS, Arnedt JT, Hoffmann RF, Armitage R, Brower KJ. Dim light melatonin onset in alcohol-dependent men and women compared with healthy controls. Chronobiol Int 29: 35–42, 2012. [DOI] [PMC free article] [PubMed] [Google Scholar]
- 13.Cornelissen G. Cosinor-based rhythmometry. Theor Biol Med Model 11: 4682–46916, 2014. [DOI] [PMC free article] [PubMed] [Google Scholar]
- 14.Davis FC, Menaker M. Development of the mouse circadian pacemaker: independence from environmental cycles. J Comp Physiol 143: 527–539, 1981. [DOI] [PMC free article] [PubMed] [Google Scholar]
- 15.Ekman AC, Leppaluoto J, Huttunen P, Aranko K, Vakkuri O. Ethanol inhibits melatonin secretion in healthy volunteers in a dose-dependent randomized double blind cross-over study. J Clin Endocrinol Metab 77: 780–783, 1993. [DOI] [PubMed] [Google Scholar]
- 16.Farhadi A, Keshavarzian A, Kwasny MJ, Shaikh M, Fogg L, Lau C, Fields JZ, Forsyth CB. Effects of aspirin on gastroduodenal permeability in alcoholics and controls. Alcohol 44: 447–456, 2010. [DOI] [PMC free article] [PubMed] [Google Scholar]
- 17.Foster JH, Peters TJ. Impaired sleep in alcohol misusers and dependent alcoholics and the impact upon outcome. Alcohol Clin Exp Res 23: 1044–1051, 1999. [PubMed] [Google Scholar]
- 18.Hoogerwerf WA, Hellmich HL, Cornelissen G, Halberg F, Shahinian VB, Bostwick J, Savidge TC, Cassone VM. Clock gene expression in the murine gastrointestinal tract: endogenous rhythmicity and effects of a feeding regimen. Gastroenterology 133: 1250–1260, 2007. [DOI] [PubMed] [Google Scholar]
- 19.Keshavarzian A, Farhadi A, Forsyth CB, Rangan J, Jakate S, Shaikh M, Banan A, Fields JZ. Evidence that chronic alcohol exposure promotes intestinal oxidative stress, intestinal hyperpermeability and endotoxemia prior to development of alcoholic steatohepatitis in rats. J Hepatol 50: 538–547, 2009. [DOI] [PMC free article] [PubMed] [Google Scholar]
- 20.Keshavarzian A, Fields JZ, Vaeth J, Holmes EW. The differing effects of acute and chronic alcohol on gastric and intestinal permeability. Am J Gastroenterol 89: 2205–2211, 1994. [PubMed] [Google Scholar]
- 21.Keshavarzian A, Holmes EW, Patel M, Iber F, Fields JZ, Pethkar S. Leaky gut in alcoholic cirrhosis: a possible mechanism for alcohol-induced liver damage. Am J Gastroenterol 94: 200–207, 1999. [DOI] [PubMed] [Google Scholar]
- 22.Kolstad HA. Nightshift work and risk of breast cancer and other cancers–a critical review of the epidemiologic evidence Scand. J Work Environ Health 34: 5–22, 2008. [DOI] [PubMed] [Google Scholar]
- 23.Lemmens PH. Measuring lifetime drinking histories. Alcohol Clin Exp Res 22, Suppl 2: 29S–36S, 1998. [DOI] [PubMed] [Google Scholar]
- 24.McMullan CJ, Schernhammer ES, Rimm EB, Hu FB, Forman JP. Melatonin secretion and the incidence of type 2 diabetes. J Am Med Assoc 309: 1388–1396, 2013. [DOI] [PMC free article] [PubMed] [Google Scholar]
- 25.Meddings JB, Gibbons I. Discrimination of site-specific alterations in gastrointestinal permeability in the rat. Gastroenterology 114: 83–92, 1998. [DOI] [PubMed] [Google Scholar]
- 26.Necefli A, Tulumoglu B, Giris M, Barbaros U, Gunduz M, Olgac V, Guloglu R, Toker G. The effect of melatonin on TNBS-induced colitis. Dig Dis Sci 51: 1538–1545, 2006. [DOI] [PubMed] [Google Scholar]
- 27.Nelson W, Tong YL, Lee JK, Halberg F. Methods for cosinor-rhythmometry. Chronobiologia 6: 305–323, 1979. [PubMed] [Google Scholar]
- 28.Netzer NC, Stoohs RA, Netzer CM, Clark K, Strohl KP. Using the Berlin Questionnaire to identify patients at risk for the sleep apnea syndrome. Ann Intern Med 131: 485–491, 1999. [DOI] [PubMed] [Google Scholar]
- 29.Nojkov B, Rubenstein JH, Chey WD, Hoogerwerf WA. The impact of rotating shift work on the prevalence of irritable bowel syndrome in nurses. Am J Gastroenterol 105: 842–847, 2010. [DOI] [PMC free article] [PubMed] [Google Scholar]
- 30.Nosal'ova V, Zeman M, Cerna S, Navarova J, Zakalova M. Protective effect of melatonin in acetic acid induced colitis in rats. J Pineal Res 42: 364–370, 2007. [DOI] [PubMed] [Google Scholar]
- 31.O'Connor PG, Schottenfeld RS. Patients with alcohol problems. N Engl J Med 338: 592–602, 1998. [DOI] [PubMed] [Google Scholar]
- 32.Pandi-Perumal SR, Zisapel N, Srinivasan V, Cardinali DP. Melatonin and sleep in aging population. Exp Gerontol 40: 911–925, 2005. [DOI] [PubMed] [Google Scholar]
- 33.Parlesak A, Schafer C, Schutz T, Bode JC, Bode C. Increased intestinal permeability to macromolecules and endotoxemia in patients with chronic alcohol abuse in different stages of alcohol-induced liver disease. J Hepatol 32: 742–747, 2000. [DOI] [PubMed] [Google Scholar]
- 34.Pietroiusti A, Forlini A, Magrini A, Galante A, Coppeta L, Gemma G, Romeo E, Bergamaschi A. Shift work increases the frequency of duodenal ulcer in H pylori infected workers Occup. Environ Med 63: 773–775, 2006. [DOI] [PMC free article] [PubMed] [Google Scholar]
- 35.Rao RK, Seth A, Sheth P. Recent advances in alcoholic liver disease. I. Role of intestinal permeability and endotoxemia in alcoholic liver disease. Am J Physiol Gastrointest Liver Physiol 286: G881–G884, 2004. [DOI] [PubMed] [Google Scholar]
- 36.Rojdmark S, Wikner J, Adner N, Andersson DE, Wetterberg L. Inhibition of melatonin secretion by ethanol in man. Metabolism 42: 1047–1051, 1993. [DOI] [PubMed] [Google Scholar]
- 37.Rupp TL, Acebo C, Carskadon MA. Evening alcohol suppresses salivary melatonin in young adults. Chronobiol Int 24: 463–470, 2007. [DOI] [PubMed] [Google Scholar]
- 38.Salas S, Hille E, eds. Calculus: One and Several Variables with Analytic Geometry. New York, NY: Wiley, 1982. [Google Scholar]
- 39.Schernhammer ES, Rosner B, Willett WC, Laden F, Colditz GA, Hankinson SE. Epidemiology of urinary melatonin in women and its relation to other hormones and night work. Cancer Epidemiol Biomarkers Prev 13: 936–943, 2004. [PubMed] [Google Scholar]
- 40.Skinner HA, Sheu WJ. Reliability of alcohol use indices. The Lifetime Drinking History and the MAST. J Stud Alcohol 43: 1157–1170, 1982. [DOI] [PubMed] [Google Scholar]
- 41.Sladek M, Rybova M, Jindrakova Z, Zemanova Z, Polidarova L, Mrnka L, O'Neill J, Pacha J, Sumova A. Insight into the circadian clock within rat colonic epithelial cells. Gastroenterology 133: 1240–1249, 2007. [DOI] [PubMed] [Google Scholar]
- 42.Sommansson A, Yamskova O, Schioth HB, Nylander O, Sjoblom M. Long-term oral melatonin administration reduces ethanol-induced increases in duodenal mucosal permeability and motility in rats. Acta Physiol(Oxf) 212: 152–165, 2014. [DOI] [PubMed] [Google Scholar]
- 43.Summa KC, Voigt RM, Forsyth CB, Shaikh M, Cavanaugh K, Tang Y, Vitaterna MH, Song S, Turek FW, Keshavarzian A. Disruption of the circadian clock in mice increases intestinal permeability and promotes alcohol-induced hepatic pathology and inflammation. PLoS One 8: e67102, 2013. [DOI] [PMC free article] [PubMed] [Google Scholar]
- 44.Swanson G, Forsyth CB, Tang Y, Shaikh M, Zhang L, Turek FW, Keshavarzian A. Role of intestinal circadian genes in alcohol-induced gut leakiness. Alcohol Clin Exp Res 35: 1305–1314, 2011. [DOI] [PMC free article] [PubMed] [Google Scholar]
- 45.Tan DX, Manchester LC, Fuentes-Broto L, Paredes SD, Reiter RJ. Significance and application of melatonin in the regulation of brown adipose tissue metabolism: relation to human obesity. Obes Rev 12: 167–188, 2011. [DOI] [PubMed] [Google Scholar]
- 46.Teli MR, Day CP, Burt AD, Bennett MK, James OF. Determinants of progression to cirrhosis or fibrosis in pure alcoholic fatty liver. Lancet 346: 987–990, 1995. [DOI] [PubMed] [Google Scholar]
- 47.Videnovic A, Noble C, Reid KJ, Peng J, Turek FW, Marconi A, Rademaker AW, Simuni T, Zadikoff C, Zee PC. Circadian melatonin rhythm and excessive daytime sleepiness in Parkinson disease. JAMA Neurol 71: 463–469, 2014. [DOI] [PMC free article] [PubMed] [Google Scholar]
- 48.Voultsios A, Kennaway DJ, Dawson D. Salivary melatonin as a circadian phase marker: validation and comparison to plasma melatonin. J Biol Rhythms 12: 457–466, 1997. [DOI] [PubMed] [Google Scholar]
- 49.Wheeler MD, Kono H, Yin M, Nakagami M, Uesugi T, Arteel GE, Gabele E, Rusyn I, Yamashina S, Froh M, Adachi Y, Iimuro Y, Bradford BU, Smutney OM, Connor HD, Mason RP, Goyert SM, Peters JM, Gonzalez FJ, Samulski RJ, Thurman RG. The role of Kupffer cell oxidant production in early ethanol-induced liver disease. Free Radic Biol Med 31: 1544–1549, 2001. [DOI] [PubMed] [Google Scholar]
- 50.Zeitzer JM, Duffy JF, Lockley SW, Dijk DJ, Czeisler CA. Plasma melatonin rhythms in young and older humans during sleep, sleep deprivation, and wake. Sleep 30: 1437–1443, 2007. [DOI] [PMC free article] [PubMed] [Google Scholar]
- 51.Zhou JN, Liu RY, van Heerikhuize J, Hofman MA, Swaab DF. Alterations in the circadian rhythm of salivary melatonin begin during middle-age. J Pineal Res 34: 11–16, 2003. [DOI] [PubMed] [Google Scholar]