

Abstract
We investigated the role of exercise intensity and associated central motor drive in determining corticomotoneuronal excitability. Ten participants performed a series of nonfatiguing (3 s) isometric single-leg knee extensions (ISO; 10–100% of maximal voluntary contractions, MVC) and cycling bouts (30–160% peak aerobic capacity, Wpeak). At various exercise intensities, electrical potentials were evoked in the vastus lateralis (VL) and rectus femoris (RF) via transcranial magnetic stimulation (motor-evoked potentials, MEP), and electrical stimulation of both the cervicomedullary junction (cervicomedullary evoked potentials, CMEP) and the femoral nerve (maximal M-waves, Mmax). Whereas Mmax remained unchanged in both muscles (P > 0.40), voluntary electromyographic activity (EMG) increased in an exercise intensity-dependent manner for ISO and cycling exercise in VL and RF (both P < 0.001). During ISO exercise, MEPs and CMEPs progressively increased in VL and RF until a plateau was reached at ∼75% MVC; further increases in contraction intensity did not cause additional changes (P > 0.35). During cycling exercise, VL-MEPs and CMEPs progressively increased by ∼65% until a plateau was reached at Wpeak. In contrast, RF MEPs and CMEPs progressively increased by ∼110% throughout the tested cycling intensities without the occurrence of a plateau. Furthermore, alterations in EMG below the plateau influenced corticomotoneuronal excitability similarly between exercise modalities. In both exercise modalities, the MEP-to-CMEP ratio did not change with exercise intensity (P > 0.22). In conclusion, increases in exercise intensity and EMG facilitates the corticomotoneuronal pathway similarly in isometric knee extension and locomotor exercise until a plateau occurs at a submaximal exercise intensity. This facilitation appears to be primarily mediated by increases in excitability of the motoneuron pool.
Keywords: transcranial stimulation, cervicomedullary stimulation, spinal motoneurons, motor cortex
the corticospinal tract and spinal motoneurons constitute the major descending pathway involved in voluntary motor control in humans (8, 9). The influence of neural drive from the central nervous system (i.e., central motor drive) on the excitability of these components has been described for isometric contractions of the upper and, to a lesser extent, the lower limb (19, 34). A growing number of investigations are now focusing on the corticospinal and motoneuronal (i.e., corticomotoneuronal) excitability of the quadriceps during rhythmic locomotor exercise (29, 30). While the motor pathway of the lower limb has been examined during constant-load cycling (29, 30), the relationship between corticomotoneuronal excitability and alterations in central motor drive during locomotor exercise remains unknown. Increases in central motor drive during locomotor exercise can be, for example, secondary to increases in workload or the development of peripheral fatigue.
Transcranial magnetic stimulation (TMS) is a noninvasive method utilized to investigate overall alterations in the excitability of the motor pathway from the brain to the contracting muscle (5). Changes in the magnitude of TMS-evoked, short-latency electromyographic (EMG) responses, termed motor-evoked potentials (MEP), can be monitored in a target muscle and reflect activity-induced alterations in the excitability of corticomotoneuronal projections (11, 26). Although alterations in MEP size provide information about the net excitability of the corticomotoneuronal pathway, it is not possible to discriminate between changes occurring at the level of the motor cortex and spinal motoneurons. To decipher these effects, cervicomedullary stimulation [CMS, producing a cervicomedullary evoked potential (CMEP)] of corticospinal axons can be employed to reveal alterations in the excitability of spinal motoneurons and, by extension, motor cortical output cells (33, 35).
The excitability of the human motor pathway increases with augmented central motor drive and/or contraction strength (38), a facilitation that is attributed to the increased excitability of both the motor cortex and spinal motoneurons (12, 23, 36). While there are limitations associated with its use (15), EMG activity of the working muscle is commonly utilized as an indicator of central motor drive during both single-joint (6) and cycling exercise (18). In this context, it is interesting to note that the EMG-force relationship between single-joint isometric and multi-joint leg press exercise is, despite the difference in exercise modality, similar at a knee angle of 90° (1).
Evidence from isometrically contracting upper limb muscles demonstrates that the overall excitability of the corticomotoneuronal tract (i.e., MEP), and specifically that of the spinal motoneurons (i.e., CMEP), do not increase continuously, but rather peak around 50–75% of maximal voluntary contraction (MVC) strength. This peak is then followed by a progressive decline with further increases in central motor drive (20, 37). In isometrically contracting lower limb muscles, MEPs and CMEPs progressively grow with increasing torque up to 50% MVC and, with further increases in contraction strength, remain unchanged in plantar flexors (25), but fall in the quadriceps (16, 28). It is important to consider that these findings in the lower limbs are based on the debatable use of magnetic CMS (25) [e.g., limited stimulator power (35)], relatively high stimulator output intensities (16, 28), and electrical stimulation of corticospinal axons at the thoracic level, but only up to 50% MVC (19).
The relationship between central motor drive and corticomotoneuronal excitability during locomotor exercise is of particular importance because increases in drive, as observed during fatiguing constant-load cycling (2), could potentially alter MEPs and CMEPs independent of any fatigue-related influences. Specifically, if lower limb corticomotoneuronal excitability during locomotor exercise is sensitive to increases in central motor drive similar to that seen in isometrically contracting upper limb (20) or quadriceps (16, 28) muscle, increases beyond 50–75% of maximal cycling capacity could, per se, have a compromising effect on corticomotoneuronal excitability, independent of any fatigue-related effect. Consequently, it is important to understand the potential impact central motor drive may have on cortical and spinal excitability during locomotor exercise. Hence, we sought to describe the influence of exercise intensity on corticomotoneuronal excitability during both isometric knee-extensor contractions and locomotor exercise. Additionally, to investigate potential differences across exercise modalities, we examined the effect of a given change in exercise intensity and associated change in central motor drive on corticomotoneuronal excitability during both isometric and locomotor exercise.
METHODS
Participants
Ten healthy, regularly active male participants (27 ± 1 yrs old) participated in this study. Written, informed consent was obtained from all participants before their inclusion in this study. The Institutional Review Boards of the University of Utah and the Salt Lake City Veterans Affairs Medical Center approved all protocols.
Protocol
Participants reported to the laboratory on three occasions, separated by at least 24 h. The first visit included familiarization with various techniques and an incremental cycle ergometer test (described in Locomotor exercise). During the following two visits, participants performed either the isometric or the locomotor protocol in randomized order. As an estimate of fatigue induced by each of these protocols, we compared the average of three MVCs (duration ∼3 s, 30 s rest between) performed before exercise with the average of three MVC performed 30 s after the exercise. Additionally, we compared the influence of changes in EMG (estimate of central motor drive) on changes in corticomotoneuronal excitability between exercise modalities. For that purpose, two levels of similar EMG obtained during each protocol (one higher than the other) were identified. Therefore, the percent change in cortical and spinal motoneuronal excitability can be compared for a given relative increase in EMG between modalities.
Isometric contractions.
Participants were seated upright in a custom-built chair with their hip and knee flexion at about 120° and 90°, respectively, and arms crossed over the chest. Isometric knee extensor force was measured using a calibrated linear strain gauge (MLP 300; Transducer Techniques, Temecula, CA) attached to a noncompliant cuff 2–3 cm superior to the right lateral malleolus. Cuff position was marked on the ankle to ensure consistent placement within a session. Nine sets of brief (∼3 s) randomized contractions at 10, 25, 50, 75, and 100% of MVC of the knee extensors were performed, with each contraction separated 30 s and each set by 2 min. Real-time torque feedback was provided for the participant to match a given exercise intensity. TMS, CMS, or peripheral nerve stimulation (PNS) was given at random and balanced for each contraction strength. A total of 3 PNS, 3 TMS, and 3 CMS were obtained and averaged at each contraction intensity.
Locomotor exercise.
All participants performed an incremental exercise test on a cycling ergometer (Velotron, Elite model, Racer Mate, Seattle, WA) [starting at 20 W and adding 25 W/min; (3)] on the first visit to determine their volitional maximum aerobic workload (Wpeak; group mean ± SE: 312 ± 9 W). In a subsequent visit, participants performed brief (45 s) constant-load bouts on a cycle ergometer at a cadence of 80 rpm. The cycling bouts consisted of varying intensities [100 W (32 ± 2% of Wpeak), 200 W (65 ± 2% of Wpeak), 300 W (97 ± 3% of Wpeak), and 400 W (161 ± 4% of Wpeak)], with 3 min rest in between. Each workload was performed twice (resulting in a total of eight, randomized 45-s exercise bouts). To determine intensity-dependent changes in corticomotoneuronal excitability during cycling, participants received a stimulation set during each workload consisting of three TMS, one CMS, and one PNS. The order of stimulation type was randomized and separated by at least eight pedal revolutions, resulting in 24 TMS, 8 CMS, and 8 PNS stimulations. Crank angle was monitored continuously and all stimulations were elicited at 45° clockwise relative to top dead center (equals a knee angle of ∼100°) to evoke a response during the peak cycling EMG burst of the vastus lateralis (30). Additionally, participants breathed from a rigid fixed mouthpiece to minimize head movement during cycling.
Instrumentation
Electromyography.
EMG signals were recorded by surface electrodes (Ag-AgCl, 10-mm diameter, 5-cm interelectrode distance) placed on the muscle belly of the rectus femoris (RF), vastus lateralis (VL), and biceps femoris (BF) in a bipolar configuration. Before electrode placement, the skin was lightly abraded with fine sandpaper and cleaned with an alcohol swab. EMG signals were amplified (1,000 times; Neurolog Systems, Digitimer, Welwyn Garden City, Hertfordshire, UK), band-pass filtered (50-2,000 Hz; NL-844, Digitimer), and analog to digitally converted at a sampling rate of 2,000 Hz using a 16-bit Micro 1401 mk-II and Spike 2 data collection software (Cambridge Electronic Design, Cambridgeshire, UK) running custom-written scripts.
Peripheral nerve stimulation.
For both protocols, PNS was performed with the anode placed between the greater trochanter and the iliac crest, and the cathode was placed over the femoral nerve in the femoral triangle. Optimal position of the stimulating electrode over the femoral nerve was determined by delivering low-intensity single pulse stimuli (200 μs pulse width; 100–150 mA) via a movable cathode probe and a constant voltage stimulator (model DS7AH, Digitimer). The optimal position of the stimulating cathode was defined as the location that was associated with the greatest torque output in response to the low-intensity stimulation. Once located, the cathode electrode was fixed and remained in this position until all measurements were completed. Thereafter, stimulation intensity was increased by 20-mA increments until the size of the compound muscle action potential (M-wave) demonstrated no further increase (i.e., maximal M-wave, Mmax) at rest and during 50% MVC. Stimulation intensity was set at 130% of Mmax intensity (group mean intensity ± SE: isometric protocol 303 ± 12 mA, locomotor protocol 326 ± 24 mA) and kept constant throughout the testing session. Validity of the Mmax intensity and cathode location was confirmed during warm-up cycling to ensure maximal activation in the locomotor protocol.
Cervicomedullary stimulation.
The corticospinal tract was electrically activated (100 μs pulse width, D-185 mark IIa, Digitimer) at the cervicomedullary junction to evoke CMEPs. Self-adhesive electrodes were placed in the grooves behind the mastoid processes with the cathode placed on the left side to stimulate the contralateral leg (38). To allow for potential changes in excitability during the isometric contraction protocol, the stimulation intensity was set to achieve a CMEP size corresponding to ∼50% Mmax (450 ± 17 V) in the VL during a 50% quadriceps MVC. For dynamic cycling, simulator intensity (326 ± 24 V) was set to achieve a CMEP of approximately 50% Mmax in the VL during cycling at 100 W. This intensity was chosen to provide room for growth or decline in motoneuronal responses during cycling. All participants tolerated these stimulation procedures.
Transcranial magnetic stimulation.
Stimulation was delivered over the vertex of the motor cortex (left hemisphere, approximately 2–3 cm lateral of the vertex) using a concave double-cone coil (Magstim 200; Magstim, Whitland, UK) to elicit a MEP in the quadriceps. Optimal positioning of the TMS coil was determined during a 20% MVC before the experimental exercise and marked on the scalp for accurate placement throughout the study.
ISOMETRIC CONTRACTION PROTOCOL.
The stimulator intensity (38 ± 2% of maximum stimulator output) was set to evoke a MEP of similar size to CMEP in the VL during a 50% quadriceps contraction (∼50% Mmax).
LOCOMOTOR EXERCISE PROTOCOL.
Stimulator intensity (42 ± 3% of maximum stimulator output) was set to evoke a MEP of similar size to CMEP (∼50% Mmax) in the VL during cycling at 100 W.
Data Analysis
All data were stored and analyzed offline using Spike 2 data collection software. The averaged peak-to-peak amplitude and area of evoked responses (e.g., MEP, CMEP, and Mmax) were measured. As the results for both area and peak-to-peak amplitude of MEP, CMEP, and Mmax were similar (for details see Tables 1 and 2), the presentation of the results are limited to area as previously reported (21). To account for changes within the muscle during exercise, MEPs and CMEPs were normalized to the nearest Mmax. To isolate alterations in the excitability of the motor cortex we normalized the MEP to CMEP. During isometric exercise, voluntary EMG was rectified and averaged for 100 ms before the point of stimulation. During dynamic cycling, before any stimulations, 10 s of rectified EMG waveforms were overlaid and then averaged around the same centering point (i.e., 45°) used for eliciting stimulations. The average EMG 50 ms and 25 ms before and after the centering point was measured. All data are reported as means ± SE.
Table 1.
Raw and normalized Mmax, MEPs, and CMEPs obtained during various isometric contraction strengths of the knee extensors
| Contraction Strength, % Maximum Torque |
||||||||
|---|---|---|---|---|---|---|---|---|
| 10 | 25 | 50 | 75 | 100 | P value | F ratio | Effect Size η2 | |
| Vasutus Lateralis | ||||||||
| Mmax | ||||||||
| Peak-to-peak, mV | 5.2 ± 0.6 | 5.1 ± 0.6 | 5.1 ± 0.6 | 4.9 ± 0.6 | 5.0 ± 0.6 | 0.764 | 0.46 | 0.00 |
| Area, μV·ms | 43.9 ± 6.7 | 40.6 ± 5.7 | 37.0 ± 5.4 | 35.3 ± 4.9 | 36.6 ± 4.7 | 0.129 | 1.92 | 0.03 |
| MEP | ||||||||
| Peak-to-peak, mV | 0.3 ± 0.1 | 1.4 ± 0.5 | 2.6 ± 0.4 | 3.0 ± 0.5 | 2.7 ± 0.4 | <0.001 | 16.000 | 0.41 |
| Area, μV·ms | 2.7 ± 0.9 | 13.8 ± 4.5 | 24.6 ± 3.8 | 29.4 ± 5.2 | 28.4 ± 5.1 | <0.001 | 14.53 | 0.40 |
| %Mmax Peak-to-peak | 5.4 ± 1.8 | 25.0 ± 6.2 | 45.8 ± 4.5 | 59.2 ± 4.9 | 55.0 ± 6.2 | <0.001 | 26.92 | 0.64 |
| %Mmax Area | 7.8 ± 3.0 | 34.2 ± 7.2 | 69.5 ± 7.9 | 84.1 ± 7.8 | 77.0 ± 9.0 | <0.001 | 20.12 | 0.60 |
| %CMEP Peak-to-peak | 71.9 ± 20.8 | 70.3 ± 8.3 | 106.1 ± 12.9 | 92.0 ± 4.5 | 84.4 ± 8.9 | 0.122 | 1.96 | 0.13 |
| %CMEP Area | 77.5 ± 24.3 | 91.2 ± 10.6 | 105.6 ± 10.3 | 105.8 ± 6.7 | 99.8 ± 13.0 | 0.441 | 0.96 | 0.08 |
| CMEP | ||||||||
| Peak-to-peak, mV | 0.6 ± 0.2 | 2.0 ± 0.5 | 2.7 ± 0.6 | 3.2 ± 0.5 | 3.3 ± 0.5 | <0.001 | 29.57 | 0.32 |
| Area, μV·ms | 5.6 ± 2.6 | 16.5 ± 4.6 | 23.6 ± 5.3 | 29.2 ± 6.3 | 30.7 ± 5.8 | <0.001 | 23.21 | 0.30 |
| %Mmax peak-to-peak | 11.7 ± 3.2 | 35.8 ± 5.6 | 51.9 ± 6.0 | 63.9 ± 4.2 | 65.4 ± 3.4 | <0.001 | 74.13 | 0.69 |
| %Mmax Area | 11.3 ± 3.9 | 39.3 ± 6.2 | 65.9 ± 9.8 | 80.2 ± 6.6 | 79.7 ± 6.1 | <0.001 | 43.19 | 0.64 |
| Rectus Femoris | ||||||||
| Mmax | ||||||||
| Peak-to-peak, mV | 5.0 ± 0.4 | 4.9 ± 0.4 | 4.7 ± 0.4 | 4.7 ± 0.4 | 4.8 ± 0.4 | 0.13 | 1.94 | 0.06 |
| Area, μV·ms | 43.2 ± 5.4 | 43.8 ± 5.6 | 39.5 ± 4.7 | 35.1 ± 4.7 | 36.9 ± 4.8 | 0.47 | 0.91 | 0.01 |
| MEP | ||||||||
| Area, μV·ms | 2.5 ± 1.3 | 18.1 ± 6.3 | 26.5 ± 5.4 | 28.7 ± 6.1 | 28.6 ± 7.0 | <0.001 | 10.30 | 0.26 |
| %Mmax peak-to-peak | 4.3 ± 2.0 | 25.3 ± 3.8 | 48.2 ± 5.4 | 60.5 ± 7.0 | 57.1 ± 6.7 | <0.001 | 40.75 | 0.65 |
| %Mmax Area | 5.5 ± 2.4 | 27.8 ± 3.5 | 59.3 ± 3.8 | 74.7 ± 6.9 | 61.8 ± 8.7 | <0.001 | 29.47 | 0.70 |
| %CMEP peak-to-peak | 97.3 ± 17.9 | 103.0 ± 14.7 | 102.1 ± 5.9 | 96.4 ± 8.1 | 92.6 ± 6.9 | 0.87 | 0.31 | 0.02 |
| %CMEP Area | 96.7 ± 21.2 | 100.4 ± 13.4 | 111.0 ± 6.2 | 97.0 ± 6.7 | 95.5 ± 9.1 | 0.83 | 0.369 | 0.03 |
| CMEP | ||||||||
| Peak-to-peak, mV | 0.4 ± 0.1 | 1.4 ± 0.3 | 2.4 ± 0.4 | 3.0 ± 0.4 | 3.0 ± 0.4 | <0.001 | 39.11 | 0.49 |
| Area, μV·ms | 4.4 ± 1.6 | 14.4 ± 3.4 | 22.8 ± 4.6 | 27.2 ± 4.5 | 29.2 ± 5.2 | <0.001 | 20.64 | 0.36 |
| %Mmax peak-to-peak | 8.8 ± 2.4 | 27.8 ± 3.6 | 48.6 ± 5.6 | 62.4 ± 4.2 | 62.1 ± 5.7 | <0.001 | 51.87 | 0.72 |
| %Mmax Area | 10.3 ± 3.7 | 30.8 ± 3.6 | 54.9 ± 6.1 | 76.2 ± 3.3 | 67.4 ± 7.6 | <0.001 | 40.57 | 0.71 |
Data are reported as means ± SE.
Mmax, maximal M-waves; MEPs, motor-evoked potentials; CMEPs, cervicomedullary evoked potentials.
P values and F ratios are depicted for the repeated measures ANOVA main effect.
Table 2.
Raw and normalized Mmax, MEPs, and CMEPs obtained during various cycling workloads
| Cycling Workload |
|||||||
|---|---|---|---|---|---|---|---|
| 100 W | 200 W | 300 W | 400 W | P value | F ratio | Effect Size η2 | |
| Vasutus Lateralis | |||||||
| Mmax | |||||||
| Peak-to-peak, mV | 5.2 ± 0.4 | 5.1 ± 0.4 | 5.0 ± 0.3 | 5.2 ± 0.4 | 0.54 | 0.74 | 0.00 |
| Area, μV·ms | 43.0 ± 4.2 | 41.4 ± 4.8 | 39.6 ± 4.2 | 41.1 ± 5.2 | 0.56 | 0.70 | 0.00 |
| MEP | |||||||
| Peak-to-peak, mV | 2.7 ± 0.3 | 3.2 ± 0.4 | 3.5 ± 0.4 | 3.7 ± 0.4 | <0.001 | 9.90 | 0.10 |
| Area, μV·ms | 25.4 ± 3.9 | 32.4 ± 4.9 | 38.4 ± 5.9 | 38.6 ± 5.7 | <0.001 | 9.78 | 0.10 |
| %Mmax Peak-to-peak | 52.9 ± 6.3 | 63.7 ± 5.8 | 69.9 ± 6.4 | 71.4 ± 5.9 | <0.001 | 12.78 | 0.14 |
| %Mmax Area | 58.7 ± 6.2 | 77.3 ± 6.6 | 95.0 ± 9.8 | 94.6 ± 10.6 | <0.001 | 15.01 | 0.18 |
| %CMEP Peak-to-peak | 85.9 ± 7.9 | 82.8 ± 5.7 | 91.5 ± 8.0 | 85.7 ± 5.6 | 0.85 | 0.27 | 0.01 |
| %CMEP Area | 102.1 ± 9.4 | 100.4 ± 8.1 | 104.1 ± 9.3 | 98.6 ± 7.7 | 0.76 | 0.4 | 0.01 |
| CMEP | |||||||
| Peak-to-peak, mV | 3.0 ± 0.4 | 3.7 ± 0.4 | 4.2 ± 0.4 | 4.3 ± 0.4 | <0.001 | 14.12 | 0.14 |
| Area, μV·ms | 25.2 ± 4.2 | 31.3 ± 4.0 | 36.9 ± 4.5 | 38.9 ± 4.5 | <0.001 | 13.20 | 0.13 |
| %Mmax Peak-to-peak | 58.9 ± 7.2 | 74.5 ± 6.0 | 83.6 ± 5.0 | 83.2 ± 4.4 | <0.001 | 13.69 | 0.24 |
| %Mmax Area | 58.9 ± 6.3 | 75.9 ± 4.9 | 93.6 ± 6.7 | 96.0 ± 6.4 | <0.001 | 21.01 | 0.30 |
| Rectus Femoris | |||||||
| Mmax | |||||||
| Peak-to-peak, mV | 5.4 ± 0.3 | 5.4 ± 0.2 | 5.4 ± 0.3 | 5.7 ± 0.3 | 0.54 | 0.74 | 0.01 |
| Area, μV·ms | 50.0 ± 7.4 | 48.8 ± 6.9 | 48.0 ± 6.9 | 49.4 ± 5.8 | 0.69 | 0.48 | 0.00 |
| MEP | |||||||
| Peak-to-peak, mV | 2.0 ± 0.3 | 3.1 ± 0.5 | 3.6 ± 0.5 | 4.2 ± 0.5 | <0.001 | 27.03 | 0.22 |
| Area, μV·ms | 20.8 ± 3.9 | 31.7 ± 5.9 | 37.7 ± 6.9 | 44.1 ± 6.8 | <0.001 | 17.49 | 0.16 |
| %Mmax Peak-to-peak | 36.2 ± 5.4 | 55.7 ± 8.5 | 64.8 ± 9.1 | 71.2 ± 7.2 | <0.001 | 23.19 | 0.23 |
| %Mmax Area | 41.1 ± 6.4 | 61.2 ± 8.5 | 71.8 ± 7.7 | 84.3 ± 7.5 | <0.001 | 20.16 | 0.27 |
| %CMEP Peak-to-peak | 93.2 ± 15.5 | 87.0 ± 9.3 | 110.3 ± 30.3 | 82.5 ± 75.1 | 0.57 | 0.69 | 0.04 |
| %CMEP Area | 110.0 ± 20.0 | 103.4 ± 10.3 | 116.7 ± 22.6 | 94.6 ± 7.5 | 0.72 | 0.45 | 0.02 |
| CMEP | |||||||
| Peak-to-peak, mV | 2.4 ± 0.4 | 3.4 ± 0.5 | 3.9 ± 0.6 | 4.9 ± 0.4 | <0.001 | 14.03 | 0.27 |
| Area, μV·ms | 23.0 ± 5.6 | 30.6 ± 5.6 | 37.3 ± 7.8 | 44.2 ± 5.7 | <0.001 | 14.23 | 0.12 |
| %Mmax Peak-to-peak | 44.9 ± 7.2 | 62.3 ± 7.4 | 71.9 ± 10.7 | 85.3 ± 4.3 | <0.001 | 11.89 | 0.29 |
| %Mmax Area | 42.5 ± 6.6 | 58.5 ± 5.7 | 71.2 ± 9.4 | 88.7 ± 4.8 | <0.001 | 21.39 | 0.34 |
Data are reported as means ± SE. P values and F ratios are depicted for the repeated measures ANOVA main effect.
Statistical analysis.
A one-way ANOVA with repeated measures on the factor contraction strength was computed to determine whether there was a significant main effect for EMG, Mmax, MEP, CMEP, and MEP-to-CMEP ratio in both protocols. If a main effect was identified, a Holms-Bonferroni post hoc test was performed to determine where the differences occurred. To confirm our EMG measurements during cycling exercise, a 2 × 4 repeated measures ANOVA was performed on EMG averages (50 ms and 25 ms before and after the centering point) and workload. Additionally, a Student's t-test was performed on the pre-post-MVCs and the percent change in corticomotoneuronal responses (MEP and CMEP normalized to Mmax, MEP normalized to CMEP) associated with a given percent change in EMG across exercise modalities. The percent change in corticomotoneuronal responses was chosen for this analysis in an attempt to diminish the confounding influences associated with the comparison of absolute EMG across different days. Statistical significance was set at P ≤ 0.05.
RESULTS
None of the two protocols resulted in a pre- to postexercise decrease in MVC, i.e., no exercise-induced fatigue was associated with either task. Specifically, pre- versus postexercise MVC during the isometric protocol was 194 ± 17 vs. 193 ± 16 Nm, P = 0.55 and pre- vs. postexercise MVC during the dynamic protocol was 201 ± 12 vs. 193 ± 13 Nm, P = 0.26.
Isometric Contractions
There was a main effect of contraction strength for EMG in the VL (P < 0.001) and RF (P < 0.001) (Figs. 1 and 2, Table 1). For all tested contraction strengths (25–100% MVC), EMG was greater than that at the prior contraction strength (P < 0.001). Mmax area was unchanged in both muscles across all contraction strengths (VL: 38.7 ± 1.6 μV·ms, P = 0.29; RF: 39.7 ± 1.7 μV·ms; P = 0.56). There was a main effect of contraction strength in the VL and RF (P < 0.001) for MEP and CMEP. Post hoc analysis revealed that the MEP area increased in the VL and RF from 10 to 25% MVC, from 25 to 50% MVC, and from 50 to 75% MVC (P < 0.01). There were no differences in MEP area between 75 and 100% MVC in the VL (P = 0.35) or RF (P = 0.42). The area of CMEP in RF followed the same pattern and significantly increased from 10 to 25% MVC, 25 to 50% MVC, and from 50 to 75% MVC (P < 0.01). No increase was evident from 75 to 100% MVC in the VL (P = 0.77) or RF (P = 0.61). There was no difference between the area of MEP and CMEP at any contraction strength across muscles (VL: P = 0.89, RF: P = 0.60). Consequently, MEP normalized to CMEP remained unchanged across contraction strengths in the VL (P = 0.22) and RF (P = 0.43).
Fig. 1.

Representative raw corticomotoneuronal [maximal M-waves (Mmax), motor-evoked potentials (MEP), and cervicomedullary evoked potentials (CMEP)] traces obtained during each isometric contraction strength and cycling workload. Note, Mmax remains unchanged across exercise intensities in both protocols. MEPs and CMEPs increase from the lower (10% MVC and 100 W) to submaximal (75% MVC and 300 W) exercise intensities, with no further changes thereafter.
Fig. 2.

Electromyographic (EMG)activity and corticomotoneuronal-evoked responses of the vastus lateralis and rectus femoris during isometric knee extensor contractions. EMG grew progressively with increases in contraction strength (A and B). Evoked responses (MEP and CMEP) peaked at 75% maximal voluntary contractions (MVC) followed by no further increases (C and D). No changes were present in the MEP-to-CMEP ratio (E and F). Data are means ± SE. *Significantly different from preceding data point (P < 0.05).
Locomotor Exercise
EMG activity increased with each increment in cycling workload in the VL (P < 0.001) (Figs. 1 and 3, Table 2). There was no interaction effect of the method of EMG averaging (50 or 25 ms before and after the point of stimulation) and workload (P = 0.59), consequently the 50 ms before and after the point of stimulation will be reported. Mmax remained unaltered throughout the series of short bouts of dynamic cycling (41.3 ± 0.7 μV·ms; P = 0.40). There was a main effect of cycling workload for MEP and CMEP (P < 0.001). MEP increased from 30 to 65% Wpeak (100 to 200 W; P < 0.01) and from 65 to 100% Wpeak (200 W to 300 W; P < 0.01). There was no increase in MEP from 100% Wpeak to 160% Wpeak (300 W to 400 W; P = 0.95). Likewise, CMEP increased from 30 to 65% Wpeak (100 to 200 W; P < 0.01) and from 65 to 100% Wpeak (200 to 300 W; P < 0.01), with no further changes from 100 to 160% Wpeak (300 W to 400 W; P = 0.51). Similar to the isometric protocol, there was no effect of stimulation type between MEP and CMEP (P = 0.86); and MEP/CMEP did not change across workloads (P = 0.80).
Fig. 3.

EMG activity and CMEP of the vastus lateralis and rectus femoris during cycling exercise. Background EMG grew progressively with increases in workload (A and B). Evoked responses (MEP and CMEP) peaked at 300 W in the vastus lateralis (C) but not in the rectus femoris (D). No changes were present in the MEP-to-CMEP ratio (E, F). Data are means ± SE. *Significantly different from preceding data point (P < 0.05).
EMG in the RF was augmented at each cycling workload (P < 0.001) with no changes in Mmax (49.1 ± 0.4 μV·ms; P = 0.68). There was no interaction effect of the method of EMG averaging (50 or 25 ms before and after the point of stimulation) and workload (P = 0.11), consequently the 50 ms before and after the point of stimulation will be reported. In contrast to the VL, MEP and CMEP increased across all cycling workloads in the RF (P < 0.001) with no evidence of a plateau and no main effect of stimulation type MEP and CMEP (P = 0.96). Specifically, MEP increased from 30 to 65% Wpeak (100 to 200 W; P < 0.01), from 65 to 100% Wpeak (200 W to 300 W; P < 0.05), and from 100 to 160% Wpeak (300 W to 400 W; P = 0.05). CMEP also significantly increased from 30 to 65% Wpeak (100 to 200 W), from 65 to 100% Wpeak (200 W to 300 W), and from 100 to 160% Wpeak (300 W to 400 W; P <0.01). There was no main effect of contraction strength for the MEP-to-CMEP ratio (P = 0.67).
Comparisons Across Exercise Modality
We compared the effect of a given change in EMG on MEP and CMEP between exercise modalities (Fig. 4). For the VL, similar EMG values were found during cycling at 100 W and isometric contraction at 50% MVC (0.160 ± 0.02 mV and 0.168 ± 0.02 mV, P = 0.85) and during cycling at 200 W and isometric contraction at 75% MVC (0.220 ± 0.02 mV and 0.226 ± 0.02 mV, P = 0.91). As Mmax was similar between protocols for VL (P = 0.86) and RF (P = 0.31), normalizing EMG to Mmax did not alter the outcome. The approximate 40% increase in voluntary VL-EMG during cycling (i.e., from 100–200 W) and during isometric (i.e., from 50–75% MVC) exercise was associated with a ∼33% increase in MEPs and a ∼42% increase in CMEP in both exercise modalities; these increases were similar (P > 0.60) in both exercise modalities (Fig. 4A).
Fig. 4.
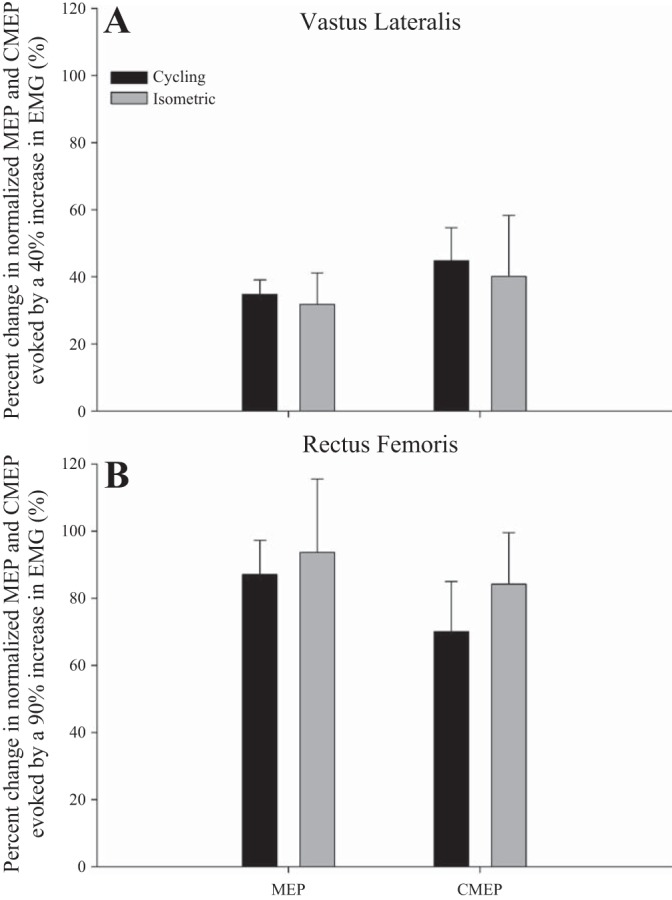
Changes in corticomotoneuronal (area of MEP normalized to Mmax) and α-motoneuronal (CMEP normalized to Mmax) excitability of the vastus lateralis (A) and rectus femoris (B) in response to a given increase in voluntary EMG during cycling and isometric knee extensor exercise. There are no significant differences between exercise modalities.
For the RF, similar EMG values were found during cycling at 100 W and isometric contraction at 25% MVC (0.095 ± 0.01 mV and 0.098 ± 0.02 mV, P = 0.91) and during cycling at 300 W and isometric contraction at 50% MVC (0.186 ± 0.02 mV and 0.182 ± 0.03 mV, P = 0.88). The ∼90% increase in voluntary RF-EMG during cycling (i.e., from 100–300 W) and during isometric (i.e., from 25–50% MVC) was associated with a 90% increase in MEPs and 77% increase in CMEPs; these increases were similar (P > 0.30) between exercise modalities (Fig. 4B).
DISCUSSION
The relationship between central motor drive and the excitability of the motor cortex and spinal motoneurons is an important consideration for the interpretation of the net response of the motor pathway to exercise in which central motor drive changes dynamically. This study examined the influence of central motor drive on the excitability of cortical output cells and spinal motoneurons projecting to the quadriceps during two different exercise modalities; namely, isometric knee extension and cycling exercise. As reflected in the exercise intensity-response curves of both exercise modalities, MEPs and CMEPs progressively increase with greater central motor drive up to a peak, beyond which further increases do not cause additional changes in corticomotoneuronal excitability. Interestingly, during locomotor exercise, the RF appears to be different in that the excitability of cortical and motoneuronal projections continually increase over the tested workloads. In both modalities and for both VL and RF, the modulation of MEPs and CMEPs is similar across various intensities, which may suggest that the observed effects could largely be accounted for by spinal mechanisms. Relative to the task-specific maximal capacity, the onset of the plateau in VL corticomotoneuronal excitability is different between the two exercise modalities, with a starting point around 75% MVC during the isometric contraction and approximately 100% Wpeak during locomotor exercise.
Isometric Exercise
Although intensity-dependent changes in corticomotoneuronal excitability during isometric exercise have been established for the upper extremities (20, 34, 37), this phenomenon is less investigated in the lower limbs. In the present study, MEP and CMEP progressively increased from 10 to 75% MVC in the VL and RF. This finding coincides, at least in part, with Martin et al. (19) who reported a linear increase in thoracic-evoked motor potentials from rest to ∼50% MVC in the RF, tibialis anterior, and soleus. Unfortunately, higher contraction intensities were not studied, thus a plateau in excitability was not observed.
After 75% MVC, further increases in contraction strength did not result in additional changes in corticomotoneuronal excitability in the present study (Fig. 2). The observation of a plateau starting at this fairly high contraction strength confirms earlier findings in the plantar flexors (25) and is likely a consequence of a decreased motoneuronal response to central motor drive. Specifically, with greater contraction strengths, motoneurons exhibit an increase in firing rate that can alter the trajectory of the afterhyperpolarization period (i.e., longer hyperpolarization period), resulting in a blunted response to a given stimulus (20, 22, 37). However, the plateau in corticomotoneuronal excitability observed in the present study contrasts with the previously documented reduction in MEPs at intensities above 50% of quadriceps MVC (16, 28). One potential explanation for this discrepancy is the difference in TMS stimulation intensity. In the current study, the TMS intensity (∼37% of stimulator output) was determined by matching MEP amplitude to CMEP amplitude, whereas in the previous studies (16, 28), TMS intensity was set to achieve the highest possible MEP at 50% MVC (requiring a stimulator output of 50–70%). Although the use of a low versus a high stimulation intensity might account for part of the different findings, it might not fully explain the discrepancy because a decline in MEPs and CMEPs above 75% contraction strength has also been observed in elbow flexors while using a low stimulator intensity (25–55% of maximal stimulator output) (20). This might suggest that the effect of stimulator intensity on corticomotoneuronal excitability may be muscle specific.
Finally, it has been documented that voluntary muscle contractions can facilitate resting corticomotoneuronal excitability for 10–15 s after exercise with the magnitude of potentiation being independent of the preceding contraction intensity (24, 27). Although hypothetical, a potentiation effect from one muscle contraction to the next could have facilitated the corticomotoneuronal excitability during the subsequent contraction. However, given the 20-s rest between and the randomization of contractions in the present study, a significant effect is rather unlikely.
Locomotor Exercise
This study is the first to investigate the influence of cycling workload/intensity and associated central motor drive on motor cortical and spinal motoneuronal responses. Similar to isometric exercise of the same muscle group, increases in workload during aerobic cycling resulted in increases in corticomotoneuronal excitability until a plateau was reached in the VL. Specifically, MEP and CMEP in the VL progressively increased by ∼63% from the lowest workload to the occurrence of the plateau at Wpeak. Further increases in workload and voluntary EMG did not cause additional changes in MEP and CMEP size. The unchanged MEP-to-CMEP ratio across all intensities (Fig. 3) suggests that the corticomotoneuronal facilitation observed with increasing central motor drive could have mainly been driven by a spinal component. However, although the MEP-to-CMEP ratio is often utilized to provide some information regarding the site where alterations of corticomotoneuronal excitability may occur, a distinct conclusion cannot be drawn. Specifically, the similar increase in both MEPs and CMEPs (i.e., unchanged MEP-to-CMEP ratio) might not share a common mechanism because MEPs can be modulated at spinal and/or cortical levels, whereas CMEPs are only modulated at a spinal level. Moreover, MEPs and CMEPs may be influenced by entirely different spinal circuits (10). Thus the facilitation of both MEPs and CMEPs may be mediated by independent factors challenging the validity of the MEP-to-CMEP ratio as an indicator of the site of alteration in the corticomotoneuronal excitability.
In contrast to the VL, MEPs and CMEPs obtained from the RF increased progressively over each workload with no indication of a plateau (Fig. 3). The difference in the modulation of VL compared with the RF corticomotoneuronal excitability may be secondary to an alteration in muscle recruitment pattern associated with increases in cycling intensity/workload (13, 14). Indeed, voluntary VL-EMG increased by ∼95% from 30 to 160% Wpeak, whereas voluntary RF-EMG increased by ∼150% across the same range. The greater increase in voluntary RF-EMG confirms earlier findings documenting a 10-fold increase in RF-EMG versus only a fivefold increase in the VL-EMG when cycling exercise intensity is increased from 150 W to maximal sprinting power (∼1,400 W) (13). Taken together, these observations suggest that the relative contribution of, and the central motor drive to, the RF may increase more than that of the VL across the workloads evaluated in the present study. The increase in RF-EMG and the associated additional recruitment of RF motor units may have been sufficient to cause a net increase, rather than a plateau, in corticomotoneuronal excitability across the tested workloads. In addition, some of the difference between RF and VL may be explained by the fact that VL has a monoarticular function (knee extension) versus the biarticular nature of the RF (hip flexion and knee extension).
The onset of a plateau during cycling exercise demonstrates that further increases in central motor drive above that observed around Wpeak will have no further impact on corticomotoneuronal excitability. Based on this observation, the extent to which central motor drive increases during aerobic cycling can influence the interpretation of exercise-induced net changes in corticomotoneuronal excitability. Specifically, the inhibitory effect of locomotor muscle fatigue on corticomotoneuronal excitability (31) can, at least up to a certain point, be masked by the facilitating effect of an increase in central motor drive. Thus during strenuous constant-load aerobic leg exercise characterized by the development of peripheral fatigue and associated progressive increases in central motor drive (4), the net corticomotoneuronal excitability depends on the balance between the facilitating effects of an increase in central motor drive and the potentially inhibitory effects of fatigue (31).
Comparisons Between Exercise-Modalities
To compare the effect of a similar given change in EMG on MEP and CMEP between exercise modalities, we identified two levels of comparable EMG below the occurrence of the plateau. This approach allowed us to evaluate the effect of a 40% increase in VL-EMG (and a 90% increase in RF-EMG) on MEP and CMEP during cycling versus during isometric knee extension exercise. These comparisons revealed that a given increase in voluntary EMG below the plateau evokes similar changes in the excitability of the corticospinal tract and spinal motoneurons during cycling and isometric knee extension exercise (Fig. 4). This might suggest that alterations in the corticomotoneuronal excitability of a given muscle are largely independent of the actual contractile modality (at least before the onset of a plateau) and strongly dependent on central motor drive. In this context, it is important to consider that the exercise protocols were performed on separate days. While the position of the EMG electrodes were marked with indelible ink, even small differences in electrode placement could have influenced the measures.
Another important consideration when making comparisons between single-joint isometric and cycling exercise is the way in which the movement is generated. Specifically, isometric contractions are primarily driven through conscious activation of the descending corticomotoneuronal pathway, whereas rhythmic movements can additionally be modified at the level of the spinal cord via spinal central pattern generating networks (17, 39). These spinal circuits produce a phasic coordination of muscle activity through afferent sensory reflexes, potentially resulting in a heightened role of subcortical regions in generating motor drive during rhythmic exercise compared with isometric contractions (10). Therefore, while the EMG was matched between the two exercise modalities, the cycling exercise might have, in contrast to the isometric task, also encompassed some central pattern generating component and therefore influenced descending motor commands.
It should also be mentioned that significant alterations in joint angle can affect spinal excitability via differences in neural feedback sensitive to muscle length (40). However, given the small differences in knee angle and muscle length at the point of stimulation during the isometric and dynamic task (∼90° vs. ∼100°, respectively), we expect, if at all present, the associated different effects on motoneuronal excitability to be small (7, 10, 30).
Based on the previous observation that voluntary VL EMG during cycling at peak aerobic capacity is only about 50% of that observed during brief maximal sprints (32), it may be inferred that the plateau during cycling in the present study occurred at ∼50% of the maximal sprint-specific capacity. Such an assumption would indicate that, when expressed in relation to the quadriceps maximum task-specific EMG activity, the pattern of change in corticomotoneuronal excitability is different between isometric knee extension and cycling exercise. Specifically, while the onset of the plateau in VL occurs at 75% of the task-specific maximum during isometric knee extension exercise, the above consideration would suggest the onset of the plateau during cycling exercise to occur at 50% of task-specific maximum (i.e., maximal sprint). Based on this, it might be concluded that motor drive-dependent changes in corticomotoneuronal excitability, particularly the occurrence/existence of the peak/plateau, may be different between exercise modalities. Methodological difficulties associated with the use of TMS during maximal sprints (e.g., substantial head and upper body movements) prevented us from evaluating corticomotoneuronal excitability during these efforts.
Perspectives and Significance
The present study demonstrates that the excitability of cortical and spinal motoneuronal projections to the knee extensors during both isometric single-leg knee extension and cycling exercise is augmented by increases in central motor drive. This facilitation, which is likely mediated by increases in the excitability of the motoneuron pool, appears to be independent of contractile modality (i.e. static vs. dynamic exercise). The present results warrant careful consideration for the interpretation of corticomotoneuronal excitability during exercise in which central motor drive is changing, e.g., constant load exercise to task failure.
GRANTS
The study was supported by the National Heart, Lung, and Blood Institute (HL-103786, HL-116579, and HL-091830) and a Veterans Affairs Merit Grant (E6910R).
DISCLOSURES
No conflicts of interest, financial or otherwise, are declared by the author(s).
AUTHOR CONTRIBUTIONS
Author contributions: J.C.W., S.K.S., and M.A. conception and design of research; J.C.W., S.K.S., T.S.M., and M.A. performed experiments; J.C.W. analyzed data; J.C.W., and M.A. interpreted results of experiments; J.C.W. prepared figures; J.C.W. drafted manuscript; J.C.W., S.K.S., T.S.M., R.S.R., and M.A. edited and revised manuscript; J.C.W., S.K.S., T.S.M., R.S.R., and M.A. approved final version of manuscript.
REFERENCES
- 1.Alkner BA, Tesch PA, Berg HE. Quadriceps EMG/force relationship in knee extension and leg press. Med Sci Sports Exerc 32: 459–463, 2000. [DOI] [PubMed] [Google Scholar]
- 2.Amann M, Blain GM, Proctor LT, Sebranek JJ, Pegelow DF, Dempsey JA. Implications of group III and IV muscle afferents for high-intensity endurance exercise performance in humans. J Physiol 589: 5299–5309, 2011. [DOI] [PMC free article] [PubMed] [Google Scholar]
- 3.Amann M, Eldridge MW, Lovering AT, Stickland MK, Pegelow DF, Dempsey JA. Arterial oxygenation influences central motor output and exercise performance via effects on peripheral locomotor muscle fatigue in humans. J Physiol 575: 937–952, 2006. [DOI] [PMC free article] [PubMed] [Google Scholar]
- 4.Amann M, Romer LM, Pegelow DF, Jacques AJ, Hess CJ, Dempsey JA. Effects of arterial oxygen content on peripheral locomotor muscle fatigue. J Appl Physiol (1985) 101: 119–127, 2006. [DOI] [PubMed] [Google Scholar]
- 5.Barker AT, Jalinous R, Freeston IL. Non-invasive magnetic stimulation of human motor cortex. Lancet 1: 1106–1107, 1985. [DOI] [PubMed] [Google Scholar]
- 6.Bigland-Ritchie B, Johansson R, Lippold OC, Woods JJ. Contractile speed and EMG changes during fatigue of sustained maximal voluntary contractions. J Neurophysiol 50: 313–324, 1983. [DOI] [PubMed] [Google Scholar]
- 7.Bigland-Ritchie BR, Furbush FH, Gandevia SC, Thomas CK. Voluntary discharge frequencies of human motoneurons at different muscle lengths. Muscle Nerve 15: 130–137, 1992. [DOI] [PubMed] [Google Scholar]
- 8.Brouwer B, Ashby P. Corticospinal projections to lower limb motoneurons in man. Exp Brain Res 89: 649–654, 1992. [DOI] [PubMed] [Google Scholar]
- 9.Brouwer B, Ashby P. Corticospinal projections to upper and lower limb spinal motoneurons in man. Electroencephalogr Clin Neurophysiol 76: 509–519, 1990. [DOI] [PubMed] [Google Scholar]
- 10.Carroll TJ, Baldwin ER, Collins DF, Zehr EP. Corticospinal excitability is lower during rhythmic arm movement than during tonic contraction. J Neurophysiol 95: 914–921, 2006. [DOI] [PubMed] [Google Scholar]
- 11.Day BL, Dressler D, Maertens de Noordhout A, Marsden CD, Nakashima K, Rothwell JC, Thompson PD. Electric and magnetic stimulation of human motor cortex: surface EMG and single motor unit responses. J Physiol 412: 449–473, 1989. [DOI] [PMC free article] [PubMed] [Google Scholar]
- 12.Di Lazzaro V, Restuccia D, Oliviero A, Profice P, Ferrara L, Insola A, Mazzone P, Tonali P, Rothwell JC. Effects of voluntary contraction on descending volleys evoked by transcranial stimulation in conscious humans. J Physiol 508: 625–633, 1998. [DOI] [PMC free article] [PubMed] [Google Scholar]
- 13.Dorel S, Guilhem G, Couturier A, Hug F. Adjustment of muscle coordination during an all-out sprint cycling task. Med Sci Sports Exerc 44: 2154–2164, 2012. [DOI] [PubMed] [Google Scholar]
- 14.Elmer SJ, Barratt PR, Korff T, Martin JC. Joint-specific power production during submaximal and maximal cycling. Med Sci Sports Exerc 43: 1940–1947, 2011. [DOI] [PubMed] [Google Scholar]
- 15.Farina D, Merletti R, Enoka RM. The extraction of neural strategies from the surface EMG. J Appl Physiol (1985) 96: 1486–1495, 2004. [DOI] [PubMed] [Google Scholar]
- 16.Goodall S, Romer LM, Ross EZ. Voluntary activation of human knee extensors measured using transcranial magnetic stimulation. Exp Physiol 94: 995–1004, 2009. [DOI] [PubMed] [Google Scholar]
- 17.Grillner S. Biological pattern generation: the cellular and computational logic of networks in motion. Neuron 52: 751–766, 2006. [DOI] [PubMed] [Google Scholar]
- 18.Lepers R, Maffiuletti NA, Rochette L, Brugniaux J, Millet GY. Neuromuscular fatigue during a long-duration cycling exercise. J Appl Physiol 92: 1487–1493, 2002. [DOI] [PubMed] [Google Scholar]
- 19.Martin PG, Butler JE, Gandevia SC, Taylor JL. Noninvasive stimulation of human corticospinal axons innervating leg muscles. J Neurophysiol 100: 1080–1086, 2008. [DOI] [PubMed] [Google Scholar]
- 20.Martin PG, Gandevia SC, Taylor JL. Output of human motoneuron pools to corticospinal inputs during voluntary contractions. J Neurophysiol 95: 3512–3518, 2006. [DOI] [PubMed] [Google Scholar]
- 21.Martin PG, Weerakkody N, Gandevia SC, Taylor JL. Group III and IV muscle afferents differentially affect the motor cortex and motoneurones in humans. J Physiol 586: 1277–1289, 2008. [DOI] [PMC free article] [PubMed] [Google Scholar]
- 22.Matthews PB. The effect of firing on the excitability of a model motoneurone and its implications for cortical stimulation. J Physiol 518: 867–882, 1999. [DOI] [PMC free article] [PubMed] [Google Scholar]
- 23.Mazzocchio R, Rothwell JC, Day BL, Thompson PD. Effect of tonic voluntary activity on the excitability of human motor cortex. J Physiol 474: 261–267, 1994. [DOI] [PMC free article] [PubMed] [Google Scholar]
- 24.Norgaard P, Nielsen JF, Andersen H. Post-exercise facilitation of compound muscle action potentials evoked by transcranial magnetic stimulation in healthy subjects. Exp Brain Res 132: 517–522, 2000. [DOI] [PubMed] [Google Scholar]
- 25.Oya T, Hoffman BW, Cresswell AG. Corticospinal-evoked responses in lower limb muscles during voluntary contractions at varying strengths. J Appl Physiol (1985) 105: 1527–1532, 2008. [DOI] [PubMed] [Google Scholar]
- 26.Rothwell JC, Thompson PD, Day BL, Boyd S, Marsden CD. Stimulation of the human motor cortex through the scalp. Exp Physiol 76: 159–200, 1991. [DOI] [PubMed] [Google Scholar]
- 27.Samii A, Wassermann EM, Ikoma K, Mercuri B, Hallett M. Characterization of postexercise facilitation and depression of motor evoked potentials to transcranial magnetic stimulation. Neurology 46: 1376–1382, 1996. [DOI] [PubMed] [Google Scholar]
- 28.Sidhu SK, Bentley DJ, Carroll TJ. Cortical voluntary activation of the human knee extensors can be reliably estimated using transcranial magnetic stimulation. Muscle Nerve 39: 186–196, 2009. [DOI] [PubMed] [Google Scholar]
- 29.Sidhu SK, Cresswell AG, Carroll TJ. Motor cortex excitability does not increase during sustained cycling exercise to volitional exhaustion. J Appl Physiol 113: 401–409, 2012. [DOI] [PubMed] [Google Scholar]
- 30.Sidhu SK, Hoffman BW, Cresswell AG, Carroll TJ. Corticospinal contributions to lower limb muscle activity during cycling in humans. J Neurophysiol 107: 306–314, 2012. [DOI] [PubMed] [Google Scholar]
- 31.Sidhu SK, Weavil JC, Venturelli M, Garten RS, Rossman MJ, Richardson RS, Gmelch BS, Morgan DE, Amann M. Spinal mu-opioid receptor-sensitive lower limb muscle afferents determine corticospinal responsiveness and promote central fatigue in upper limb muscle. J Physiol 592: 5011–5024, 2014. [DOI] [PMC free article] [PubMed] [Google Scholar]
- 32.Taylor AD, Bronks R. Reproducibility and validity of the quadriceps muscle integrated electromyogram threshold during incremental cycle ergometry. Eur J Appl Physiol Occup Physiol 70: 252–257, 1995. [DOI] [PubMed] [Google Scholar]
- 33.Taylor JL. Stimulation at the cervicomedullary junction in human subjects. J Electromyography kinesiol 16: 215–223, 2006. [DOI] [PubMed] [Google Scholar]
- 34.Taylor JL, Allen GM, Butler JE, Gandevia SC. Effect of contraction strength on responses in biceps brachii and adductor pollicis to transcranial magnetic stimulation. Exp Brain Res 117: 472–478, 1997. [DOI] [PubMed] [Google Scholar]
- 35.Taylor JL, Gandevia SC. Noninvasive stimulation of the human corticospinal tract. J Appl Physiol (1985) 96: 1496–1503, 2004. [DOI] [PubMed] [Google Scholar]
- 36.Taylor JL, Petersen NT, Butler JE, Gandevia SC. Interaction of transcranial magnetic stimulation and electrical transmastoid stimulation in human subjects. J Physiol 541: 949–958, 2002. [DOI] [PMC free article] [PubMed] [Google Scholar]
- 37.Todd G, Taylor JL, Gandevia SC. Measurement of voluntary activation of fresh and fatigued human muscles using transcranial magnetic stimulation. J Physiol 551: 661–671, 2003. [DOI] [PMC free article] [PubMed] [Google Scholar]
- 38.Ugawa Y, Rothwell JC, Day BL, Thompson PD, Marsden CD. Percutaneous electrical stimulation of corticospinal pathways at the level of the pyramidal decussation in humans. Ann Neurol 29: 418–427, 1991. [DOI] [PubMed] [Google Scholar]
- 39.Zehr EP, Duysens J. Regulation of arm and leg movement during human locomotion. Neuroscientist 10: 347–361, 2004. [DOI] [PubMed] [Google Scholar]
- 40.Zehr EP, Stein RB. What functions do reflexes serve during human locomotion? Progress Neurobiol 58: 185–205, 1999. [DOI] [PubMed] [Google Scholar]