

Abstract
People who inject drugs continue to be at greatly increased risk of HIV infection in the United States. We modeled HIV transmission in a dynamic network of drug users and non-drug users (representing the New York metropolitan statistical area population) to estimate the effectiveness of various combination prevention scenarios. We first assumed that current approaches continue (status quo), and then compared projected HIV incidence at 2020 and 2040 to those derived from hypothetical initiatives: (1) scale-up HIV testing, (2) increased access to substance abuse treatment, (3) improved coverage of needle and syringe programs, (4) scaling up Treatment as Prevention; and (5), “high-impact“ combination prevention, combining strategies (1) through (4). No strategy completely eliminated HIV transmission. High-impact prevention produced the largest decrease in HIV incidence, a 62% reduction compared to the status quo. Increased resources for and investment in multi-modality HIV prevention approaches will be required to eliminate HIV transmission among people who inject drugs.
Keywords: AIDS/HIV, epidemiology, public health, substance abuse, injection drug use
Introduction
HIV infection among people who inject drugs (PWID) is an ongoing public health problem in the United States.1,2 The large-scale implementation of interventions to reduce injection risk behavior has led to substantial reductions in HIV incidence among PWID populations in many US settings, including New York City.3,4 However, recent surveillance data from the Centers for Disease Control and Prevention (CDC) indicate that declines in incidence among PWID have stalled, with approximately one in ten new HIV infections attributable to injection drug use annually (representing 4,000 new cases per year).5
To inform improved public health response to the epidemic, expert bodies, including the CDC, have published summary guidance that recommends prevention strategies focus on the integration of biomedical, behavioral, and structural interventions to reduce HIV infectiousness and susceptibility.6,7 Specifically, CDC guidance recommends a prevention package that includes: needle and syringe programs (NSPs), opioid substitution therapy and other forms of substance abuse treatment, voluntary HIV testing and counseling, and, for HIV positive PWID, access to highly active antiretroviral therapy (HAART).7
Despite growing interest in combination HIV prevention for PWID,8,9 there exists a scarcity of evidence to inform optimized prevention packages. To achieve greater effectiveness, combination prevention must account for the evolving epidemiology of HIV among PWID, including dynamic sexual and injecting networks and shifts in HIV risk behavior.2,10 Furthermore, although studies conducted in New York City and elsewhere suggest that the presence of multiple interventions can reduce HIV prevalence among PWIDs to below 10%,11,12 the cooperative and/or interactive mechanisms through which combined approaches could achieve maximal effectiveness have yet to be elucidated. However, in order to identify both the independent and combined effects of multiple interventions operating in concert, large, long-term studies using complicated factorial designs would be required.13
To address these research priorities, the CDC has promoted the development of mathematical models to inform the successful implementation of “high-impact prevention” strategies.14 Using a type of microsimulation known as agent-based modeling, we conducted this study to compare the effectiveness of combination intervention strategies to eliminate new HIV infections among PWIDs in the New York metropolitan area.
Methods
We developed a stochastic agent-based model (ABM) that describes HIV transmission in an artificial population of PWID, non-injection drug users (NIDU), and non-drug users. The ABM simulates individual “agents” as they interact within a dynamic sexual and injecting network. We describe here the main features of the model, with additional information provided in the online Appendix. A detailed description of model development, construction, and calibration has also been published previously.15
Agent Characteristics and Model Structure
The ABM is coded in Python™ and consists of 150,000 agents. The model is constructed to represent the sexually active adult population (15 to 64 years of age) in the New York metropolitan statistical area (MSA). The model simulates the passage of time in discrete annual time steps. At each time-step, agent states are updated (e.g., HIV disease stage) based on pre-programmed rules and interactions with other agents. Agents enter the model stochastically and exit the population when they die from HIV or other causes. In addition to three time-varying drug use states (PWID, NIDU, and non-drug users), agents are stratified by sex (male, female) and sexual orientation – men who have sex with men (MSM), women who have sex with women (WSW), and heterosexual males (HM) and females (HF). To be consistent with CDC surveillance definitions,16 PWID are agents who have injected an illicit drug in the past year. Similarly, NIDU are agents who have used an illicit drug by non-injection means in the past year (excluding marijuana). At model initialization, 1.2% and 6.5% of the population are PWID and NIDU, respectively.17,18 The full set of parameter values for PWID, NIDU, and non-drug users are shown in online Appendix Exhibits A1-A3.
Agent Network
The model is initialized by placing agents in a network (Appendix Exhibit A4). Network links represent sexual activity, and, if both agents are PWID, injecting behavior. The number of sexual and injecting partners at each time step is specified by random sampling procedures from negative binomial distributions (Exhibit A5) and parameterized from published estimates.19-21 At each time step, partnerships are formed, broken or maintained, based on a partnership retention algorithm (see Appendix). To incorporate assortative (i.e., non-random) mixing, partnerships are weighted to favour the formation of links between nodes with similar characteristics. For example, PWID are fourfold more likely to establish links with other PWID.19
Two agents in a partnership can engage in unprotected intercourse (defined as <100% consistent condom use), and, if both are PWID, share syringes. The probability of risk behavior between two agents depends on whether one or both are engaged in HIV prevention programs (see Appendix).
HIV Transmission, Testing, Treatment, and Disease Progression
At model initialization, HIV is distributed in the agent population according to published estimates (references in Appendix). At each time step, uninfected agents can acquire HIV from seropositive partners. The risk of infection is determined by the sex and sexual orientation of the agents, the type of risk behavior engaged in, and the HIV disease stage and treatment status (including adherence) of the seropositive agent (Appendix Exhibit A1). The transmission risk from agents in latent stage HIV disease is parameterized based on mean set-point viral load (approximately 4 log10 copies/mL).22,23 The risk of transmission from partners in acute stage infection is elevated, based on previously published estimates.24
At each time step, agents can access HIV testing. Once an agent tests HIV positive, they are eligible to initiate HAART. Agents initiating therapy are assigned adherence levels (between 0% and 100%), such that 60% of agents achieve ≥90% adherence.25 To model the effect of HAART on HIV transmission, the relationship between adherence, log10 viral load, and per-act risk of infection is assumed to be linear.26-28 Adherence to HAART also determines the rate of HIV disease progression (i.e., AIDS and death). To reflect imperfect engagement in HIV care, agents can discontinue therapy (and re-initiate therapy at any time point thereafter).
Model Scenarios
To examine the effect of combination HIV prevention strategies on HIV incidence, we included interventions considered by the WHO/UNODC/UNAIDS as “core” services for PWID.29 In addition to HIV testing and Treatment as Prevention (TasP) strategies, we modeled NSPs and substance abuse treatment. Engagement in the suite of HIV prevention interventions is explicitly inter-dependent and not necessarily linear (see Appendix Exhibit A6). For example, NSP use improves access to substance abuse treatment,30 which in turn increases the rate at which HIV positive PWID initiate HIV treatment.31
As a first step, we projected the course of the HIV epidemic among PWIDs in the New York MSA assuming a status quo strategy. In this scenario, we parameterized the model to reflect actual intervention coverage in 2012, and assumed this coverage remains constant over the projected time period. The coverage of HIV prevention services and annual rate of HIV testing and HIV treatment initiation for the status quo strategy are shown in Exhibit 1 (references in Appendix Exhibit A1). Second, we simulated four hypothetical scenarios, representing increased availability, coverage, and use of one of four interventions: (1) HIV testing, (2) substance abuse treatment, (3) needle and syringe programs (NSPs), and (4) HIV Treatment as Prevention (see Exhibit 1). Third, we modeled a “high-impact combination prevention” scenario, which included a scale-up of all interventions (1) through (4). In a final set of simulations, we examined “dual” scenarios, consisting of pairwise combinations of interventions.
EXHIBIT 1. Hypothetical HIV prevention strategies for PWID.
| Strategy | Rate of HIV Testing | Rate of Initiating (Discontinuing) SA Treatment | Likelihood of Syringe Sharing | Rate of Initiating (Discontinuing) HAART | Likelihood of ≥90% Adherence to HAART |
|---|---|---|---|---|---|
| Status Quo (1) | 25% of PWID tested per year (45% among PWID accessing NSPs) | 9% (50%) of PWID initiate (discontinue) SA treatment per year; 18% initiation rate among PWID accessing NSPs | 20% of PWID share syringes per year (10% among those in SA treatment) | 8% (35%) of HIV+ PWID initiate (discontinue) HAART per year; 14% (20%) among those in SA treatment | 60% of HIV+ PWID on HAART achieve ≥90% adherence |
| Increase HIV Testing (2) | 50% of PWID tested per year (90% among PWID accessing NSPs) | (1) | (1) | (1) | (1) |
| Improve SA Treatment (3) | (1) | 18% (25%) of PWID initiate (discontinue) SA treatment per year; 36% initiation rate among PWID accessing NSPs | (1) | (1) | (1) |
| Increase NSP Coverage (4) | (1) | (1) | 10% of PWID share syringes per year (5% of PWID in SA treatment) | (1) | (1) |
| Scale-up Treatment as Prevention (TAsP) (5) | (1) | (1) | (1) | 16% (17.5%) of HIV+ PWID population initiate (discontinue) HAART per year; 28% (10%) among those in SA treatment | (1) |
| High-Impact Combination Prevention (6) | Same as Increase HIV Testing strategy | Same as Improve SA Treatment strategy | Same as Increase NSP Coverage strategy | Same as Scale-up TAsP strategy | Same as Scale-up TAsP strategy |
Note: (1) refers to same value as status quo strategy. Abbreviations: HAART – highly active antiretroviral therapy; NSP – needle and syringe program; people who inject drugs (PWID); SA – substance abuse; TasP – treatment as prevention.
Model Outcomes
The primary outcome was HIV incidence (per 1,000 person-years) in 2020 and 2040 among PWID residing in the New York MSA, for each of the status quo and hypothetical prevention strategies. The years 2020 and 2040 were chosen as the end time points of interest to identify both shorter- and longer-term potential impacts of combination prevention strategies. Although the 2040 HIV incidence estimates have greater uncertainty than those at the earlier time point, we chose to show these values since previous modeling studies in international settings have demonstrated that the full impact of combination prevention strategies may only accrue after 10-15 years.32,33 The simulation also estimates HIV incidence in the NIDU and non-drug using populations, which we used to calibrate the model (see Appendix). In accordance with previous agent-based epidemiologic models,15,34 we ran the model 50 times for each scenario to obtain mean estimates and 95% confidence intervals. All simulations were run on a Beowulf supercomputing cluster.
Model Calibration
Detailed model calibration procedures are provided in the Appendix. In brief, we calibrated model outputs to historic HIV surveillance data from the New York City Department of Health & Mental Hygiene,35,36 and to previously validated estimates of key epidemiologic outcomes for PWID, computed for the New York MSA between 1992 and 2002.18,37,38 We also used historical HIV incidence estimates (1992-2002) for New York PWID to calibrate the primary outcome of interest (see Exhibit 2).3 Calibrated outputs for other variables of interest (e.g., drug user prevalence, AIDS incidence) are shown Appendix exhibits A7-A9.
EXHIBIT 2. Historical (1992-2011) and projected (2012-2040) HIV incidence (per 1,000 person-years) among PWID in residing in the New York metropolitan area, for various HIV prevention strategies.

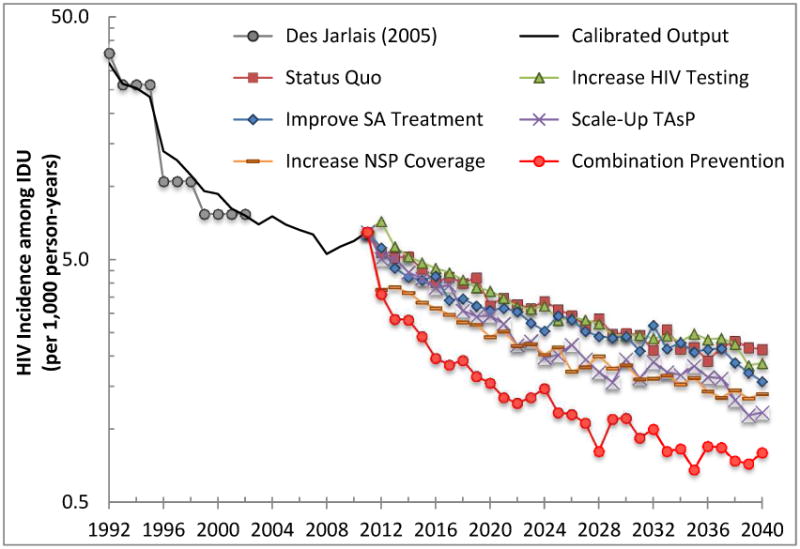
Sources: Black solid line represents previously published calibrated output.15 Empirical data (shown in gray) obtained from Des Jarlais (2005.3
Notes: Hypohetical prevention strategies as described in Exhibit 1. Abbreviations: HIV – human immunodeficiency virus; PWID – people who inject drugs; NSP – needle and syringe exchange program; SA – substance abuse; TAsP – treatment as prevention.
Sensitivity Analyses
Recognizing the extent of uncertainty in the model processes and parameter estimates, we conducted a series of sensitivity analyses to examine model robustness. As described in the Appendix, we varied key parameters including per-contact transmission rates, HIV disease progression probabilities, and sexual risk behavior, and analyzed the projected HIV incidence at 2040. To further examine the relative benefits and ranking of hypothetical strategies examined herein, we conducted a second set of sensitivity analyses representing idealized program effectiveness, including 100% annual HIV testing rates, 100% adherence to HAART, etc.
Limitations
Like all mathematical models, this study has important limitations. First, as in any modeling exercise, there exists uncertainty in parameter estimates. To address this issue, we conducted a number of sensitivity analyses involving key parameters of interest, and observed that the primary findings were largely insensitive to variations in parameter values. Second, the replication of historically observed estimates does not necessary imply model validity. However, we conducted a comprehensive calibration procedure, comparing multiple outputs (e.g., drug user prevalence, HIV incidence, AIDS incidence) to empirical estimates from several validated data sources. Third, we made simplifying assumptions regarding agent behavior and other model phenomena, including for example stable rates of engagement in risk behavior over the course of HIV disease. Fourth, although the agent-based approach allows for greater heterogeneity in individual behavior than most compartmental models (e.g., the inclusion of multiple, overlapping risks in sub-groups such as MSM who also inject drugs), there are additional sources of variability in HIV risk and transmissibility that we did not account for. These include HIV transmission in the context of sex work, types of drugs used, and co-morbid infections such as STIs and hepatitis C. As such, we were unable to model interventions that influence these factors (e.g., STI screening and treatment). Further, our results likely underestimate the overall effect of intervention scenarios that reduce HIV incidence in part through these mechanisms. Fifth, we relied on a relatively coarse timescale of annual time steps in order to reduce computational requirements, which may have limited our ability to capture shorter-term behavioral and network dynamics. However, any effect of doing so should apply similarly to all scenarios, and therefore the cross-scenario comparisons remain valid. Sixth, we did not consider the effects of these interventions on incidence in non-injection drug-using populations and other groups of interest, including men who have sex with men. Examining combination prevention strategies in these populations will be the focus of future research. Seventh, our model was parameterized to represent HIV transmission dynamics among PWID residing in an urban, US context. Given the diversity of PWID population behavior, network dynamics, and environments in which parenteral HIV transmission occurs, our results are not necessarily generalizable to other settings, particularly those outside the United States. Finally, as with any simulation model, longer-term projections are subject to greater uncertainty, as they do not capture future innovations, novel prevention tools, and other unforeseen epidemic dynamics. The model estimates for future HIV incidence, particularly in 2040, should thus be interpreted with appropriate caution.
Results
Projected HIV incidence values at year 2040 are shown in Exhibit 3. In the status quo strategy, HIV incidence at years 2020 and 2040 was estimated to be 3.2 per 1,000 person-years (95%CI: 2.9–3.6) and 2.1 per 1,000 person-years (95%CI: 1.9– 2.4), respectively. As shown in Exhibit 3, every hypothetical strategy resulted in a greater reduction in HIV incidence at year 2040 compared to the status quo. Specifically, increased HIV testing resulted in a 12.2% (95%CI: -5.2% – 29.6%) reduction in HIV incidence at year 2040, increased access to substance abuse treatment resulted in a 26.3% reduction (95%CI: 11.3% – 41.3%), increased NSP coverage resulted in a 34.3% reduction (95%CI: 19.4% - 49.2%), and scaling-up treatment as prevention resulted in a 45.1% reduction (95%CI: 32.9% – 57.3%) in HIV incidence, all compared to the status quo strategy. The high-impact combination prevention scenario (i.e., combining all strategies listed above) produced the largest reduction in HIV incidence (62.4%, 95%CI: 52.6% – 72.2%), with a mean value of 0.8 per 1,000 person-years (95%CI: 0.6–1.0) at year 2040.
EXHIBIT 3. Projected HIV incidence (per 1,000 person-years) at 2040 among PWID residing in the New York metropolitan area, for hypothetical HIV prevention strategies.

Notes: Hypohetical prevention strategies as described in Exhibit 1. Abbreviations: HIV – human immunodeficiency virus; PWID – people who inject drugs; NSP – needle and syringe exchange program; SA – substance abuse; TAsP – treatment as prevention.
The HIV incidence trajectories for each scenario are shown in Exhibit 2. The high-impact combination prevention strategy produced a more immediate drop in new infections compared to the other prevention scenarios. For this reason, the high-impact combination prevention strategy led to the largest proportion of new cases averted. Specifically, the total number of new cases observed over the simulation lifetime (2012-2040) was 55% lower in the high-impact combination prevention strategy compared to the status quo.
The results of the pairwise “dual strategy” simulations are shown in Exhibit 4. All scenarios resulted in lower HIV incidence among PWIDs in 2040 compared to the status quo. Three of the six dual strategies (increased substance abuse treatment with scaling up treatment as prevention, increased substance abuse treatment with improved NSP coverage, and improved NSP coverage with scaling up treatment as prevention) resulted in an HIV incidence among PWIDs of less than 1 per 1,000 at 2040.
EXHIBIT 4. Projected HIV incidence (per 1,000 person-years) at 2040 among PWID residing in the New York metropolitan area for hypothetical “dual” HIV prevention strategies.

Notes: Hypohetical prevention strategies as described in Exhibit 1. Abbreviations: HIV – human immunodeficiency virus; PWID – people who inject drugs; NSP – needle and syringe exchange program; SA – substance abuse; TAsP – treatment as prevention.
Sensitivity Analyses
The results of the sensitivity analyses are shown in online Appendix exhibit A10 and A11. As expected, an increase in the per-contact rate of HIV transmission resulted in higher HIV incidence at 2040 (Exhibit A10, Panel I). The model results appeared robust to changes in the probability of progression to AIDS (Exhibit A10, Panel II) and increases in sexual risk behavior (Exhibit A10, Panel III). The results of scenario-based sensitivity analyses (Exhibit A11) suggest that further reductions in HIV incidence would be observed if HIV testing were scaled to 100% of the PWID population annually (from 50% and 90% of the non-NSP and NSP attendees tested annually in the primary “increase HIV testing” scenario, respectively). Increasing NSP coverage from 90% to 95% (i.e., only 5% of injecting events involve the re-use of syringes) also resulted in further decreases in HIV incidence. Treatment as prevention scenarios in which all PWID were adherent to and never discontinue therapy each resulted in similar HIV incidence estimates compared to that obtained from the primary “scale-up TAsP” strategy.
Discussion
Results of this simulation study suggest that a dramatic scale-up multiple prevention programs would be required to significantly reduce the rate of new HIV infections among PWID over the coming decades. Although no strategy completely eliminated HIV transmission in the simulated PWID population, three “dual strategies” and a “high-impact” combination prevention approach resulted in an incidence of less than one new case per 1,000 per year. The immediate expansion of multiple prevention interventions in PWID communities appears to be required to substantially reduce parenteral HIV transmission in established epidemics in the United States.
The projected scenarios reveal several important implications for health policy and HIV prevention planning. First, increasing the rate of HIV testing as a standalone intervention may not reduce HIV incidence significantly. Rather, a comprehensive “treatment as prevention” (TAsP) strategy, which included increasing access to HIV treatment for PWID, improving adherence to therapy, and ensuring continuation in care, was among the most effective intervention analyzed. Second, our results demonstrate that “dual” strategies, in which scaling-up TAsP is paired with increasing substance abuse treatment initiation or sterile syringe distribution, may be highly effective. In the United States, coverage of NSPs and opioid substitution therapy (OST) programs (defined as the number of sterile syringes distributed and number of OST recipients per PWID per year) remain significantly lower than in Australia, Canada, and most nations in the Western European region.39 Increased funding and resources for these programs at US federal and state levels is strongly recommended. Our study sought to simulate HIV transmission among PWID in a large urban US setting (New York City), and therefore the model does not necessarily account for geographic and other population variations in PWID communities. Nonetheless, these “dual scenario” results may also have important implications for international settings that restrict access to non-antiviral based HIV prevention modalities for PWID. To achieve larger, sustained reductions in HIV incidence, political and ideological opposition to harm reduction and substitution-based therapies must be overcome. Political will, public health leadership, and, in some countries, the reform of laws banning access to evidence-based HIV prevention strategies are therefore required to implement the combined intervention approaches found to be effective in this study.40
Our findings are consistent with those of previously published deterministic models examining combination prevention programs for HIV prevention among PWIDs in low- and middle-income countries.33,41,42 For example, in a model of HIV transmission among PWID in Ukraine,33 expanding methadone maintenance therapy and antiretroviral therapy averted the most number of new cases compared to no intervention. In another model assessing the combined effect of opioid substitution treatment, NSPs, and HAART for PWID, increasing coverage of each intervention by 50% resulted in an approximately 40% reduction in HIV incidence after 5 years.43
Further work and empirical studies are required to determine the cost-effectiveness of “high-impact” combination prevention and whether multiple interventions are most effective if integrated in the same facilities (or whether they simply need to co-exist in communities). However, these results clearly demonstrate the need to dramatically scale-up HIV treatment as prevention, harm reduction, and substitution therapy programs for people who inject drugs.
Supplementary Material
Contributor Information
Brandon D. L. Marshall, Email: brandon_marshall@brown.edu, the Department of Epidemiology, Brown University School of Public Health, in Providence, Rhode Island.
Samuel R. Friedman, National Development and Research Institutes, in New York City.
João F. G. Monteiro, the Department of Epidemiology, Brown University School of Public Health.
Magdalena Paczkowski, the Department of Epidemiology, Columbia Mailman School of Public Health, in New York City.
Barbara Tempalski, the Institute of Infectious Disease Research.
Enrique R. Pouget, the Institute of Infectious Disease Research.
Mark N. Lurie, the Department of Epidemiology, Brown University School of Public Health.
Sandro Galea, the Department of Epidemiology, Columbia Mailman School of Public Health.
References
- 1.Centers for Disease Control and Prevention (CDC) HIV Infection and HIV-Associated Behaviors Among Injecting Drug Users - 20 Cities, United States, 2009. MMWR Morb Mortal Wkly Rep. 2012;61:133–138. [PubMed] [Google Scholar]
- 2.Strathdee SA, Stockman JK. Epidemiology of HIV among injecting and non-injecting drug users: current trends and implications for interventions. Curr HIV/AIDS Rep. 2010;7(2):99–106. doi: 10.1007/s11904-010-0043-7. [DOI] [PMC free article] [PubMed] [Google Scholar]
- 3.Des Jarlais DC, Perlis T, Arasteh K, et al. HIV incidence among injection drug users in New York City, 1990 to 2002: Use of serologic test algorithm to assess expansion of HIV prevention services. Am J Public Health. 2005;95(8):1439–1444. doi: 10.2105/AJPH.2003.036517. [DOI] [PMC free article] [PubMed] [Google Scholar]
- 4.Mehta SH, Galai N, Astemborski J, et al. HIV incidence among injection drug users in Baltimore, Maryland (1988-2004) J Acquir Immune Defic Syndr. 2006;43(3):368–372. doi: 10.1097/01.qai.0000243050.27580.1a. [DOI] [PubMed] [Google Scholar]
- 5.Centers for Disease Control and Prevention. Estimated HIV Incidence in the United States, 2007-2010. HIV Surveillance Supplemental Report. 2012;17(4) Published December 2012 [cited 2013 Dec 7]. Available from: http://www.cdc.gov/hiv/topics/surveillance/resources/reports/-supplemental. [Google Scholar]
- 6.Institute of Medicine. Preventing HIV Infection among Injecting Drug Users in High Risk Countries: An Assessment of the Evidence. Washington, DC: National Academy of Sciences; 2007. [Google Scholar]
- 7.Centers for Disease Control and Prevention. Integrated Prevention Services for HIV Infection, Viral Hepatitis, Sexually Transmitted Diseases, and Tuberculosis for Persons Who Use Drugs Illicitly: Summary Guidance from CDC and the U.S. Department of Health and Human Services. MMWR Morb Mortal Wkly Rep. 2012;61(RR-5):1–40. [PubMed] [Google Scholar]
- 8.U.S. Department of State. Creating an AIDS-Free Generation: Remarks from Secretary of State Hillary Rodham Clinton. Bethesda, MD: National Institutes of Health; 2011. Internet. [cited 2012 Apr 16]. Available from: http://www.state.gov/secretary/rm/2011/11/176810.htm. [Google Scholar]
- 9.Needle R, Fu J, Beyrer C, et al. PEPFAR's evolving HIV prevention approaches for key populations--people who inject drugs, men who have sex with men, and sex workers: progress, challenges, and opportunities. J Acquir Immune Defic Syndr. 2012;60(Suppl 3):S145–S151. doi: 10.1097/QAI.0b013e31825f315e. [DOI] [PubMed] [Google Scholar]
- 10.Friedman SR, Rossi D, Braine N. Theorizing “Big Events” as a potential risk environment for drug use, drug-related harm and HIV epidemic outbreaks. Int J Drug Policy. 2009;20(3):283–291. doi: 10.1016/j.drugpo.2008.10.006. [DOI] [PubMed] [Google Scholar]
- 11.Van Den Berg C, Smit C, Van Brussel G, Coutinho R, Prins M. Full participation in harm reduction programmes is associated with decreased risk for human immunodeficiency virus and hepatitis C virus: evidence from the Amsterdam Cohort Studies among drug users. Addiction. 2007;102(9):1454–1462. doi: 10.1111/j.1360-0443.2007.01912.x. [DOI] [PMC free article] [PubMed] [Google Scholar]
- 12.Des Jarlais DC, Arasteh K, McKnight C, et al. HIV infection during limited versus combined HIV prevention programs for IDUs in New York City: the importance of transmission behaviors. Drug Alcohol Depend. 2010;109(1-3):154–160. doi: 10.1016/j.drugalcdep.2009.12.028. [DOI] [PMC free article] [PubMed] [Google Scholar]
- 13.Thiébaut R, May MT. Mathematical modelling of HIV prevention intervention. AIDS. 2013;27(3):475–476. doi: 10.1097/QAD.0b013e32835c1509. [DOI] [PubMed] [Google Scholar]
- 14.Mermin J, Fenton KA. The future of HIV prevention in the United States. JAMA. 2012;308(4):347–348. doi: 10.1001/jama.2012.8693. [DOI] [PubMed] [Google Scholar]
- 15.Marshall BDL, Paczkowski MM, Seemann L, et al. A complex systems approach to evaluate HIV prevention in metropolitan areas: Preliminary implications for combination intervention strategies. PLoS ONE. 2012;7(9):e44833. doi: 10.1371/journal.pone.0044833. [DOI] [PMC free article] [PubMed] [Google Scholar]
- 16.Gallagher KM, Sullivan PS, Lansky A, Onorato IM. Behavioral surveillance among people at risk for HIV infection in the U.S.: The National HIV Behavioral Surveillance System. Public Health Rep. 2007;122(Suppl 1):S32–S38. doi: 10.1177/00333549071220S106. [DOI] [PMC free article] [PubMed] [Google Scholar]
- 17.Substance Abuse and Mental Health Services Administration (SAMHSA) National Prevalence Estimates for Top 20 Metropolitan Statistical Areas (MSAs) U.S. Department of Health and Human Service; 2010. Internet. [cited 2011 Dec 20]. Available from: http://oas.samhsa.gov/2k5States/metro2k5PE.doc. [Google Scholar]
- 18.Brady JE, Friedman SR, Cooper HL, Flom PL, Tempalski B, Gostnell K. Estimating the prevalence of injection drug users in the U.S. and in large U.S. metropolitan areas from 1992 to 2002. J Urban Health. 2008;85(3):323–351. doi: 10.1007/s11524-007-9248-5. [DOI] [PMC free article] [PubMed] [Google Scholar]
- 19.Latkin CA, Forman V, Knowlton A, Sherman S. Norms, social networks, and HIV-related risk behaviors among urban disadvantaged drug users. Soc Sci Med. 2003;56(3):465–476. doi: 10.1016/s0277-9536(02)00047-3. [DOI] [PubMed] [Google Scholar]
- 20.Kottiri BJ, Friedman SR, Neaigus A, Curtis R, Des Jarlais DC. Risk networks and racial/ethnic differences in the prevalence of HIV infection among injection drug users. J Acquir Immune Defic Syndr. 2002;30(1):95–104. doi: 10.1097/00042560-200205010-00013. [DOI] [PubMed] [Google Scholar]
- 21.Friedman SR, Curtis R, Neaigus A, Jose B, Des Jarlais DC. Social Networks, Drug Injectors' Lives, and HIV/AIDS. New York, NY: Kluwer Academic Inc.; 2010. [Google Scholar]
- 22.Fraser C, Hollingsworth TD, Chapman R, de Wolf F, Hanage WP. Variation in HIV-1 set-point viral load: epidemiological analysis and an evolutionary hypothesis. Proc Natl Acad Sci U S A. 2007;104(44):17441–17446. doi: 10.1073/pnas.0708559104. [DOI] [PMC free article] [PubMed] [Google Scholar]
- 23.Hughes JP, Baeten JM, Lingappa JR, et al. Determinants of per-coital-act HIV-1 infectivity among African HIV-1-serodiscordant couples. J Infect Dis. 2012;205(3):358–365. doi: 10.1093/infdis/jir747. [DOI] [PMC free article] [PubMed] [Google Scholar]
- 24.Wawer MJ, Gray RH, Sewankambo NK, et al. Rates of HIV-1 transmission per coital act, by stage of HIV-1 infection, in Rakai, Uganda. J Infect Dis. 2005;191(9):1403–1409. doi: 10.1086/429411. [DOI] [PubMed] [Google Scholar]
- 25.Malta M, Magnanini MM, Strathdee SA, Bastos FI. Adherence to antiretroviral therapy among HIV-infected drug users: a meta-analysis. AIDS Behav. 2010;14(4):731–747. doi: 10.1007/s10461-008-9489-7. [DOI] [PubMed] [Google Scholar]
- 26.Quinn TC, Wawer MJ, Sewankambo N, et al. Viral load and heterosexual transmission of human immunodeficiency virus type 1. Rakai Project Study Group. N Engl J Med. 2000;342(13):921–929. doi: 10.1056/NEJM200003303421303. [DOI] [PubMed] [Google Scholar]
- 27.Attia S, Egger M, Muller M, Zwahlen M, Low N. Sexual transmission of HIV according to viral load and antiretroviral therapy: systematic review and meta-analysis. AIDS. 2009;23(11):1397–1404. doi: 10.1097/QAD.0b013e32832b7dca. [DOI] [PubMed] [Google Scholar]
- 28.Martin M, Del Cacho E, Codina C, et al. Relationship between adherence level, type of the antiretroviral regimen, and plasma HIV type 1 RNA viral load: a prospective cohort study. AIDS Res Hum Retroviruses. 2008;24(10):1263–1268. doi: 10.1089/aid.2008.0141. [DOI] [PubMed] [Google Scholar]
- 29.World Health Organization (WHO) WHO, UNODC, UNAIDS technical guide for countries to set targets for universal access to HIV prevention, treatment, and care for injecting drug users – 2012 revision. Geneva, Switzerland: WHO HIV/AIDS Programme; 2012. [Google Scholar]
- 30.Hagan H, McGough JP, Thiede H, Hopkins S, Duchin J, Alexander ER. Reduced injection frequency and increased entry and retention in drug treatment associated with needle-exchange participation in Seattle drug injectors. J Subst Abuse Treat. 2000;19(3):247–252. doi: 10.1016/s0740-5472(00)00104-5. [DOI] [PubMed] [Google Scholar]
- 31.Celentano DD, Galai N, Sethi AK, et al. Time to initiating highly active antiretroviral therapy among HIV-infected injection drug users. AIDS. 2001;15(13):1707–1715. doi: 10.1097/00002030-200109070-00015. [DOI] [PubMed] [Google Scholar]
- 32.Alsallaq RA, Baeten JM, Celum CL, et al. Understanding the potential impact of a combination HIV prevention intervention in a hyper-endemic community. PLoS ONE. 2013;8(1):e54575. doi: 10.1371/journal.pone.0054575. [DOI] [PMC free article] [PubMed] [Google Scholar]
- 33.Alistar SS, Owens DK, Brandeau ML. Effectiveness and cost effectiveness of expanding harm reduction and antiretroviral therapy in a mixed HIV epidemic: a modeling analysis for Ukraine. PLoS Med. 2011;8(3):e1000423. doi: 10.1371/journal.pmed.1000423. [DOI] [PMC free article] [PubMed] [Google Scholar]
- 34.Kumar S, Grefenstette JJ, Galloway D, Albert SM, Burke DS. Policies to Reduce Influenza in the Workplace: Impact Assessments Using an Agent-Based Model. Am J Public Health. 2013 doi: 10.2105/AJPH.2013.301269. [DOI] [PMC free article] [PubMed] [Google Scholar]
- 35.Torian LV, Bennani Y, Frieden TR. What is the true prevalence of HIV in New York City: Estimating the number of undiagnosed and unreported persons living with HIV and AIDS; Paper presented at: 12th Conference on Retroviruses & Opportunistic Infections; 2005 Feb 22-25; Boston, MA. 2003. [Google Scholar]
- 36.New York City Department of Health and Mental Hygiene. HIV/AIDS Annual Surveillance Statistics. 2012 Internet. [cited 2013 Dec 3]. Available from: http://www.nyc.gov/html/doh/html/data/hivtables.shtml.
- 37.Tempalski B, Lieb S, Cleland CM, Cooper H, Brady JE, Friedman SR. HIV prevalence rates among injection drug users in 96 large US metropolitan areas, 1992-2002. J Urban Health. 2009;86(1):132–154. doi: 10.1007/s11524-008-9328-1. [DOI] [PMC free article] [PubMed] [Google Scholar]
- 38.Friedman SR, West BS, Pouget ER, et al. Metropolitan Social Environments and Pre-HAART/HAART Era Changes in Mortality Rates (per 10,000 Adult Residents) among Injection Drug Users Living with AIDS. PLoS ONE. 2013;8(2):e57201. doi: 10.1371/journal.pone.0057201. [DOI] [PMC free article] [PubMed] [Google Scholar]
- 39.Mathers BM, Degenhardt L, Ali H, et al. HIV prevention, treatment, and care services for people who inject drugs: a systematic review of global, regional, and national coverage. Lancet. 2010;375(9719):1014–1028. doi: 10.1016/S0140-6736(10)60232-2. [DOI] [PubMed] [Google Scholar]
- 40.Beyrer C, Malinowska-Sempruch K, Kamarulzaman A, Kazatchkine M, Sidibe M, Strathdee SA. Time to act: a call for comprehensive responses to HIV in people who use drugs. Lancet. 2010;376(9740):551–563. doi: 10.1016/S0140-6736(10)60928-2. [DOI] [PMC free article] [PubMed] [Google Scholar]
- 41.Strathdee SA, Hallett TB, Bobrova N, et al. HIV and risk environment for injecting drug users: the past, present, and future. Lancet. 2010;376(9737):268–284. doi: 10.1016/S0140-6736(10)60743-X. [DOI] [PMC free article] [PubMed] [Google Scholar]
- 42.Dutta A, Wirtz AL, Baral S, Beyrer C, Cleghorn FR. Key harm reduction interventions and their impact on the reduction of risky behavior and HIV incidence among people who inject drugs in low-income and middle-income countries. Curr Opin HIV AIDS. 2012;7(4):362–368. doi: 10.1097/COH.0b013e328354a0b5. [DOI] [PubMed] [Google Scholar]
- 43.Degenhardt L, Mathers B, Vickerman P, Rhodes T, Latkin C, Hickman M. Prevention of HIV infection for people who inject drugs: why individual, structural, and combination approaches are needed. Lancet. 2010;376(9737):285–301. doi: 10.1016/S0140-6736(10)60742-8. [DOI] [PubMed] [Google Scholar]
Associated Data
This section collects any data citations, data availability statements, or supplementary materials included in this article.