Abstract
This study assessed the correlation of N95 filtering face-piece respirator (FFR) fit between a Static Advanced Headform (StAH) and 10 human test subjects. Quantitative fit evaluations were performed on test subjects who made three visits to the laboratory. On each visit, one fit evaluation was performed on eight different FFRs of various model/size variations. Additionally, subject breathing patterns were recorded. Each fit evaluation comprised three two-minute exercises: “Normal Breathing,” “Deep Breathing,” and again “Normal Breathing.” The overall test fit factors (FF) for human tests were recorded. The same respirator samples were later mounted on the StAH and the overall test manikin fit factors (MFF) were assessed utilizing the recorded human breathing patterns. Linear regression was performed on the mean log10-transformed FF and MFF values to assess the relationship between the values obtained from humans and the StAH.
This is the first study to report a positive correlation of respirator fit between a headform and test subjects. The linear regression by respirator resulted in R2 = 0.95, indicating a strong linear correlation between FF and MFF. For all respirators the geometric mean (GM) FF values were consistently higher than those of the GM MFF. For 50% of respirators, GM FF and GM MFF values were significantly different between humans and the StAH. For data grouped by subject/respirator combinations, the linear regression resulted in R2 = 0.49. A weaker correlation (R2 = 0.11) was found using only data paired by subject/respirator combination where both the test subject and StAH had passed a real-time leak check before performing the fit evaluation. For six respirators, the difference in passing rates between the StAH and humans was < 20%, while two respirators showed a difference of 29% and 43%. For data by test subject, GM FF and GM MFF values were significantly different for 40% of the subjects. Overall, the advanced headform system has potential for assessing fit for some N95 FFR model/sizes.
Keywords: advanced headform, filtering facepiece respirator, fit test, N95
INTRODUCTION
National Institute for Occupational Safety and Health (NIOSH)-certified N95 filtering facepiece respirators (FFRs) are widely used to reduce exposure of non-oil hazardous airborne particulates, including inert aerosols (such as dusts and mists) in industrial settings and biological aerosols (such as influenza and Mycobacterium tuberculosis) in health-care settings(1,2) Particle infiltration into a respirator facepiece has been described as a combination of leakage through 1) the face seal, 2) the filter element, 3) exhalation valves (for FFRs equipped with them), and 4) other sites (e.g., areas where head straps are connected to the FFR by staples, stitching, and so on) (3); however, facepiece fit has been described as the major contributor to particle infiltration. (4,5)
The U.S. Occupational Safety and Health Administration (OSHA) Respiratory Protection Standard 29 CFR 1910.134 requires every worker who wears a tight-fitting respirator, including FFRs, to undergo a respirator fit test. (6) For a quantitative measure of respirator fit, the ratio of the concentration of a test agent outside (Cout) and inside (Cin) the respirator (Cout/Cin) is called the fit factor. Traditional fit testing of FFRs on people is limited to utilizing non-toxic inert aerosols such as sodium chloride (NaCl) because the utilization of actual health-related airborne particles (such as combustion aerosol or biological pathogens) would impart significant health risks and thus be unquestionably unethical. To better understand respirator fit utilizing actual health-related aerosols, advanced respirator fit test headforms of defined anthropometric size, skin material type, and localized thickness were developed. (7,8)
A Static (i.e., not moving, not talking) Advanced Headform (StAH) was recently developed by NIOSH and was shown to be capable of achieving overall test manikin fit factors (MFF) ≥ 100 for eight N95 FFR models. (7) The long-term goal of developing the StAH is to provide a surrogate for human test subjects in testing respirators when challenged with toxic/hazardous aerosols. The objective of this study was to assess the utility of the StAH as a surrogate for human test subjects by comparing quantitative measures of respirator fit between human subjects and the StAH.
METHODS
Materials and Experimental Equipment
Eight NIOSH-certified N95 FFRs were chosen with a variety of sizes and shapes (i.e., cup, tri-fold and duckbill) (Table I). One model (1870, 3M, St. Paul, MN) is available in only one size. The other models manufactured by Kimberly-Clark, Moldex-Metric, Inc., and Sperian Respiratory Protection, LLC were available in multiple sizes. For the presentation of results in this article, we randomized and anonymously coded the eight different respirator model/size variations as “Respirator A” – “Respirator H,” thus the alphabetical code designation of each respirator does not necessarily correspond to the order in the list in Table I. This selection of respirators was anticipated to produce a wide range of fit evaluation results that would be necessary for comparing the human subjects and StAH. A Breathing Recording System (BRS) (Koken Ltd., Japan) was used to record test subject breathing patterns. The BRS is an elastomeric half-mask respirator fitted with an N95-rated filter cartridge and incorporates a pressure sensor to digitally log changes of in-facepiece pressure as a subject inhales and exhales. Data from the BRS were later downloaded to a computer used to control a Koken Ltd. breathing simulator to reproduce the recorded breathing pattern on the StAH. The StAH is of the “Medium” size defined by the NIOSH Principal Component Analysis (PCA) panel. (7,9) The StAH incorporates a silicone elastomer skin with defined tissue depth at specified facial landmarks.(7) The experimental setup for testing the StAH is shown in Figure 1.
TABLE I.
N95 FFR Characteristics
| Respirator | Size | Shape | ApprovalsA |
|---|---|---|---|
| 3M 1870 | Standard (one size only) | Tri-fold | NIOSH and FDA |
| Kimberly Clark PFR95-270 (46767) | Regular | Duckbill | NIOSH and FDA |
| Kimberly Clark PFR95-270 (46867) | Small | ||
| Moldex 1511 | Small | Cup | NIOSH and FDA |
| Moldex 1512 | Medium | ||
| Moldex 1513 | Large | ||
| Sperian N1105-SAF-T-FIT | Medium/Large | Cup | NIOSH |
| Sperian N1105-SAF-T-FIT | Small |
“NIOSH” means certified by NIOSH under 42 CFR Part 84. “FDA” means cleared by the U.S. Food and Drug Administration for sale as a medical device under Section 510(k) of the U.S. Food, Drug and Cosmetic Act.
FIGURE 1. Experimental setup for fit evaluation of the static advanced headform.
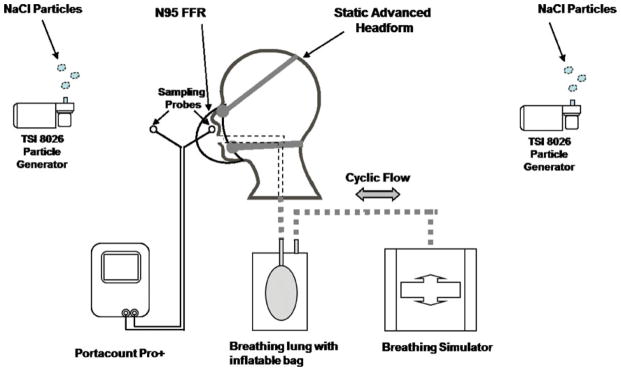
Note: The headform was not enclosed in a test chamber; all test equipment was set up on a laboratory bench top.
All fit evaluations were conducted using a TSI PortaCount Pro+ (Model: 8038, TSI Inc., Shoreview, MN) operated in “N95 Enabled” test mode. A modified version of FitPlus (computer software developed by TSI, Inc.) with the capability of recording fit factors > 200 automated the data collection. Respirators were probed with the standard flush probe recommended by TSI, Inc. All laboratory equipment was placed on a laboratory bench top and a test chamber was not used for either the human subject or StAH testing. For both human and StAH tests, NaCl aerosol was generated using two particle generators (Model: 8026, TSI, Inc.) to supplement the ambient room aerosol concentration. For 437 tests (including both human and StAH tests), the ambient particle concentration measured by the PortaCount in “N95 Enabled” test mode” was: mean = 1383 particles/cm3, standard deviation = 436 particles/cm3, minimum = 570 particles/cm3, maximum = 2805 particles/cm3; the ambient concentration was not recorded for five other tests due to an error in selection of software settings for those tests.
Respirator Fit Evaluation
Ten subjects participated in the study. The sample size was determined by first estimating a Pearson product-moment correlation coefficient (r) of 0.5 to assume a moderate correlation. An alpha level (α) of 0.05 was selected to test against the null hypothesis that there is no correlation between human subject overall test fit factor (FF) and headform overall test manikin fit factor (MFF) (i.e., r = 0). In this manuscript we italicized FF and MFF to emphasize that these results are “overall” test results and not the results from individual fit test exercises. The calculation showed that selecting 10 subjects would result in a power of 0.90, which is higher than our targeted minimum power of 0.80.
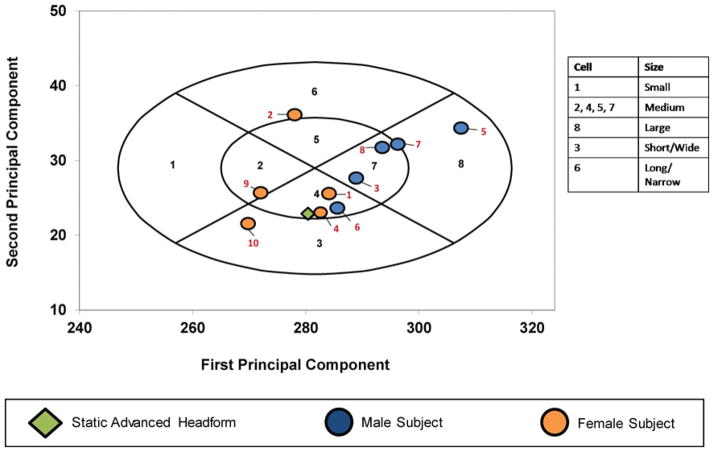
The study protocol was approved by the NIOSH Institutional Review Board. Prior to the study, all subjects were medically cleared and written informed consent was obtained from each. The intent of the study was to recruit 10 subjects meeting the “Medium” size classification of the NIOSH PCA Panel. (9) Five men aged 23–63 and five women aged 22–54 participated in the study. Nine of the 10 subjects had participated in previous fit test studies. Ten traditional anthropometric dimensions were measured on subjects to classify their head/facial size according to criteria specified by the NIOSH PCA Panel. (9). Seven of the 10 subjects were classified as “Medium” (Figure 2, panel cells 2, 4, 5, and 7). One subject, classified as “Long/Narrow” (panel cell 6), bordered on panel cell 5 of the “Medium” size. One subject was classified as “Short/Wide” (panel cell 3), and one subject was classified as “Large” (panel cell 8).
FIGURE 2. Distribution of test subjects in the NIOSH principal component analysis panel.
Numerals in black font indicate PCA panel number. Numerals in red font indicate test subject number.
Each participant was trained by the test technicians on proper donning and user seal check techniques. Male test subjects were instructed to arrive at the lab “clean shaven” for testing. Subjects were also asked to refrain from smoking for 60 min prior to their fit test appointment. As this study was designed to evaluate a “static” (not talking, not moving) headform, test subjects performed only “Normal Breathing” and “Deep Breathing” exercises for respirator fit evaluations. Subjects made three visits to the laboratory. At the start of each visit, breathing patterns were recoded for a 6-minute sequence comprising three two-minute exercises performed in sequence: “Normal Breathing,” “Deep Breathing,” and again “Normal Breathing.” Next, subjects donned a respirator for the fit evaluation. One fit evaluation was performed with each of the eight respirator model/size variations in a predetermined randomized order.
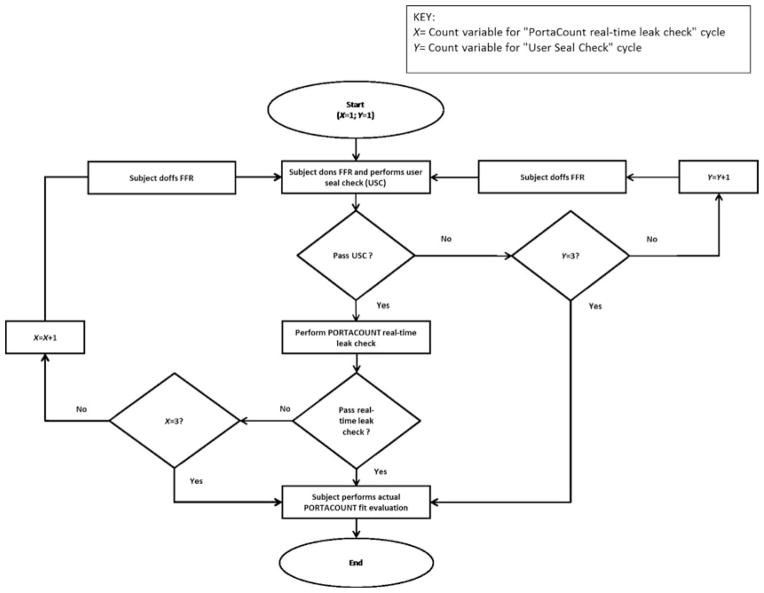
After donning the respirator, each subject began a sequence of user seal checks (USC) and real-time leak checks using the PortaCount (Figure 3). The purpose for performing the USC was to attempt to obtain an initial adequate faceseal. Attempts to pass a USC were performed first. Although respirator manufacturers’ instructions for performing USCs vary slightly among respirator models, for most respirators without an exhalation valve, a wearer performs a USC by inhaling and/or exhaling forcefully while cupping both hands over the entire filtering facepiece. While performing the inhalation and exhalation, the subject simultaneously assessed if air could be felt leaking around the respirator’s faceseal area. If no air leakage was detected, the USC was considered a “Pass”; if air leakage was detected, the USC was considered a “Fail” and the subject then doffed the respirator and redonned it for a second attempt. The subject was given three attempts to pass the USC. Because the respirators were of a variety of shapes and sizes, it was expected that not all subjects would pass the USC in three attempts. If the USC was not passed in the three attempts, the three-exercise PortaCount fit evaluation for FF was then performed.
FIGURE 3. Test subject User Seal Check (USC) / real-time leak check flow chart.
Following a USC deemed a “Pass,” the PortaCount in real-time fit factor mode was used to perform a real-time leak check of the respirator worn by the subject. In real-time mode, a fit factor is displayed by the PortaCount numerically and graphically approximately every second. For the purposes of this study, passing this check required that the PortaCount display 10 consecutive real-time fit factors of ≤100. The 10 consecutive fit factors are displayed during a single respirator donning over a period of approximately 10 sec. The purpose of the real-time leak check was to establish a procedure that both the human subjects and the StAH could attempt up to three times to achieve a good initial faceseal prior to beginning the actual three-exercise test for FF (for test subjects) or MFF (for the StAH). It was expected that some test subject/respirator combinations and StAH/respirator combinations would not pass the real-time leak check due to the variety of respirator shapes and sizes. A similar real-time leak check was used in our previous StAH study and was shown to be beneficial for achieving a good respirator fit on the StAH. (7) If the subject met the real-time leak check criterion, the check was considered a “Pass” and the actual fit evaluation for FF began. If the real-time leak check criterion was not met, the check was considered a “Fail” and the subject doffed the respirator, redonned it, and repeated the USC step. The subject was given three attempts to pass the real-time leak check; after the third attempt—pass or fail—the actual three-exercise fit evaluation for FF was then performed.
Each fit evaluation for FF comprised three two-minute exercises performed in sequence: “Normal Breathing,” “Deep Breathing,” and again “Normal Breathing.” The resulting overall test FF was calculated by the PortaCount software as the harmonic mean of the three individual fit factor results from the three individual exercises. The data collection goal for all test subjects combined was 240 fit evaluations (10 subjects × 3 visits × 8 respirator model/size variations); however, only 221 fit evaluations were collected because two subjects did not perform their third visit and one subject could not wear one respirator size for all three visits due to reported discomfort from the tight fit.
Following each subject visit, the same eight respirators were mounted on the StAH, and eight fit evaluations (one evaluation per respirator) for MFF (having the same three-exercise sequence for each) were performed utilizing the test subject’s recorded breathing pattern data, which was replicated by the Koken Ltd. breathing simulator. Respirator samples were mounted on the StAH by the test operator with attention to correct strap placement, centering the respirator on the StAH’s face, and adjusting the nose clip (if equipped). Because the USC procedure cannot be performed by the StAH (as the USC is a qualitative assessment of respirator leakage performed by a person), each respirator sample mounted on the StAH underwent only the PortaCount real-time leak check procedure. Three attempts were allowed to pass the criterion before beginning the actual fit evaluation for MFF (i.e., the three-exercise test). If the real-time leak check criterion was not met after three attempts (doffing and redonning the respirator for successive attempts), the actual fit evaluation for MFF began after the third attempt.
Data Analysis
Data analysis was conducted using Statistical Analysis System (SAS) version 9.3 (SAS Institute, Inc., Cary, NC). Normality tests were performed on the FF and MFF data grouped by respirator and test type (human or StAH); grouping the data in this way resulted in eight data sets for humans and eight data sets for the StAH. The normality tests showed that only one of the 16 data sets was normally distributed. When the data were log10-transformed and normality tests were rerun, four of the eight human data sets were log-normally distributed and three of the eight StAH data sets were log-normally distributed. Although not all the data sets were found to be log-normally distributed, we chose to perform Analysis of Variance (ANOVA) tests on the data following log10-transformation because the number of observations in each data set was sufficiently large (≥ 25).
Geometric means (GM) and geometric standard deviations (GSD) for FF and MFF were calculated using the log10-transformed data. For each respirator model/size variation, log10-transformed FF and MFF values were compared by ANOVA. Additionally, log10-transformed FF and MFF values from all respirators combined were analyzed by test subject using ANOVA. For all ANOVA tests, P-values < 0.05 were considered statistically significant. A linear regression of mean log10-transformed FF and mean log10-transformed MFF values for all eight respirators was performed. Another linear regression of mean log10-transformed FF and mean log10- transformed MFF values was performed by grouping the data by test subject and model/size variation.
Passing rates (% of FF or MFF ≥ 100) were calculated for each respirator. Additionally, passing rates were calculated for each test subject using the combined data from tests on all respirators. Even though the protocol used was not designed to be equivalent to the standard OSHA-accepted protocol, the same pass/fail criterion of 100 was used. (6) The passing rate results therefore must not be interpreted as being equivalent to results obtained from a standard OSHA-accepted PortaCount fit test protocol.
RESULTS
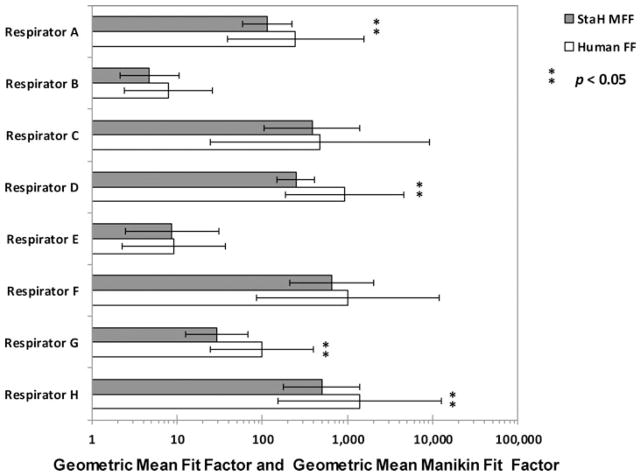
The lowest GM results for both the StAH and human subjects were observed for Respirator B (GM MFF = 4, GSD = 2.2; and GM FF = 7, GSD = 3.3, for the StAH and human subjects, respectively) ( Figure 4). The highest results were obtained for the StAH when testing Respirator F (GM MFF = 656, GSD = 3.1), and for humans when testing Respirator H (GM FF = 1400, GSD = 9.1). The GSD values for the StAH were lower than GSD values for test subjects for every model/size variation, indicating that more consistent donnings were observed for the StAH. A possible contributing factor for the more consistent fit evaluation results observed for the headform could be that only one test operator donned all of the respirators on the headform. ANOVA results showed that four respirator model/size variations (Respirators A, D, G, and H) produced significantly (P < 0.05) lower results for the StAH (GM MFF) than for the human subjects (GM FF). The same ANOVA analysis was conducted excluding the three test subjects who were sizes “Large,” “Long/Narrow,” and “Short/Wide” so that only the remaining seven “Medium”-size subjects would be compared with the StAH (which is “Medium”-size); however, even after excluding these subjects only Respirators A, D, G, and H continued to have statistically different results between the StAH and the test subjects.
FIGURE 4. Geometric mean (GM) fit factor (FF) and GM manikin fit factor (MFF) data by respirator.
Note: The bars represent geometric means and show one geometric standard deviation from the mean. (Sample size of fit evaluation tests: n = 25 for Respirator H, and n = 28 for the other seven respirators).
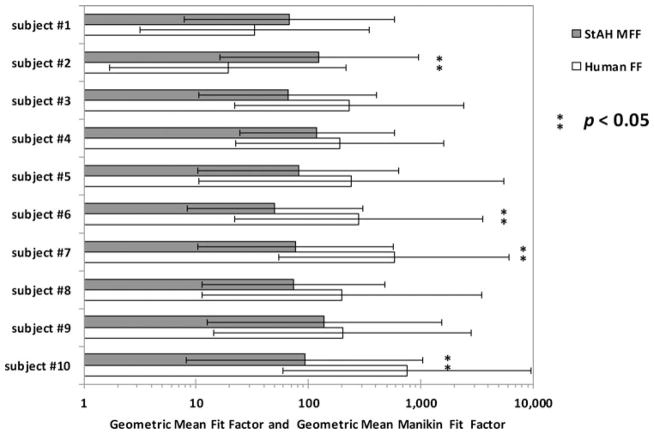
Analyzing results by test subject showed that GM FF and GM MFF were statistically different for four of the 10 subjects (Figure 5). It is interesting to note that two of these four subjects were PCA sizes other than “Medium” (subject #2 was “Long/Narrow” and subject #10 was “Short/Wide”), although it is unknown to what degree PCA panel size influenced their FF results. Human GM FF was greater than StAH GM MFF for eight of the ten subjects. Only subjects #1 and #2 had higher GM MFF results compared with GM FF results (Figure 5). We are not able to ascertain the reason for these results. Both subjects were experienced test subjects. Subject #1 was “Medium” size and subject #2 was “Long/Narrow,” although it is unknown how panel size influenced fit due to the small number of subjects in the study.
FIGURE 5. Geometric mean (GM) fit factor (FF) and GM manikin fit factor (MFF) data by test subject.
Note: The bars represent geometric means and show one geometric standard deviation from the mean. (Sample size of fit evaluation tests: n = 16 for subjects #3 and #6, n = 21 for subject #5, and n = 24 for all other subjects). Each bar contains the data from all respirators combined.
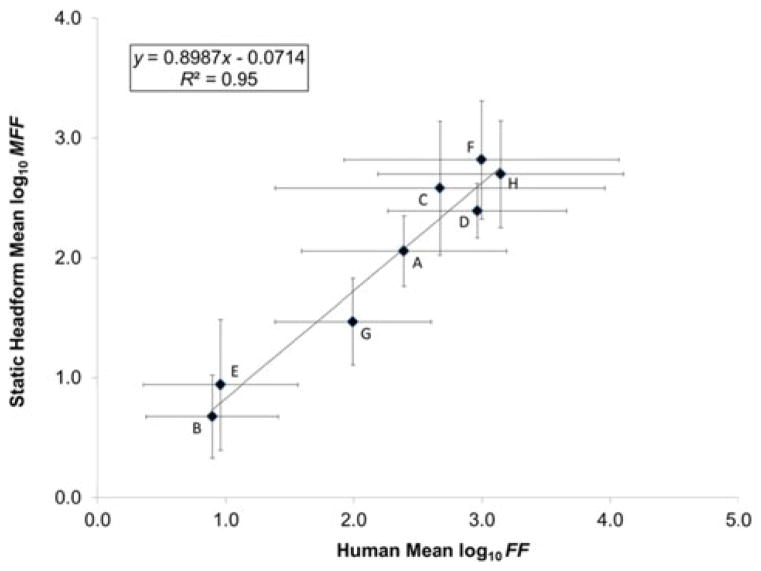
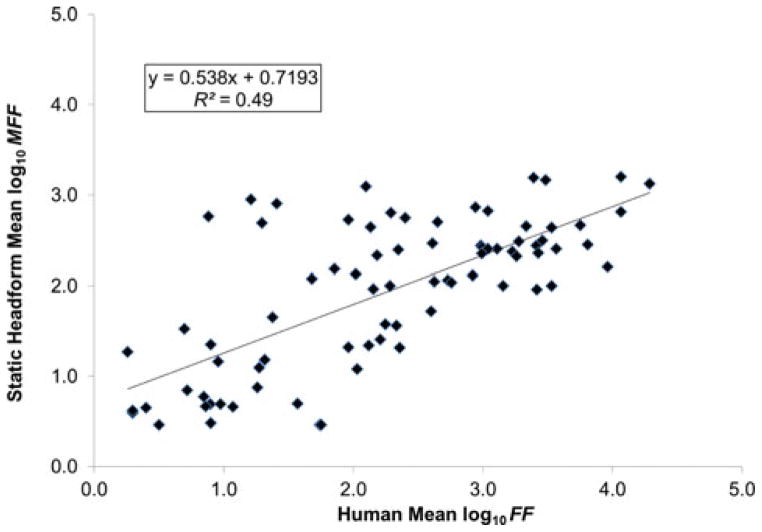
The linear regression on mean log10-transformed FF and mean log10-transformed MFF values for the eight respirators resulted in R2 = 0.95, indicating a very strong linear relationship between the human subjects tested and the StAH (Figure 6). The StAH had lower values than humans, which is reflected by the slope (0.8987 (< 1)). Overall, the regression model suggests that the mean StAH MFF values have potential for predicting mean FF values for a group of human subjects. The same regression run with data from only the seven “Medium”-size subjects resulted in a R2 = 0.92, suggesting that the three subjects whose head sizes were other than “Medium” did not substantially impact the original regression results. The linear regression of mean log10-transformed FF and mean log10-transformed MFF values performed by grouping the data by test subject and model/size variation resulted in a weaker correlation (R2 = 0.49) (Figure 7). An even weaker correlation (R2 = 0.11) was found when including only data pairs by respirator model/size variation and subject (n = 48 pairs) where both the test subject and StAH passed the real-time leak check using the Porta-Count; other studies performing regression on fit test data using only passing data (fit factors ≥ 100) have found weak correlations(10,11).
FIGURE 6. Correlation of Human Mean Log10 Fit Factor (FF) and Static Headform Mean Log10 Manikin Fit Factor (MFF).
Note: Letters indicate different respirator model/size variations. Sample size of fit evaluations: n = 25 for Respirator H, and n = 28 for all other respirators. One standard deviation from the mean is shown.
FIGURE 7. Correlation of Human Mean Log10 Fit Factor (FF) and Static Headform Mean Log10 Manikin Fit Factor (MFF) by test subject and respirator.
Note: Seventy-five data points are plotted. Each data point represents data from one test subject and one respirator model/size variation.
Passing rates by respirator ranged from 3.6–96.4% for human testing and 0–100% for StAH testing (Table II). For six of the eight respirators, the difference in passing rates was < 20%. The StAH achieved the same passing rates as the human subjects when tested with Respirator D (Passing = 96.4%) and Respirator E (Passing = 3.6%), indicating that the StAH has potential for accurately assessing the passing rate for human subjects for at least some respirator models. Passing rates by test subject utilizing data from all eight respirators ranged from 25.0–75.0% for human testing and 43.8–62.5% for StAH testing (Table III). For seven of the ten subjects, the difference in passing rates was < 20%. Two test subjects (#5 and #9) achieved the same passing rates as the StAH (57.1% and 62.5%, respectively).
TABLE II.
Passing Rate Difference Between Human Fit Factor (FF) and Static Headform Manikin Fit Factor (MFF) by Respirator
| Respirator | Total Tests (n) | Test Type | Fail (n) | Pass (n) | Pass (%) A | Pass Rate Difference (%) B |
|---|---|---|---|---|---|---|
| A | 28 | Human FF | 5 | 23 | 82.1 | 17.9 |
| 28 | StAH MFF | 10 | 18 | 64.3 | ||
| B | 28 | Human FF | 27 | 1 | 3.6 | 3.6 |
| 28 | StAH MFF | 28 | 0 | 0.0 | ||
| C | 28 | Human FF | 11 | 17 | 60.7 | −28.6 |
| 28 | StAH MFF | 3 | 25 | 89.3 | ||
| D | 28 | Human FF | 1 | 27 | 96.4 | 0.0 |
| 28 | StAH MFF | 1 | 27 | 96.4 | ||
| E | 28 | Human FF | 27 | 1 | 3.6 | 0.0 |
| 28 | StAH MFF | 27 | 1 | 3.6 | ||
| F | 28 | Human FF | 5 | 23 | 82.1 | −7.1 |
| 28 | StAH MFF | 3 | 25 | 89.3 | ||
| G | 28 | Human FF | 12 | 16 | 57.1 | 42.9 |
| 28 | StAH MFF | 24 | 4 | 14.3 | ||
| H | 25 | Human FF | 3 | 22 | 88.0 | −12.0 |
| 25 | StAH MFF | 0 | 25 | 100.0 |
Passing criterion is FF or MFF result ≥ 100. Pass (%) = Pass (n) / Total tests (n) × 100%.
Pass rate difference (%) = Human FF Pass (%) – StAH MFF Pass (%).
TABLE III.
Passing Rate Difference Between Human Fit Factor (FF) and Static Headform Manikin Fit Factor (MFF) by Test Subject
| Subject ID | Total Tests (n) | Test Type | Fail (n) | Pass (n) | Pass (%)A | Pass Rate Difference (%)B |
|---|---|---|---|---|---|---|
| 1 | 24 | Human FF | 15 | 9 | 37.5 | −12.5 |
| 24 | StAH MFF | 12 | 12 | 50.0 | ||
| 2 | 24 | Human FF | 18 | 6 | 25.0 | −37.5 |
| 24 | StAH MFF | 9 | 15 | 62.5 | ||
| 3 | 16 | Human FF | 5 | 11 | 68.8 | 18.8 |
| 16 | StAH MFF | 8 | 8 | 50.0 | ||
| 4 | 24 | Human FF | 8 | 16 | 66.7 | 4.2 |
| 24 | StAH MFF | 9 | 15 | 62.5 | ||
| 5 | 21 | Human FF | 9 | 12 | 57.1 | 0.0 |
| 21 | StAH MFF | 9 | 12 | 57.1 | ||
| 6 | 16 | Human FF | 5 | 11 | 68.8 | 25.0 |
| 16 | StAH MFF | 9 | 7 | 43.8 | ||
| 7 | 24 | Human FF | 7 | 17 | 70.8 | 16.7 |
| 24 | StAH MFF | 11 | 13 | 54.2 | ||
| 8 | 24 | Human FF | 9 | 15 | 62.5 | 8.3 |
| 24 | StAH MFF | 11 | 13 | 54.2 | ||
| 9 | 24 | Human FF | 9 | 15 | 62.5 | 0.0 |
| 24 | StAH MFF | 9 | 15 | 62.5 | ||
| 10 | 24 | Human FF | 6 | 18 | 75.0 | 12.5 |
| 24 | StAH MFF | 9 | 15 | 62.5 |
Passing criterion is FF or MFF result ≥ 100. Pass (%) = Pass (n) / Total tests (n) x 100%.
Pass rate difference (%) = Human FF Pass (%) – StAH MFF Pass (%).
DISCUSSION AND PRACTICAL IMPLICATIONS
In the analysis by respirator, all GM fit evaluation results for the StAH were lower than those for the human subjects (Figure 4). Similarly, an analysis of the data by all tests performed by test subject found that GM FFs were greater than GM MFFs for eight of the ten subjects (Figure 5). There are several possible contributing factors for these observations. All respirator samples were first tested on human test subjects and later tested on the StAH; thus, respirator headstrap tension may have degraded slightly during the human testing and may have resulted in a poorer fit for StAH testing. Although degradation in headstrap force is not well characterized for people donning and doffing respirators over multiple donnings, a recent study simulating the degradation of headstrap force over multiple stretches and relaxation periods using an electromechanical tensometer showed a significant reduction in force over the multiple cycles (P = <0.001), with the greatest reduction following the first cycle. (12) In our current study, the human subjects also had the advantage of performing the qualitative USC assessment (they could feel the air leakage of a poor donning and accordingly initiate a better donning), whereas no such qualitative assessment was possible with the StAH.
The StAH testing in this study was limited to a single headform. Although the StAH tested is the first physical model to be produced, the possibility exists for slight differences (whether in anthropometric dimensions or properties of the skin) in future headform production models. This study included seven “Medium”-size subjects and three subjects who were other than “Medium”-size. Although removing these three subjects from the analyses slightly lowered the regression R2 result, including a larger sample of subjects of other than “Medium” sizes could begin to explain how these sizes may affect the regression. The use of only two breathing exercises (normal and deep breathing) differs from the standard OSHA-accepted PortaCount fit test, which also includes dynamic head movements and a speaking passage (6); thus, results from this study cannot be directly translated to using the standard OSHA-accepted test. Articulated advanced headforms capable of performing head movement and the mouth/jaw movements of speech are needed for future research to better simulate human exercises; preliminary work in this area is underway at NIOSH.
This is the first study to report a positive correlation of N95 filtering facepiece respirator fit between a headform and a group of human test subjects. A strong correlation, R2 = 0.95, was found between the human subjects and the “Medium-size StAH when the mean fit evaluation results of all eight respirator model/size variations were included in the regression model. Overall, the advanced headform system has potential for assessing fit for at least some different N95 FFR model/size variations. Further research is needed to better understand fit evaluation differences between humans and newly developed advanced headforms.
Acknowledgments
We wish to thank Andrew Viner and Craig Colton of 3M, Inc. and David Hanson of Hanson Robotics, Inc. for informative discussions on the subject matter.
FUNDING
This research was funded by the U.S. Department of Health and Human Services (HHS), the Office of Assistant Secretary for Preparedness and Response, Biomedical Advanced Research and Development Authority (BARDA) through an interagency agreement with the Air Force Research Laboratory (AFRL).
Footnotes
DISCLAIMER
The findings and conclusions in this report are those of the authors and do not necessarily represent the views of the HHS, BARDA, NIOSH, Air Force Civil Engineer Center (AFCEC). or AFRL. Mention of company names or products does not constitute endorsement by HHS, BARDA, NIOSH, AFCEC, or AFRL.
References
- 1.Bureau of Labor Statistics (BLS) and National Institute for Occupational Safety and Health (NIOSH) Respirator Usage in Private Sector Firms, 2001. Washington, DC: U.S. Departiment of Labor/BLS and U.S. Departiment of Health and Human Services/Centers for Disease Control and Prevention/NIOSH; 2003. [Google Scholar]
- 2.National Institute for Occupational Safety and Health (NIOSH) NIOSH Guide to the Selection and Use of Particulate Respirators Certified under 42 CFR 84. Cincinnati, OH: NIOSH; 1996. DHHS (NIOSH) Publication No. 96–101. [Google Scholar]
- 3.Han DH, Lee J. Evaluation of particulate filtering respirators using inward leakage (IL) or total inward leakage (TIL) testing - Korean experience. Ann Occup Hyg. 2005;49(7):569–574. doi: 10.1093/annhyg/mei034. [DOI] [PubMed] [Google Scholar]
- 4.Clayton M, Vaughan N. Fit for purpose? The role of fit testing in respiratory protection. Ann Occup Hyg. 2005;49(7):545–548. doi: 10.1093/annhyg/mei046. [DOI] [PubMed] [Google Scholar]
- 5.Grinshpun SA, Haruta H, Eninger RM, et al. Performance of an N95 filtering facepiece particulate respirator and a surgical mask during human breathing: Two pathways for particle penetration. J Occup Environ Hyg. 2009;6(10):593–603. doi: 10.1080/15459620903120086. [DOI] [PMC free article] [PubMed] [Google Scholar]
- 6.Respiratory Protection: Final Rule. Federal Register 63. 1998 Jan 08;:1152–1300. [PubMed] [Google Scholar]
- 7.Bergman M, Zhuang Z, Wander J, et al. Development of an Advanced Respirator Fit Test Headform. J Occup Environ Hyg. 2014;11:117–125. doi: 10.1080/15459624.2013.816434. [DOI] [PMC free article] [PubMed] [Google Scholar]
- 8.Hanson D, Margolin R, editors. U.S. Department of Defense. Human Articulated Robotic Headform to Replace Human Volunteers in Respirator Fit Testing. Air Force Research Laboratory, Materials and Manufacturing Directorate, Tyndall Air Force Base; Dec, 2012. Report No. AFRL-RX-TY-TR-2012-0073-01. [Google Scholar]
- 9.Zhuang Z, Bradtmiller B, Shaffer RE. New respirator fit test panels representing the current US civilian work force. J Occup Environ Hyg. 2007;4(9):647–659. doi: 10.1080/15459620701497538. [DOI] [PubMed] [Google Scholar]
- 10.Coffey CC, Campbell DL, Myers WR, et al. Comparison of six respirator fit test methods with an actual measurement of exposure in a simulated health care environment: Part II - Method comparison testing. Am Ind Hyg Assoc J. 1998;59(12):862–870. doi: 10.1080/15428119891011036. [DOI] [PubMed] [Google Scholar]
- 11.Zhuang Z, Coffey CC, Jensen PA, et al. Correlation between quantitative fit factors and workplace protection factors measured in actual workplace environments at a steel foundry. Am Ind Hyg Assoc J. 2003;64(6):730–738. doi: 10.1202/475.1. [DOI] [PubMed] [Google Scholar]
- 12.Roberge R, Niezgoda G, Benson S. Analysis of forces generated by N95 filtering facepiece respirator tethering devices: A pilot study. J Occup Environ Hyg. 2012;9(8):517–523. doi: 10.1080/15459624.2012.695962. [DOI] [PubMed] [Google Scholar]


