

Abstract
Objective
Renal hypoxia has been proposed to be a pathophysiologic feature of diabetic kidney disease but it has been difficult to demonstrate in vivo, particularly in mouse models of diabetes. The objective of this work was to examine the sensitivity of blood oxygen level-dependent (BOLD) magnetic resonance imaging (MRI) to assess renal oxygenation in vivo in a mouse model of diabetic kidney disease, the db/db mice.
Research Design and Methods
Kidney BOLD MRI studies were performed on a 3.0 T scanner using multiple gradient echo sequence with a custom-designed surface coil to acquire T2*-weighted images. Studies were performed in 10-week-old db/db mice (n = 7) and db/m controls (n = 6).
Results
R2* is a measure of the tissue deoxyhemoglobin concentration and higher values of R2* are associated with hypoxia. The db/db mice had higher medullary (43.1 ± 5.1 s−1 vs. 32.3 ± 3.7 s−1, P = 0.001) and cortical R2* (31.7 ± 3.1 s−1 vs. 27.1 ± 4.1 s−1, P = 0.04) values. Using pimonidazole staining as a marker of kidney hypoxia, in kidney sections from 10-week-old db/db mice neither cortex nor medulla had significant differences as compared with 10-week-old db/m mice (cortex: db/db 2.14 ± 0.05 vs. db/m 2.02 ± 0.28, medulla: db/db 2.81 ± 0.08 vs. db/m 2.6 ± 0.08). The db/db mice demonstrated further increased cortical and medullary hypoxia when scanned again at 15 weeks of age.
Conclusions
The report shows that renal BOLD MRI is a sensitive method for the in vivo evaluation of renal hypoxia in a mouse model of diabetic kidney disease where progressive renal hypoxia can be documented over time. BOLD MRI may be useful to monitor therapeutic interventions that may improve tissue hypoxia in the diabetic kidney.
Keywords: mice, renal medulla, hypoxia, BOLD MRI, type 2 diabetes, 3.0 T
Diabetic nephropathy is the leading cause of end-stage renal failure and a challenge for investigators trying to integrate large amount of genetic and molecular findings from rodent models and search for markers of kidney disease.1–4 Mouse is a valuable model for the study of genetic aspects of mammalian diseases and to correlate them with phenotypic features.5 However, imaging studies to assess kidney function have been challenging because of the small size of these species.
Hypoxia has been proposed as a pathophysiologic feature of chronic kidney disease and its progression.6–8 Among the techniques available to evaluate intrarenal oxygenation, blood oxygen level-dependent (BOLD) magnetic resonance (MR) imaging is currently the only noninvasive method that can be readily used in vivo in animal models as well as humans.9–17
BOLD MRI technique exploits the fact that the magnetic properties of hemoglobin vary depending on whether it is in the oxygenated or deoxygenated form. This affects the T2* relaxation time of the neighboring water molecules, and in turn, influences the MRI signal on T2*-weighted images. Because the ratio of oxyhemoglobin to deoxyhemoglobin is related to the pO2 of blood, and as the pO2 of capillary blood is thought to be in equilibrium with the surrounding tissue, changes estimated by BOLD MRI can be interpreted as changes in tissue pO2.9–15
BOLD MRI studies in streptozotocin-induced rat model of type I diabetes have shown increased levels of medullary hypoxia.10 The goal of the present study was to evaluate renal oxygenation in a mouse model of diabetic kidney disease. We choose the db/db mice because it is a widely used model that resembles type 2 diabetes.18–20 These mice have a mutation in the LepR gene, which leads to obesity and diabetes.21 These transgenic mice show signs of diabetes as early as 4 to 6 weeks of age and an increase in albumin excretion by 10 weeks of age.18–20,22 Histologic evidence of glomerular damage is apparent by 14 to 15 weeks of age.18,20 The sensitivity of BOLD MRI to detect renal hypoxia was further assessed by comparing it to studies using pimonidazole, a dye used to examine tissue hypoxia in kidney sections.
Materials and Methods
BOLD MRI studies were performed in 7 male C57BLKS/J (db/db) mice (46.6 ± 1.1 g, Jackson Laboratory, Bar Harbor, ME) and 6 of their healthy littermates (db/m, 26.3 ± 1.5 g) of 10.7 weeks of age. Six of the db/db mice were rescanned at 15 weeks of age (50.5 ± 2.2 g). The study protocol was approved by the institutional animal care and use committee. The animals were anesthetized intraperitoneally with ketamine (100 mg/kg; Abbott Laboratories, North Chicago, IL).
Imaging was performed on a 3.0 T Twin Speed whole body scanner (General Electric Medical Systems, Milwaukee, WI) with a custom-designed 2.0-cm surface coil to receive the MR signal. A multiple gradient-recalled echo sequence (repetition time/echo time/ flip angle/bandwidth=101.5 milliseconds/6.3–32 milliseconds/30°/ 31.25 kHz) was applied to acquire 6 T2* weighted images at an in-plane resolution of 156 × 156 μm.20 The field of view was 4 cm, with a matrix size of 256 by 256 and 0.5-mm slice thickness. Because of the small voxel size, and to minimize motion artifacts from breathing, the signal was averaged over 4 repetitions. The mice were placed in a supine position above the coil with 4 paws taped to the pad. Given the size of the coil, only one kidney was routinely covered. Based on scout images, one axial slice was selected in the middle of the kidney for BOLD MRI data acquisition. The signal intensity versus echo time data were fit to a single decaying exponential function to determine the value of R2* (= 1/T2*), which was used as a semi-quantitative measure of relative tissue oxygenation. An increase in R2* indicates a decrease in tissue pO2.9–15 R2*maps were generated from the T2*-weighted images using the Functool feature on the Advanced Workstation 4.0 (GE, Milwaukee, WI). Regions of interest were drawn over the renal cortex and outer medulla (OM) similar to a previous report.13
The mean and standard deviation of R2* in the 2 renal regions were recorded. As an independent measure of hypoxia, we performed pimonidazole staining in a separate group of animals of 10 to 11weeks of age. Pimonidazole (Natural Pharmacia Inc, Burlington, MA) was administered via intraperitoneal injection. Five db/m and 4 db/db mice were killed after 1.5-hour pimonidazole (60 mg/kg) administration. Perfusion (3% paraformaldehyde) fixed kidneys were cut into 4-μm sections and processed for immunostaining with Dako EnVision System-HRP kit (Carpinteria, CA) according to manufacturer's procedure. Briefly, after deparaffinization, antigen retrieval and peroxidase quenching, sections were incubated with protein blocking solution for 20 minutes. The sections were sequentially incubated with a specific rabbit antipimonidazole antibody diluted 1:100 (Natural Pharmacia Inc) for 1 hour, and labeled with polymer-HRP antirabbit secondary antibody. Pimonidazole staining was visualized with DAB chromogen, followed by counterstaining with hematoxylin. Renal hypoxia was evaluated by semi-quantitative determination of pimonidazole staining of tubules in the cortex and medulla. The pimonidazole staining was assessed at 100× magnification using 5 randomly selected fields for each animal by the following criteria according to the following intensity: 1, no staining; 2, moderate; and 3, strong staining.
Results
The total body weight was markedly higher in db/db mice, and all the animals were overtly diabetic with a glucose level above 600 g/dL (Table 1). In 10-week-old db/m control mice (Table 2), R2* was higher in the medulla as compared with the cortex (32.3 ± 3.7 vs. 27.1 ± 4.1, P = 0.003) consistent with the lower level of oxygenation in the medulla.9–15 When comparing db/db mice (Table 1) to db/m (Table 2) mice also of 10 weeks of age, there was a significant difference in cortical R2*(31.7 ± 3.1 vs. 27.1 ± 4.1, P = 0.042) and a much higher difference in medullary R2*(43.1 ± 5.1 vs. 32.3 ± 3.7, P = 0.001). Figure 1 shows representative BOLD MRI images obtained from a db/db mouse and nondiabetic control, a db/m mouse. The brightness on the R2* map reflects the relative oxygenation status of the kidney. The OM of the diabetic kidney is brighter than that of the OM of the control kidney, indicating a decreased tissue oxygenation in the medulla of the diabetic kidney.
Table 1. Summary of BOLD MRI Measurements in db/db at 10.7 Weeks.
| db/db Number | Age (wk) | Weight (g) | Glucose (g/dL) | MR2* (s−1) | CR2* (s−1) |
|---|---|---|---|---|---|
| 1 | 10 | 48 | >600 | 45.1 | 29.4 |
| 2 | 10 | 48 | >600 | 49.5 | 33.9 |
| 3 | 11 | 45 | >600 | 45.2 | 31.6 |
| 4 | 11 | 46 | >600 | 34.7 | 26.3 |
| 5 | 11 | 47 | >600 | 40.7 | 31.3 |
| 6 | 11 | 46 | >600 | 47.0 | 35.4 |
| 7 | 11 | 45.9 | >600 | 39.4 | 34.1 |
| 10.7 ± 0.5 | 46.6 ± 1.1 | 43.1 ± 5.1 | 31.7 ± 3.1 |
R2*: Medullary R2*.
CR2*: Cortical R2*.
Table 2. Summary of BOLD MRI Measurements in db/m at 10.7 Weeks.
| db/m Number | Age (wk) | Weight (g) | Glucose (g/dL) | MR2* (s−1) | CR2* (s−1) |
|---|---|---|---|---|---|
| 1 | 10 | 29 | 131 | 32.1 | 24.8 |
| 2 | 10 | 25 | 163 | 28.1 | 23.8 |
| 3 | 11 | 27 | 218 | 29.4 | 22.4 |
| 4 | 11 | 25.9 | 198 | 30.8 | 29.6 |
| 5 | 11 | 26 | 135 | 37.7 | 32.8 |
| 6 | 11 | 25 | 207 | 35.8 | 29.3 |
| 10.7 ± 0.5 | 26.3 ± 1.5 | 175.3 ± 37.6 | 32.3 ± 3.7 | 27.1 ± 4.1 |
R2*: Medullary R2*.
CR2*: Cortical R2*.
Figure 1.
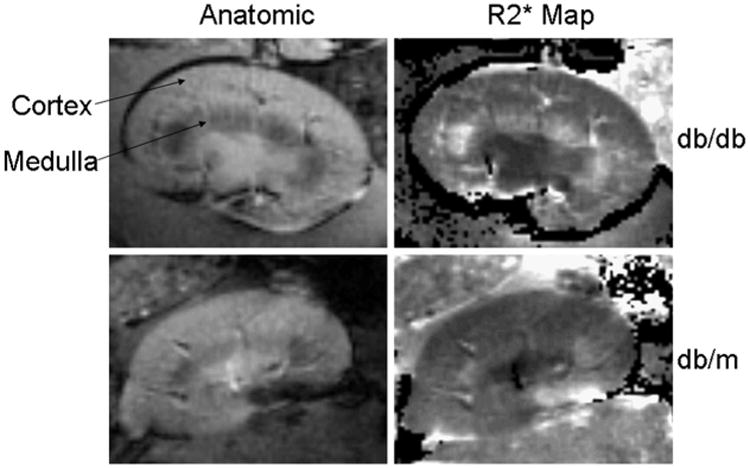
Representative example of BOLD MRI data obtained in a diabetic db/db (upper panels) and a control db/m mouse (lower panels). The brightness on the R2* map reflects the relative oxygenation status of the kidney. The area of brightness in the OM of the db/db diabetic mice (right upper panel) is increased as compared with that of the db/m control mice (left lower panel), indicating a decreased tissue oxygenation.
To examine the status of kidney oxygenation with advanced age and progressive kidney disease, a group of db/db mice was again studied at 15 weeks of age. In 15-week-old diabetic mice cortical R2* was higher than in 10-week-old animals (43.1 ± 4.4 vs. 31.7 ± 3.1, P = 0.02). Likewise medullary R2* was higher at the age of 15 weeks than at the age of 10 weeks (51.7 ± 3.0 vs. 43.1 ± 5.1, P = 0.03).
The results of kidney staining with pimonidazole are shown in Figure 2. Pimonidazole staining was stronger in the medulla than in the cortex both in db/db and db/m mice. The strongest staining was in OM and papilla. Thus, in cortex the staining was decreased as compared with the medulla in both db/m (2.02 ± 0.28 vs. 2.6 ± 0.08, P < 0.05) and db/db (2.14 ± 0.05 vs. 2.81 ± 0.08, P < 0.005). The pimonidazole staining in db/db mice was slightly stronger both in cortex and medulla as compared with db/m mice (cortex, db/db 2.14 ± 0.05 vs. db/m 2.02 ± 0.28, medulla, db/db 2.81 ± 0.08 vs. db/m 2.6 ± 0.08). However, the differences between db/db and db/m were very small and not statistically significant. Figure 3 summarizes the findings comparing BOLD MRI and pimonidazole staining in 10-week-old mice. Decreased oxygenation in both cortex and medulla of the db/db mice is detectable by BOLD MRI whereas pimonidazole staining did not detect hypoxia in these diabetic animals.
Figure 2.
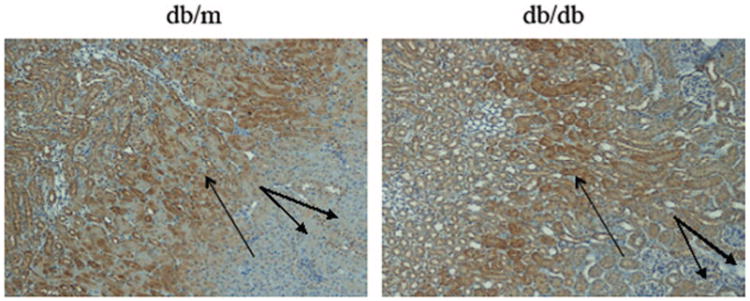
Pimonidazole immunohistochemical staining of the kidney of db/m and db/db mouse. Strong pimonidazole staining of renal tubules was observed mainly in the OM (single arrows) both from db/m and db/db mouse. Weaker staining was seen in the cortex of both db/db and db/m mice (double arrows, 100×).
Figure 3.

A summary of R2* values obtained by BOLD MRI in the medulla and cortex of 10-week-old db/db and db/m mice (upper panel) is shown in the upper panel. R2* is higher in medulla than cortex in both db/db and db/m reflecting lower oxygenation in the medulla. The asterisk denotes a significant difference in R2* between db/db and db/m in both cortex (P < 0.04) and medulla (P < 0.001). The lower panel shows the pimonidazole staining score for db/db and db/m mice of similar age (10 weeks old). The medulla had stronger staining than the cortex in both db/db and db/m reflecting increased hypoxia. No significant differences were found in the pimonidazole staining of the medulla and cortex between db/db and the db/m mice.
Discussion
This report documents for the first time that in a mouse model of diabetes, the db/db mice, renal hypoxia can be detected in vivo in the kidney cortex and more strikingly in the medulla early on in the course of diabetic kidney disease. These observations are consistent with previous reports that demonstrated early changes with BOLD MRI in a rat model of type I diabetes model.11 The sensitivity of this technique is further demonstrated by our findings showing that hypoxia early on, in mice of the same age (10 weeks old) cannot be detected using pimonidazole, a dye used to detect kidney hypoxia.23
With BOLD MR imaging, we observed that at 10 weeks of age the kidney medullary oxygenation level was markedly decreased in diabetic db/db mice as shown by increased R2* values (Fig. 3). In the cortex the difference was smaller but statistically significant. Studies at 15 weeks of age showed a further increase in both medullary and cortical R2* values in the db/db mice documenting worsening of renal hypoxia over time. It should be noted that at 10 weeks of age the db/db mice develops mild albuminuria but glomerular injury becomes apparent later on (after 12 weeks of age).18
Pimonidazole staining did show the expected corticomedullary difference in tissue oxygen content.23 This was clearly seen in both db/db and db/m mice. Although the semi-quantitative analysis showed a trend toward increased staining (hence increased level of hypoxia) in db/db mice compared with db/m, this difference did not reach statistical significance (Fig. 3). This is consistent with the relatively low sensitivity of pimonidazole to detect the hypoxia.23 By contrast, BOLD MRI has increased sensitivity and has the advantage that can be used in vivo to document renal hypoxia in diabetic kidney disease. Although the mechanism of hypoxia detected by BOLD MRI early on in the course of diabetic kidney disease cannot be elucidated by this study, we think that it is possibly related to increased oxygen consumption owing to glomerular hyperfiltration. Previous reports have shown that the glomerular filtration rate is elevated as early as 7 weeks in db/db mice.18 The hyperfiltration that is a characteristic of the early stages of diabetic nephropathy, likely results in increased sodium load to the tubules resulting in enhanced oxygen consumption to support the reabsorptive work. As we did not measure glomerular filtration rate or renal blood flow in this study, our previous report in rats with streptozotocin-induced diabetes showed very little change in blood flow suggesting that the observed decrease in oxygenation is predominantly related to increased oxygen consumption.11 Others have suggested that renal hypoxia may be linked to enhanced oxidative stress, which is also a feature of diabetic nephropathy.12 Regardless of the mechanism, our findings support the concept that renal hypoxia may be involved in the progression of diabetic kidney disease.6,7
In conclusion, the results presented here support the hypothesis that hypoxia is an early pathophysiologic finding in diabetic kidney disease, and moreover document its worsening over time in a mouse model of type 2 diabetes. BOLD MRI allows the in vivo detection of the state of renal oxygenation and the opportunity to examine the temporal evolution with disease progression. This technique might be useful to evaluate therapeutic interventions aimed at preventing the progression of kidney disease in humans.
Acknowledgments
The authors thank Scot Lindsay, PhD (GE Healthcare, Waukesha, WI) for providing the surface coil.
Supported in part by NIDDK, RO1-DK073973 (PP) and NIDDK, RO1 DK080089 (DB) and Juvenile Diabetes Research Foundation (DB).
References
- 1.Rincon-Choles H, Thameem F, Lehman DM, et al. Genetic basis of diabetic nephropathy. Am J Ther. 2005;12:555–561. doi: 10.1097/01.mjt.0000178770.52610.bf. [DOI] [PubMed] [Google Scholar]
- 2.Susztak K, Bottinger EP. Diabetic nephropathy: a frontier for personalized medicine. J Am Soc Nephrol. 2006;17:361–367. doi: 10.1681/ASN.2005101109. [DOI] [PubMed] [Google Scholar]
- 3.Batlle D. Clinical and cellular markers of diabetic nephropathy. Kidney Int. 2003;63:2319–2330. doi: 10.1046/j.1523-1755.2003.00053.x. [DOI] [PubMed] [Google Scholar]
- 4.Leon CA, Raij L. Interaction of haemodynamic and metabolic pathways in the genesis of diabetic nephropathy. J Hypertens. 2005;23:1931–1937. doi: 10.1097/01.hjh.0000188415.65040.5d. [DOI] [PubMed] [Google Scholar]
- 5.Breyer MD, Tchekneva E, Qi Z, et al. Examining diabetic nephropathy through the lens of mouse genetics. Curr Diab Rep. 2007;7:459–466. doi: 10.1007/s11892-007-0078-3. [DOI] [PubMed] [Google Scholar]
- 6.Fine LG, Norman JT. Chronic hypoxia as a mechanism of progression of chronic kidney diseases: from hypothesis to novel therapeutics. Kidney Int. 2008;74:867–872. doi: 10.1038/ki.2008.350. [DOI] [PubMed] [Google Scholar]
- 7.Rosenberger C, Khamaisi M, Abassi Z, et al. Adaptation to hypoxia in the diabetic rat kidney. Kidney Int. 2008;73:34–42. doi: 10.1038/sj.ki.5002567. [DOI] [PubMed] [Google Scholar]
- 8.Sodhi CP, Phadke SA, Batlle D, et al. Hypoxia and high glucose cause exaggerated mesangial cell growth and collagen synthesis: role of osteopontin. Am J Physiol Renal Physiol. 2001;280:F667–F674. doi: 10.1152/ajprenal.2001.280.4.F667. [DOI] [PubMed] [Google Scholar]
- 9.Prasad PV, Edelman RR, Epstein FH. Noninvasive evaluation of intrarenal oxygenation with BOLD MRI. Circulation. 1996;94:3271–3275. doi: 10.1161/01.cir.94.12.3271. [DOI] [PubMed] [Google Scholar]
- 10.Ries M, Basseau F, Tyndal B, et al. Renal diffusion and BOLD MRI in experimental diabetic nephropathy. Blood oxygen level-dependent. J Magn Reson Imaging. 2003;17:104–113. doi: 10.1002/jmri.10224. [DOI] [PubMed] [Google Scholar]
- 11.dos Santos EA, Li LP, Ji L, et al. Early changes with diabetes in renal medullary hemodynamics as evaluated by fiberoptic probes and BOLD magnetic resonance imaging. Invest Radiol. 2007;42:157–162. doi: 10.1097/01.rli.0000252492.96709.36. [DOI] [PMC free article] [PubMed] [Google Scholar]
- 12.Palm F. Intrarenal oxygen in diabetes and a possible link to diabetic nephropathy. Clin Exp Pharmacol Physiol. 2006;33:997–1001. doi: 10.1111/j.1440-1681.2006.04473.x. [DOI] [PubMed] [Google Scholar]
- 13.Li LP, Ji L, Lindsay S, et al. Evaluation of intrarenal oxygenation in mice by BOLD MRI on a 3.0T human whole-body scanner. J Magn Reson Imaging. 2007;25:635–638. doi: 10.1002/jmri.20841. [DOI] [PubMed] [Google Scholar]
- 14.Prasad PV. Functional MRI of the kidney: tools for translational studies of pathophysiology of renal disease. Am J Physiol Renal Physiol. 2006;290:F958–F974. doi: 10.1152/ajprenal.00114.2005. [DOI] [PMC free article] [PubMed] [Google Scholar]
- 15.Textor SC, Glockner JF, Lerman LO, et al. The use of magnetic resonance to evaluate tissue oxygenation in renal artery stenosis. J Am Soc Nephrol. 2008;19:780–788. doi: 10.1681/ASN.2007040420. [DOI] [PMC free article] [PubMed] [Google Scholar]
- 16.Gloviczki ML, Glockner J, Gomez SI, et al. Comparison of 1.5 and 3 T BOLD MR to study oxygenation of kidney cortex and medulla in human renovascular disease. Invest Radiol. 2009;44:566–571. doi: 10.1097/RLI.0b013e3181b4c1e8. [DOI] [PMC free article] [PubMed] [Google Scholar]
- 17.Li LP, Ji L, Santos EA, et al. Effect of nitric oxide synthase inhibition on intrarenal oxygenation as evaluated by blood oxygenation level-dependent magnetic resonance imaging. Invest Radiol. 2009;44:67–73. doi: 10.1097/RLI.0b013e3181900975. [DOI] [PMC free article] [PubMed] [Google Scholar]
- 18.Sharma K, McCue P, Dunn SR. Diabetic kidney disease in the db/db mouse. Am J Physiol Renal Physiol. 2003;284:F1138–F1144. doi: 10.1152/ajprenal.00315.2002. [DOI] [PubMed] [Google Scholar]
- 19.Ye M, Wysocki J, William J, et al. Glomerular localization and expression of Angiotensin-converting enzyme 2 and Angiotensin-converting enzyme: implications for albuminuria in diabetes. J Am Soc Nephrol. 2006;17:3067–3075. doi: 10.1681/ASN.2006050423. [DOI] [PubMed] [Google Scholar]
- 20.Hong SW, Isono M, Chen S, et al. Increased glomerular and tubular expression of transforming growth factor-beta1, its type II receptor, and activation of the Smad signaling pathway in the db/db mouse. Am J Pathol. 2001;158:1653–1663. doi: 10.1016/s0002-9440(10)64121-1. [DOI] [PMC free article] [PubMed] [Google Scholar]
- 21.Brown JA, Chua SC, Jr, Liu SM, et al. Spontaneous mutation in the db gene results in obesity and diabetes in CD-1 outbred mice. Am J Physiol Regul Integr Comp Physiol. 2000;278:R320–R330. doi: 10.1152/ajpregu.2000.278.2.R320. [DOI] [PubMed] [Google Scholar]
- 22.Like AA, Lavine RL, Poffenbarger PL, et al. Studies in the diabetic mutant mouse. VI. Evolution of glomerular lesions and associated proteinuria. Am J Pathol. 1972;66:193–224. [PMC free article] [PubMed] [Google Scholar]
- 23.Rosenberger C, Rosen S, Paliege A, et al. Pimonidazole adduct immunohistochemistry in the rat kidney: detection of tissue hypoxia. Methods Mol Biol. 2009;466:161–174. doi: 10.1007/978-1-59745-352-3_12. [DOI] [PubMed] [Google Scholar]