

Abstract
Objective
The objective of this study was to evaluate the effects of potential renoprotective interventions such as the administration of N-acetylcysteine (NAC; antioxidant) and furosemide (diuretic) on intrarenal oxygenation as evaluated by blood oxygen level–dependent (BOLD) magnetic resonance imaging (MRI) in combination with urinary neutrophil gelatinase–associated lipocalin (NGAL) measurements.
Materials and Methods
Rats received nitric oxide synthase inhibitor L-NAME (10 mg/kg) and cyclooxygenase inhibitor indomethacin (10 mg/kg) to induce the risk for developing iodinated contrast-induced acute kidney injury before receiving one of the interventions: NAC, furosemide, or placebo. One of the 3 iodinated contrast agents (iohexol, ioxaglate, or iodixanol) was then administered (1600-mg organic iodine per kilogram body weight). Fifty-four Sprague-Dawley rats were allocated in a random order into 9 groups on the basis of the intervention and the contrast agent received.
Blood-oxygen-level–dependent MRI–weighted images were acquired on a Siemens 3.0-T scanner using a multiple gradient recalled echo sequence at baseline, after L-NAME, indomethacin, interventions or placebo, and iodinated contrast agents. Data acquisition and analysis were performed in a blind fashion. R2* (=1/T2*) maps were generated inline on the scanner. A mixed-effects growth curve model with first-order autoregressive variance-covariance was used to analyze the temporal data. Urinary NGAL, a marker of acute kidney injury, was measured at baseline, 2 and 4 hours after the contrast injection.
Results
Compared with the placebo-treated rats, those treated with furosemide showed a significantly lower rate of increase in R2* (P < 0.05) in the renal inner stripe of the outer medulla. The rats treated with NAC showed a lower rate of increase in R2* compared with the controls, but the difference did not reach statistical significance. Urinary NGAL showed little to no increase in R2* after administration of iodixanol in the rats pretreated with furosemide but demonstrated significant increase in the rats pretreated with NAC or placebo (P < 0.05).
Conclusions
This is the first study to evaluate the effects of interventions to mitigate the deleterious effects of contrast media using BOLD MRI. The rate of increase in R2* after administration of iodinated contrast is associated with acute renal injury as evaluated by NGAL. Further studies are warranted to determine the optimum dose of furosemide and NAC for mitigating the ill effects of contrast media. Because NGAL has been shown to be useful in humans to document iodinated contrast-induced acute kidney injury, the method presented in this study using BOLD MRI and NGAL measurements can be translated to humans.
Keywords: kidney, oxygenation, BOLD MRI, NGAL, iodinated contrast, acute kidney injury, rats, nitric oxide, furosemide
Iodinated contrast-induced acute kidney injury (CIAKI) was first reported almost 50 years ago.1 However, some recent reports have questioned the causality, that is, is the acute kidney injury (AKI) necessarily related to contrast administration?2 This is probably related to the inherent delay in the measurement of serum creatinine (SCr) typically assessed 24 to 72 hours after contrast.2 Novel markers that can detect changes more acutely are being sought, and a recent report indicated that urinary neutrophil gelatinase-associated lipocalin (NGAL) can detect changes as early as 8 hours after contrast.3 Neutrophil gelatinase-associated lipocalin is a marker of kidney injury and is therefore more of an outcome measure. One can hypothesize that, with markers sensitive to factors along the pathophysiologic pathway, the specificity to contrast administration may be further improved. The exact underlying mechanisms of CIAKI have yet to be fully elucidated, but the role of renal medullary hypoxia4 is now well accepted.5–8 Previous reports using blood oxygenation level–dependent (BOLD) magnetic resonance imaging (MRI) have shown acute (within minutes) responses to iodinated contrast agents in healthy human subjects9 and near real-time responses in CIAKI-susceptible rats.10,11
Baseline morbidities, such as diabetes and chronic kidney disease, put patients at a higher risk for developing CIAKI after contrast administration.12 A variety of preventive interventions have been proposed to mitigate the risk for developing CIAKI,13,14 but hydration is the only widely accepted preventive strategy.14,15 N-acetylcysteine (NAC, antioxidant) is also widely used, although its efficacy in reducing CIAKI remains controversial.13,16 Furosemide (loop diuretic) has been shown to improve intrarenal oxygenation in healthy subjects17 and has been shown to prevent CIAKI in rats.18 However, clinical trials have shown that furosemide may not be efficacious and actually detrimental.19,20 Studies of CIAKI in humans remain controversial, at least in part because of the natural heterogeneity within patient populations. Studies in animal models allow for a higher degree of specificity, alleviate the heterogeneity issues in human cohorts, and may be useful in the evaluation of CIAKI associated with different contrast media21 (CM) and potential preventive strategies.
A rodent model of CIAKI-susceptible rats involving pretreatment with L-NAME (nitric oxide synthase inhibitor) and indomethacin (prostaglandin inhibitor) resulted in impaired endothelium-derived vasorelaxation and severe histologically proven renal injury after iodinated contrast agent administration.5 Blood oxygenation level–dependent MRI in this model of CIAKI shows an increase in R2* values, primarily in the inner stripe of the outer medulla (ISOM).21 The purpose of this study was to evaluate whether an increase in R2* values observed after contrast agent administration in CIAKI-susceptible animals leads to AKI as determined by urinary NGAL. Interventions that may reduce the increase in R2* postcontrast agent administrations were assessed for their possible role in preventing the development of AKI as well.
MATERIALS AND METHODS
Animal
A total of 54 male Sprague-Dawley rats (Harlan Laboratories, Madison, WI) were included in this study. All experiments were conducted in accordance with local institutional animal care and use committee policies. The animals were anesthetized with inactin (100 mg/kg intraperitoneal injection; Sigma-Aldrich, St Louis, MO). The average weight of the animals at the time of the MRI scan was 321.8 ± 5.6 g. A femoral vein was catheterized for the administration of drugs or placebo.
The rats were allocated into 9 equal groups on the basis of the intervention tested and contrast agent received (Table 1). The animals were randomly assigned to each of these groups. The investigators who performed data acquisition and analysis were blinded to group assignment. All rats received the same pretreatments of nitric oxide synthase inhibitor, N-nitro-L-arginine methyl ester5 (L-NAME, 10 mg/kg; Sigma-Aldrich, St Louis, MO), and cyclooxygenase inhibitor indomethacin5 (10 mg/kg; Sigma-Aldrich, St Louis, MO) before one of the interventions (furosemide, NAC, or placebo) to induce the risk for developing CIAKI.
TABLE 1.
Group Descriptions
| Group No. | Baseline | Pretreatment | Intervention | Contrast | |
|---|---|---|---|---|---|
| 1 | L-NAME | Indomethacin | Saline | Iodixanol | |
| 2 | L-NAME | Indomethacin | Furosemide | Iodixanol | |
| 3 | L-NAME | Indomethacin | NAC | Iodixanol | |
| 4 | L-NAME | Indomethacin | Saline | Iohexol | |
| 5 | L-NAME | Indomethacin | Furosemide | Iohexol | |
| 6 | L-NAME | Indomethacin | NAC | Iohexol | |
| 7 | L-NAME | Indomethacin | Saline | Ioxaglate | |
| 8 | L-NAME | Indomethacin | Furosemide | Ioxaglate | |
| 9 | L-NAME | Indomethacin | NAC | Ioxaglate | |
| Scan time | 15′ | 15′ | 15′ | 15′ | 60′ |
NAC indicates N-acetylcysteine.
Drugs
L-NAME pretreatment solution was prepared before each MRI scan. Indomethacin was dissolved in saline, and the pH was adjusted to 7.4 to 8.0 using potassium hydroxide and hydrochloric acid. The 2 protective agents tested were furosemide (Hospira, Lake Forest, IL) and NAC (Sigma-Aldrich). Dose information is listed in Table 2. The animals in the control group were administered saline as a pretreatment. The animals received 1 of the 3 CM (iodixanol [Visipaque, GE Healthcare], iohexol [Omnipaque; GE Healthcare], or ioxaglate [Hexabrix, Guerbet, LLC, Bloomington, IN]). On the basis of a previous report, a dose of 1600 mg of organic iodine per kilogram body weight (mgI/kg) was administered as a bolus over 2 minutes.22 Intravenous lines were flushed using 0.2-mL saline after each drug. The dose of CM used in this study is comparable with that of previous reports.11,21
TABLE 2.
Chemical Dose Chart
| Chemical Name | Dose (IV) | |
|---|---|---|
| Pretreatment 1 | L-NAME | 10 mg/kg |
| Pretreatment 2 | Indomethacin | 10 mg/kg |
| Interventions | Saline (control) | 1 mL/kg |
| Interventions | Furosemide | 10 mg/kg |
| Interventions | NAC | 60 mg/kg |
| Iodinated contrast | Iodixanol | 1600 mgI/kg |
| Iodinated contrast | Iohexol | 1600 mgI/kg |
| Iodinated contrast | Ioxaglate | 1600 mgl/kg |
IV indicates intravenous; NAC, N-acetylcysteine.
MRI Scan
The rats were placed in a right decubitus position to minimize susceptibility artifacts from bowel loops with the kidneys placed in the middle of an 8-channel standard knee coil. Data of MRI were acquired from 1 transverse slice in the middle of the kidney. The investigator acquiring data was blinded to the group assignment. Imaging was performed on a 3.0-T scanner (MAGNETOM Verio; Siemens, Erlangen, Germany) using multiple gradient recalled echo sequence. Twelve T2*-weighted images were acquired using the following parameters: repetition time/echo time, 69 milliseconds/3.6 to 41.3 milliseconds; field of view, 12 × 6 cm; bandwidth, 320 hertz per pixel; flip angle, 30 degrees; matrix, 256 × 256; slice thickness, 2 mm; number of excitations, 20.
Five imaging phases were included for each rat (scan time scheme is indicated in Table 1): baseline, pretreatment 1 (the rats received L-NAME), pretreatment 2 (the rats received indomethacin), intervention (the rats received furosemide or NAC or placebo), and CM (the rats received iodixanol, or iohexol, or ioxaglate). Blood oxygenation level–dependent images were acquired for 15 minutes (5 sets) for each of the first 4 phases and 60 minutes (20 sets) after CM administration.
Urinary Biomarker NGAL
Urine samples were collected before the BOLD MRI scan, then 2 and 4 hours after administration of the contrast agents. Urine was collected for urinary NGAL assessment and stored at −80°F. The samples were processed in batches at the end of the study using GAL ELISA kits (046; BioPorto Diagnostics, Gentofte, Denmark) on the basis of the manufacturer instructions. Concentration levels of NGAL were normalized to urine creatinine concentrations (analyzed by the local clinical laboratory) to minimize any confounding effects of urine flow rate.23
Data Processing
R2* maps were generated inline immediately after data acquisition. Quantitative regional R2* measurements were performed using manually defined region-of-interest (ROI) measurements by an investigator who remained blinded to the group assignment. The ROIs were placed in the ISOM and the outer stripe of the outer medulla (OSOM), inner medulla (IM), and cortex (CO) as shown in Figure 1. A custom Matlab (Mathworks, Natick, MA) code was used to generate parametric maps of R2* (Fig. 1) by fitting a single exponential decay to the signal intensity–echo time data on a voxel-by-voxel basis.
FIGURE 1.
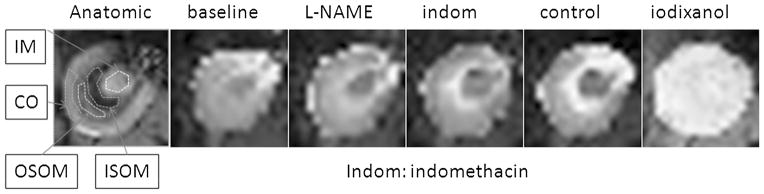
A representative anatomical image of a kidney in a control rat that received placebo in the intervention phase and iodixanol. The typical ROI positions are indicated as the inner medulla (IM), the inner and outer stripe of outer medulla (IOSM and OSOM), as well as the cortex (CO). The R2* maps are displayed with the same window settings. Note the brightness increases after each chemical (progressively increasing R2* values) suggesting increasing levels of hypoxia, especially in the ISOM.
Statistical Analysis
After unblinding of the data, statistical analyses were carried out using SAS 9.2 (SAS, Cary, NC) and P < 0.05 was regarded statistically significant for all tests. A mixed-effect regression model was used to assess BOLD R2* and NGAL measurements in terms of changes over time (slope). All 40 continuous time points of BOLD R2* data (spanning a total of 120 minutes) were included. Three time points for NGAL were included. Group, time (continuous), and group by time interactions were included as fixed effects in the model. Random effects were assumed to account for the variation in individual rat. A first-order autoregressive variance-covariance structure was specified for the model by using Akaike Information Criterion. Hochberg step-up method was used to adjust for the multiple comparisons.
RESULTS
Figure 1 illustrates a representative anatomical image of a rat kidney with typical ROI positions indicated as IM, ISOM and OSOM, as well as CO. Also shown are representative R2* maps displayed with the same window settings. Note the progressively increasing R2* values (shown as increased brightness) after each drug in the medulla suggesting increasing levels of hypoxia, especially in ISOM.
Figure 2A summarizes the time course for normalized R2* (to baseline values) in all 4 renal regions obtained from all 9 groups. Figure 2B highlights the data from ISOM in the rats receiving iodixanol. Note the reduction in R2* values immediately after administration of furosemide toward baseline. The R2* values continue to remain low in this group even after contrast agent administration compared with the other 2 groups. The NAC-treated rats show reduced R2* values compared with the control group, but the difference did not reach statistical significance. Figure 2C shows the comparison of R2* values in ISOM in the control groups receiving the 3 different CM.
FIGURE 2.

A, The summary of the temporal changes in R2* (R2*/baseline) measurements in the 4 renal regions in all animal groups based on 3 CM and 4 renal regions. R2* values were normalized to baseline values to allow combining data from the different groups. Each data point is the average of R2* measurements in 6 rats in the experimental time. Each time course consisted of 40 time points. The vertical lines show the time of administration of pretreatments, intervention (or placebo), and CM agents. B, The ISOM data in the rats that received iodixanol are highlighted. C, The temporal R2* changes in renal ISOM from the control rats that received different contrasts.
Figure 3 is the summary of urinary NGAL measurements in all 9 groups. Note that the furosemide-treated rats showed the lowest increase in NGAL readings at 4-hour postcontrast agent administration compared with baseline levels with any of the CM. Although urine samples were collected for analysis in all 6 rats in each group, technical issues prevented us from obtaining valid data in all animals. Technical difficulties included sampling issues (no samples in 7 rats at baseline, 4 animals died before the 4-hour sample acquisition) and readings being out of range in NGAL and/or urine creatinine measurements (13 samples had no creatinine readings).
FIGURE 3.

The normalized NGAL (NGAL/urine creatinine, mean ± SE) from all groups.
Table 3 is the summary of estimated slopes of R2* in different renal regions and NGAL using a linear mixed-effects growth curve model along with the estimated P values. Statistical analysis for NGAL is shown only for the rats treated with iodixanol owing to the limited number of valid measurements for the other groups. There is an overall positive slope in R2*, and the slopes are significantly different among the groups in 4 renal regions (P < 0.01). Similarly, there is an overall positive slope in NGAL for groups 1 and 3 but not in group 2 (the rats receiving furosemide). The following observations can be made on the basis of these data:
TABLE 3.
R2* and NGAL Slope Estimated From the Linear Mixed-Effects Growth Model
| Group No. | IM | ISOM | OSOM | CO | NGAL | |
|---|---|---|---|---|---|---|
| Iodixanol_ctrl | 1 | 0.82* | 0.99* | 0.52* | 0.22* | 19.19* |
| Iodixanol_fur | 2 | 0.20*†‡ |
|
0.34* | 0.08* | −1.93†‡ |
| Iodixanol_NAC | 3 | 0.56*† | 0.94* | 0.36* | 0.14* | 19.97* |
| Iohexol_ctrl | 4 | 0.29* | 0.52* | 0.30* | 0.06 | |
| Iohexol_fur | 5 | 0.14 | 0.25*†‡ | 0.21* | 0.04 | |
| Iohexol_NAC | 6 | 0.3* | 0.55* | 0.24* | 0.01 | |
| Ioxalgate_ctrl | 7 | 0.28* | 0.54* | 0.41* | 0.08 | |
| Ioxalgate_fur | 8 | 0.06† | 0.20*† | 0.25* | 0.05 | |
| Ioxalgate_NAC | 9 | 0.18* | 0.42* | 0.49* | 0.03 |
R2* slope in the ISOM increased significantly in Iodixanol_fur; however, NGAL showed no increase in this group over 4 hours. We used this as a reference slope and defined a threshold value of slope greater than 0.33 and reaching statistical significance to be pathophysiologically relevant. These values are shown in bold characters.
Slope is significantly different from zero (P < 0.05).
Significant change in slope compared with the corresponding control group (P < 0.05).
Significant change in slope compared with the corresponding NAC group (P < 0.05).
CO indicates cortex; Ctrl, control; fur, furosemide; IM, inner medulla; ISOM, the inner stripe of the outer medulla; NGAL, neutrophil gelatinase–associated lipocalin; OSOM, the outer stripe of the outer medulla.
Maximum changes were observed in the IM and the ISOM with iodixanol in the control group. When considering responses with all 3 agents, the ISOM showed the largest change. The IM demonstrated similar levels of change compared with ISOM but only with iodixanol.
Although R2* increased significantly from zero in the ISOM of group 2, NGAL showed no significant change after the contrast agent administration. Using this slope value as a reference, a threshold for pathophysiological response to CM administration was defined as a statistically significant slope greater than 0.33.
The CO showed the least change over time (slope, <0.33) compared with other regions. The OSOM showed slopes greater than 0.33 especially with the higher viscosity agents (iodixanol and ioxalgate, Table 3). However, the values were lower compared with those in ISOM.
The rats receiving furosemide (groups 2, 5, and 8) showed the least response to contrast agent in R2* in the ISOM (slope ≤ 0.33). These slopes were significantly different compared with both the respective control groups and those receiving NAC as intervention.
The rats receiving NAC as intervention (groups 3, 6, and 9) showed slopes lower than those in the respective control groups (groups 1, 4, and 7) in terms of the response to CM. However, the differences did not reach statistical significance.
DISCUSSION
The data reported in this study further validate the use of CIAKI-susceptible rats combined with BOLD MRI to investigate the changes in intrarenal oxygenation after administration of CM and potential interventions that could mitigate those changes. The key finding is that furosemide at the dose used in this study diminishes the response of increased R2* after CM. This was true with any of the 3 contrast agents investigated. Urinary NGAL, a biomarker of CIAKI,3,23,24 showed little to no increase (P > 0.05) after administration of iodixanol in those rats pretreated with furosemide. In comparison, the control group and the rats pretreated with NAC showed a large (approximately 6-fold) and statistically significant increase in urinary NGAL levels, signifying CIAKI. On the basis of our assessment, this is the first study to evaluate the effects of interventions to mitigate the deleterious effects of CM using BOLD MRI.
From the data in Table 3, the ISOM demonstrated the largest R2* change after CM, consistent with the literature regarding the relative sensitivity of this region to ischemic injury.25,26 The control groups showed significant R2* increases with all 3 CM (slopes, 0.54–0.99). The apparent difference in the magnitude of change between the 3 agents is surprising, considering that a previous study reported similar responses in CIAKI-susceptible rats.21 The reason for the apparent discrepancy is not yet clear. However, we suspect that it may be related to the saline administration used as placebo because that is the only difference between this and the previous report. Although a few measurements in the CO, primarily with iodixanol, reached statistical significance compared with our defined reference value, none of the measurements were deemed pathophysiologically relevant (that is, slopes <0.33). Several groups showed slopes greater than 0.33 in the OSOM with statistical significance, mainly with the higher viscosity agents, iodixanol and ioxalgate. However, the slopes were relatively small compared with those observed in ISOM. The responses in the ISOM of the groups treated with furosemide were consistently the lowest (slope, <0.33) and were statistically different compared with the respective control groups and those receiving NAC. The slopes in the ISOM observed in the NAC-treated groups were generally lower compared with the respective control groups but did not reach statistical significance with any of the CM.
In summary, the data presented here support the hypothesis that changes observed in the ISOM after contrast administration by BOLD MRI could be useful in determining the risk for subsequent development of AKI. The observations with furosemide pretreatment are consistent with earlier reports.18,27 However, the first clinical trial suggested not only that furosemide was not effective at reducing CIAKI but also that it could be deleterious.20 This was thought to be related to the associated intravascular volume depletion when using furosemide.28 A later study that combined euvolemic diuresis with furosemide also found an increased rate of CIAKI compared with the group receiving hydration alone.19 The authors speculated that the cause may be due to altered hemodynamics. Furosemide in high-risk patients is thought to increase cortical blood flow by diverting medullary blood flow, resulting in exacerbation of medullary hypoxia.29,30 However, this premise has not been verified because of the lack of a noninvasive method to probe renal medullary hypoxia in humans. With the availability of BOLD MRI or, alternately, urine Po2,31 there is now an opportunity to verify the speculation. Before attempting a human study involving contrast agent administration in high-risk patients, the present study was performed to verify the feasibility of this methodology in an animal model of high risk for CIAKI. There is also renewed interest in the use of furosemide for preventing AKI by combining it with matched hydration.32 Clinical reports on CIAKI that are based on the SCr as the outcome measure should be viewed with a certain level of skepticism given the fact that recent studies have shown similar increases in SCr even in subjects not receiving contrast media.2 Our observations do support the mitigation of the contrast agent–induced hypoxia when pretreated with furosemide. The reduction in R2* values in the furosemide group when combined with the NGAL measurements suggests the absence of AKI. The dose of furosemide in our study (10-mg/kg bolus) is higher than the dose being used in humans (0.5 mg/kg).32 However, it should be noted that many studies have shown that 20 mg of furosemide in humans elicits a significant response on medullary R2* values.17,33,34 Future studies should investigate the effects of clinically viable doses of furosemide and in combination with matched hydration on the efficacy to mitigate CIAKI. Future studies should also include SCr measurements. Serum creatinine was not measured in this study because of the non–survival nature of animals anesthetized with inactin.
It is not yet clear how to interpret the lack of significant response of pretreating with NAC. Given the fact that there is a trend of reduced R2* values in the NAC group compared with the controls in the iodixanol-treated animals, we believe there is a need for dose optimization. The literature review includes a very wide range of NAC doses for intravenous administration (7–200 mg/kg).35 Previous studies have also documented a dose dependence on efficacy.36,37 Future studies could investigate the use of higher doses. In this regard, we believe that the response to an interventional drug on normalizing the R2* values in ISOM could be used to determine the optimal dose. This is based on the observation that R2* values in the ISOM immediately after furosemide administration reached baseline values (Fig. 2B). If this were verified in the animal study, then similar dose optimization could be performed in humans.
The study did have some limitations, mainly the lack of sufficient number for urinary NGAL analysis. The sample size of 6 per group was based on our prior experience with BOLD MRI. However, this may not be optimal for NGAL analysis. Unlike imaging, NGAL analysis is processed in batches. Any sample issues become apparent only at the time of the analysis. Sufficient urine was not available in 7 animals at baseline, and 4 animals died before the 4-hour sampling. A few of sample labels became illegible by the time of the analysis. The need for normalization with urine creatinine values resulted in further issues, such as the creatinine levels were close to zero in 13 urine samples. It should be noted, without the normalization to urine creatinine (data not shown), the trends were similar to those shown in Figure 3. The urine NGAL and creatinine analysis were done by 2 different laboratories in this study. Future studies should use the NGAL data to estimate sample size and preferably a single laboratory to analyze both NGAL and creatinine. The choice of R2* as a BOLD MRI parameter has some inherent limitations. It is not specific to blood oxygenation and potentially depends on blood volume, hemoglobin levels, hematocrit levels, and R2.38 On the basis of previous study in rats, the hematocrit level decreased approximately 9% immediately after contrast administration but came back to baseline within 20 minutes.39 A recent article21 had provided arguments to support that the contributions from these potential confounding factors are not dominant. We did acquire R2 data (to account for any direct effects of viscosity or iodine) in 35 of the 54 rats included in the study (data not shown). In general, we found minimal changes in R2 going from baseline to postcontrast media with maximum change in group 1 in IM of 3.6 s−1. This is very small compared with more than approximately 100 s−1 changes observed in R2* values in the ISOM and the IM.
In conclusion, the data from the present study demonstrate the utility of the CIAKI-susceptible animal model in combination with BOLD MRI and NGAL measurements in investigating the effects of various interventions against AKI. Further studies are warranted to determine the optimal dose of furosemide and NAC for mitigating the ill effects of contrast media. Because NGAL has been shown to be useful in humans to document CIAKI, the methodology in the present study, with a combination of BOLD MRI and NGAL analysis, can be translated to humans.
Acknowledgments
Sources of funding: Supported in part by a grant from the National Institutes of Health (RO1- DK-053221).
The authors thank Claire Feczko for her assistance in editing the manuscript of this article.
Footnotes
Conflicts of interest: The authors declare no conflicts of interest.
References
- 1.Berlyne N, Berlyne GM. Acute renal failure following intravenous pyelography with hypaque. Acta Med Scand. 1962;171:39–41. doi: 10.1111/j.0954-6820.1962.tb04165.x. [DOI] [PubMed] [Google Scholar]
- 2.McDonald RJ, McDonald JS, Bida JP, et al. Intravenous contrast material-induced nephropathy: causal or coincident phenomenon? Radiology. 2013;267:106–118. doi: 10.1148/radiol.12121823. [DOI] [PMC free article] [PubMed] [Google Scholar]
- 3.Lacquaniti A, Buemi F, Lupica R, et al. Can neutrophil gelatinase-associated lipocalin help depict early contrast material-induced nephropathy? Radiology. 2013;267:86–93. doi: 10.1148/radiol.12120578. [DOI] [PubMed] [Google Scholar]
- 4.Brezis M, Rosen S. Hypoxia of the renal medulla—its implications for disease. N Engl J Med. 1995;332:647–655. doi: 10.1056/NEJM199503093321006. [DOI] [PubMed] [Google Scholar]
- 5.Agmon Y, Peleg H, Greenfeld Z, et al. Nitric oxide and prostanoids protect the renal outer medulla from radiocontrast toxicity in the rat. J Clin Invest. 1994;94:1069–1075. doi: 10.1172/JCI117421. [DOI] [PMC free article] [PubMed] [Google Scholar]
- 6.Heyman SN, Reichman J, Brezis M. Pathophysiology of radiocontrast nephropathy: a role for medullary hypoxia. Invest Radiol. 1999;34:685–691. doi: 10.1097/00004424-199911000-00004. [DOI] [PubMed] [Google Scholar]
- 7.Liss P. Effects of contrast media on renal microcirculation and oxygen tension. An experimental study in the rat. Acta Radiol Suppl. 1997;409:1–29. [PubMed] [Google Scholar]
- 8.Palm F, Carlsson PO, Fasching A, et al. Effects of the contrast medium iopromide on renal hemodynamics and oxygen tension in the diabetic rat kidney. Adv Exp Med Biol. 2003;530:653–659. doi: 10.1007/978-1-4615-0075-9_65. [DOI] [PubMed] [Google Scholar]
- 9.Hofmann L, Simon-Zoula S, Nowak A, et al. BOLD-MRI for the assessment of renal oxygenation in humans: acute effect of nephrotoxic xenobiotics. Kidney Int. 2006;70:144–150. doi: 10.1038/sj.ki.5000418. [DOI] [PubMed] [Google Scholar]
- 10.Prasad PV, Priatna A, Spokes K, et al. Changes in intrarenal oxygenation as evaluated by BOLD MRI in a rat kidney model for radiocontrast nephropathy. J Magn Reson Imaging. 2001;13:744–747. doi: 10.1002/jmri.1103. [DOI] [PMC free article] [PubMed] [Google Scholar]
- 11.Li LP, Franklin T, Du H, et al. Intrarenal oxygenation by blood oxygenation level-dependent MRI in contrast nephropathy model: effect of the viscosity and dose. J Magn Reson Imaging. 2012;36:1162–1167. doi: 10.1002/jmri.23747. [DOI] [PMC free article] [PubMed] [Google Scholar]
- 12.Solomon R, Dauerman HL. Contrast-induced acute kidney injury. Circulation. 2010;122:2451–2455. doi: 10.1161/CIRCULATIONAHA.110.953851. [DOI] [PubMed] [Google Scholar]
- 13.Kelly AM, Dwamena B, Cronin P, et al. Meta-analysis: effectiveness of drugs for preventing contrast-induced nephropathy. Ann Intern Med. 2008;148:284–294. doi: 10.7326/0003-4819-148-4-200802190-00007. [DOI] [PubMed] [Google Scholar]
- 14.Ellis JH, Cohan RH. Prevention of contrast-induced nephropathy: an overview. Radiol Clin North Am. 2009;47:801–811. doi: 10.1016/j.rcl.2009.06.003. [DOI] [PubMed] [Google Scholar]
- 15.Balemans CE, Reichert LJ, van Schelven BI, et al. Epidemiology of contrast material-induced nephropathy in the era of hydration. Radiology. 2012;263:706–713. doi: 10.1148/radiol.12111667. [DOI] [PubMed] [Google Scholar]
- 16.Chousterman BG, Bouadma L, Moutereau S, et al. Prevention of contrast-induced nephropathy by N-acetylcysteine in critically ill patients: different definitions, different results. J Crit Care. 2013;28:701–709. doi: 10.1016/j.jcrc.2013.03.007. [DOI] [PubMed] [Google Scholar]
- 17.Epstein FH, Prasad P. Effects of furosemide on medullary oxygenation in younger and older subjects. Kidney Int. 2000;57:2080–2083. doi: 10.1046/j.1523-1755.2000.00057.x. [DOI] [PubMed] [Google Scholar]
- 18.Heyman SN, Brezis M, Greenfeld Z, et al. Protective role of furosemide and saline in radiocontrast-induced acute renal failure in the rat. Am J Kidney Dis. 1989;14:377–385. doi: 10.1016/s0272-6386(89)80171-4. [DOI] [PubMed] [Google Scholar]
- 19.Majumdar SR, Kjellstrand CM, Tymchak WJ, et al. Forced euvolemic diuresis with mannitol and furosemide for prevention of contrast-induced nephropathy in patients with CKD undergoing coronary angiography: a randomized controlled trial. Am J Kidney Dis. 2009;54:602–609. doi: 10.1053/j.ajkd.2009.03.024. [DOI] [PubMed] [Google Scholar]
- 20.Solomon R, Werner C, Mann D, et al. Effects of saline, mannitol, and furosemide to prevent acute decreases in renal function induced by radiocontrast agents. N Engl J Med. 1994;331:1416–1420. doi: 10.1056/NEJM199411243312104. [DOI] [PubMed] [Google Scholar]
- 21.Li LP, Lu J, Zhou Y, et al. Evaluation of intrarenal oxygenation in iodinated contrast-induced acute kidney injury-susceptible rats by blood oxygen level-dependent magnetic resonance imaging. Invest Radiol. 2014 doi: 10.1097/RLI.0000000000000031. Epub ahead of print. [DOI] [PMC free article] [PubMed] [Google Scholar]
- 22.Lancelot E, Idee JM, Couturier V, et al. Influence of the viscosity of iodixanol on medullary and cortical blood flow in the rat kidney: a potential cause of nephrotoxicity. J Appl Toxicol. 1999;19:341–346. doi: 10.1002/(sici)1099-1263(199909/10)19:5<341::aid-jat584>3.0.co;2-u. [DOI] [PubMed] [Google Scholar]
- 23.Xin C, Yulong X, Yu C, et al. Urine neutrophil gelatinase-associated lipocalin and interleukin-18 predict acute kidney injury after cardiac surgery. Ren Fail. 2008;30:904–913. doi: 10.1080/08860220802359089. [DOI] [PubMed] [Google Scholar]
- 24.Peco-Antic A, Ivanisevic I, Vulicevic I, et al. Biomarkers of acute kidney injury in pediatric cardiac surgery. Clin Biochem. 2013;46:1244–1251. doi: 10.1016/j.clinbiochem.2013.07.008. [DOI] [PubMed] [Google Scholar]
- 25.De Greef KE, Ysebaert DK, Persy V, et al. ICAM-1 expression and leukocyte accumulation in inner stripe of outer medulla in early phase of ischemic compared to HgCl2-induced ARF. Kidney Int. 2003;63:1697–1707. doi: 10.1046/j.1523-1755.2003.00909.x. [DOI] [PubMed] [Google Scholar]
- 26.Heyman SN, Brezis M, Reubinoff CA, et al. Acute renal failure with selective medullary injury in the rat. J Clin Invest. 1988;82:401–412. doi: 10.1172/JCI113612. [DOI] [PMC free article] [PubMed] [Google Scholar]
- 27.Burke TJ, Malhotra D, Shapiro JI. Effects of enhanced oxygen release from hemoglobin by RSR13 in an acute renal failure model. Kidney Int. 2001;60:1407–1414. doi: 10.1046/j.1523-1755.2001.00968.x. [DOI] [PubMed] [Google Scholar]
- 28.Weinstein JM, Heyman S, Brezis M. Potential deleterious effect of furosemide in radiocontrast nephropathy. Nephron. 1992;62:413–415. doi: 10.1159/000187090. [DOI] [PubMed] [Google Scholar]
- 29.Lassnigg A, Donner E, Grubhofer G, et al. Lack of renoprotective effects of dopamine and furosemide during cardiac surgery. J Am Soc Nephrol. 2000;11:97–104. doi: 10.1681/ASN.V11197. [DOI] [PubMed] [Google Scholar]
- 30.Weisberg LS, Kurnik PB, Kurnik BR. Risk of radiocontrast nephropathy in patients with and without diabetes mellitus. Kidney Int. 1994;45:259–265. doi: 10.1038/ki.1994.32. [DOI] [PubMed] [Google Scholar]
- 31.Evans RG, Smith JA, Wright C, et al. Urinary oxygen tension: a clinical window on the health of the renal medulla? Am J Physiol Regul Integr Comp Physiol. 2014;306:R45–R50. doi: 10.1152/ajpregu.00437.2013. [DOI] [PubMed] [Google Scholar]
- 32.Marenzi G, Ferrari C, Marana I, et al. Prevention of contrast nephropathy by furosemide with matched hydration: the MYTHOS (induced diuresis with matched hydration compared to standard hydration for contrast induced nephropathy prevention) trial. JACC Cardiovasc Interv. 2012;5:90–97. doi: 10.1016/j.jcin.2011.08.017. [DOI] [PubMed] [Google Scholar]
- 33.Gloviczki ML, Glockner J, Gomez SI, et al. Comparison of 1.5 and 3 T BOLD MR to study oxygenation of kidney cortex and medulla in human renovascular disease. Invest Radiol. 2009;44:566–571. doi: 10.1097/RLI.0b013e3181b4c1e8. [DOI] [PMC free article] [PubMed] [Google Scholar]
- 34.Tumkur SM, Vu AT, Li LP, et al. Evaluation of intra-renal oxygenation during water diuresis: a time-resolved study using BOLD MRI. Kidney Int. 2006;70:139–143. doi: 10.1038/sj.ki.5000347. [DOI] [PMC free article] [PubMed] [Google Scholar]
- 35.Sun Z, Fu Q, Cao L, et al. Intravenous N-acetylcysteine for prevention of contrast-induced nephropathy: a meta-analysis of randomized, controlled trials. PLoS One. 2013;8:e55124. doi: 10.1371/journal.pone.0055124. [DOI] [PMC free article] [PubMed] [Google Scholar]
- 36.Marenzi G, Assanelli E, Marana I, et al. N-acetylcysteine and contrast-induced nephropathy in primary angioplasty. N Engl J Med. 2006;354:2773–2782. doi: 10.1056/NEJMoa054209. [DOI] [PubMed] [Google Scholar]
- 37.Briguori C, Colombo A, Violante A, et al. Standard vs double dose of N-acetylcysteine to prevent contrast agent associated nephrotoxicity. Eur Heart J. 2004;25:206–211. doi: 10.1016/j.ehj.2003.11.016. [DOI] [PubMed] [Google Scholar]
- 38.Vivier PH, Storey P, Chandarana H, et al. Renal blood oxygenation level-dependent imaging: contribution of R2 to R2* values. Invest Radiol. 2013;48:501–508. doi: 10.1097/RLI.0b013e3182823591. [DOI] [PMC free article] [PubMed] [Google Scholar]
- 39.Vaamonde CA, Bier RT, Papendick R, et al. Acute and chronic renal effects of radiocontrast in diabetic rats. Role of anesthesia and risk factors. Invest Radiol. 1989;24:206–218. doi: 10.1097/00004424-198903000-00006. [DOI] [PubMed] [Google Scholar]