

Abstract
Purpose
Accurate characterization of contrast reagent (CR) longitudinal relaxivity in whole blood is required to predict arterial signal intensity in contrast-enhanced MR angiography (CE-MRA). This study measured the longitudinal relaxation rate constants (R1) over a range of non-protein-binding and protein-binding CR concentrations in ex vivo whole blood and plasma at 1.5 and 3.0T under physiologic arterial conditions.
Methods
Relaxivities of gadoteridol, gadobutrol, gadobenate, and gadofosveset were measured for [CR] from 0 to 18 mM [mmol(CR)/L(blood)]: the latter being the upper limit of what may be expected in CE-MRA.
Results
In plasma, the 1H2O R1 [CR]-dependence was non-linear for gadobenate and gadofosveset secondary to CR interactions with the serum macromolecule albumin, and was well described by an analytical expression for effective 1:1 binding stoichiometry. In whole blood, the 1H2O R1 [CR]-dependence was markedly non-linear for all CRs, and was well-predicted by an expression for equilibrium exchange of water molecules between plasma and intracellular spaces using a priori parameter values only.
Conclusion
In whole blood, 1H2O R1 exhibits a non-linear relationship with [CR] over 0 to 18 mM CR. The non-linearity is well described by exchange of water between erythrocyte and plasma compartments, and is particularly evident for high relaxivity CRs.
Keywords: MRI, MR Angiography, Relaxation Rate, Relaxation Time, Contrast Agents
Introduction
Background
Increased T1-weighted water proton (1H2O) MR signal intensity during a gadolinium based contrast reagent (GBCR) bolus first-pass results from reduction of the longitudinal relaxation time constant (T1). Reduced intravascular 1H2O T1, relative to that of the surrounding tissue, makes blood appear bright in spoiled gradient echo (SPGR) images. As a first approximation, it is typically assumed that blood 1H2O signal intensity increases with increasing GBCR concentration, and therefore with increasing GBCR dose or injection rate. However, recent studies suggest this is not always the case.
Reduced image quality with increasing contrast reagent (CR) dose has been reported for reagents with relatively high relaxivity. For example, Schneider et al. (1) demonstrated better diagnostic performance in carotid, renal, and aorto-iliac contrast-enhanced MR angiography (CE-MRA) for single dose gadobenate dimeglumine compared with double dose. Possible explanations include lower than expected longitudinal (R1 = 1/T1) or dominant transverse (R2* = 1/T2*) relaxation rate constants at high CR concentration, [CR]. Each of these would reduce the relative blood pool signal. Preliminary reports of high concentration longitudinal and transverse relaxation rate constants in whole blood and plasma have been reported elsewhere (2,3). This study focuses on the mechanism of longitudinal relaxation.
In some environments, the 1H2O R1 value increases linearly with [CR] as given by Equation [1]:
| [1] |
where R10 is the rate constant in the absence of CR, and r1 is the CR relaxivity. Whereas Eq. [1] is valid for homogeneous saline CR solutions and for non-protein binding reagent molecules in plasma, the relation in physiologic environments is more complex and non-linear. Most reported CR relaxivities have been measured in plasma rather than whole blood, or were measured over a relatively low [CR] range. For example, Rohrer et al. (4) measured several GBCR relaxivities in bovine plasma (0.47 – 4.7 T) and canine whole blood (1.5 T) between only 0.25 and 0.5 mM. The authors correctly caution that outside this range relaxivities may vary. In another often cited study, Pintaske et al. (5) measured gadopentetate dimeglumine, gadobutrol and gadobenate dimeglumine relaxivities from 0.01 – 16 mM in plasma. While plasma r1 and transverse relaxivity (r2) values are desirable constructs to advance our understanding of CR effects, they do not fully describe relaxation data from whole blood.
Theory
Water molecules in whole blood exchange very rapidly in equilibrium between the extracellular plasma space and the erythrocyte intracellular compartments (Figure 1). The kinetics of this anomalously fast transcytolemmal process can be characterized by the very small mean intracellular residence time (τi), approximately 10 ms (6–9). Conventional GBCRs are confined to the plasma space, thus creating two 1H2O environments with potentially vastly different 1H2O relaxation rate constants.
Figure 1.
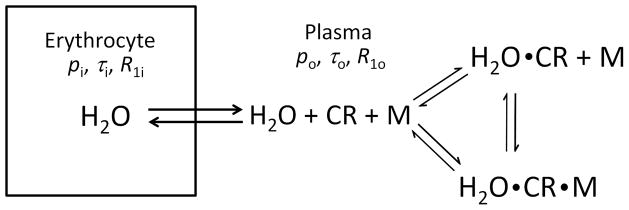
Illustration of blood trans-membrane water exchange between plasma and intracellular volumes. The exchange is characterized by pi, τi, R1i (mole fraction, residence time, and relaxation rate constant) for water inside the erythrocyte, and po, τo, R1o for water in the plasma space. In the latter environment, the 1H2O longitudinal relaxation is catalyzed by dipole interaction with the paramagnetic extracellular contrast reagent (CR) and, in the case of a protein-binding reagent, CR bound to a macromolecule (M). Both the contrast reagent binding to macromolecules and water binding to CR or CRM are reversible processes.
The 1H2O MR behavior of a two-site exchange (2SX) system is described by the Bloch-McConnell equations (10). When [CR] is sufficiently small that observed longitudinal relaxation is mono-exponential (R1 is single-valued: the MR system is in the fast-exchange-regime (FXR) condition), the R1 measured is given by Equation [2]:
| [2a] |
| [2b] |
| [2c] |
where R1i, τi, pi and R1o, τo, po are the intrinsic rate constants, characteristic water residence times, and mole fractions (“populations”) in the intracellular (i) and extracellular (o, “outside”) spaces, respectively (11,12). When the longitudinal shutter-speed T1−1 [≡ |R1o − R1i|] ≪ 1/τi + 1/τo, the system is in the fast-exchange-limit (FXL), and Eq. [2] simplifies to Equation [3]:
| [3] |
(Appendix 1). Thus, in the limit of effectively infinitely fast exchange (e.g. τi → 0), the observed rate constant is the population-weighted average of the 1H2O rate constants for the two compartments. In the case of extracellular GBCR, the FXL is equivalent to considering the CR as uniformly distributed throughout the entire blood volume (erythrocyte and plasma spaces) – tantamount to assuming the cell membranes are not present – fast water exchange “short-circuits” CR compartmentalization (13). In Eq. [3], the po term is the dilution factor for the effective distribution of CR throughout the entire volume. If the relaxation rate constant in the plasma space R1o linearly increases with [CRo] (ie. R1o = r1o[CRo]+R1o0 in Eq. [3]), then the dependence of blood R1 on [CR] remains linear – the characteristic of the FXL.
As the shutter-speed increases, Eq. [2] describes a non-linear [CR]-dependence. The CR concentration is implicit in Eq. [2] as R1o = r1o[CRo] + R1o0: the FXL condition is assumed for the extracellular 1H2O system. Thus, the shutter speed T1−1 is greater when [CRo] and/or r1o are greater, because R1i remains unchanged. For many years, it has been almost universally assumed that monomeric Gd3+ chelate CRs have such small r1o magnitudes that no practical [CRo] value achieved in vivo is large enough to move the blood 1H2O system out of the FXL condition (13–15).
However, some newer GBCR’s interact with proteins. While a CR molecule is “bound” to a macromolecule, its tumbling speed is significantly reduced and the dipolar interaction between Gd3+ unpaired electrons and water hydrogen nuclear proton spins is much more effective. This causes an increased relaxivity, r1o (4,16–19). In general, there can be many different CR binding sites on each protein molecule, each with its own relaxivity (17). If one makes the simplifying assumption of an effective 1:1 CR:macromolecule stoichiometry, the relaxation rate constant for the CR-containing compartmental 1H2O is given by Equation [4] (16):
| [4] |
where r1f and r1b are the unbound and bound CR relaxivities, respectively, [CR] is the free CR concentration, and [CRM] that of macromolecule-bound CR. This is the FXL equation for the system of CR exchanging on and off the macromolecule, M. Thus, r1b and [CRM] are the weighted average values for the bound relaxivities and CR concentrations in the different binding sites. For the 1:1 binding simplification, the equilibrium [CR] and [CRM] values of Eq. [4] can be written in terms of the total CR and macromolecule concentrations, [CRT] and [MT], respectively, and the mean equilibrium constant for binding, Kb (16) (Appendix 2). The interaction of such CRs with serum albumin in the blood plasma will increase their averaged relaxivity values. Thus, there is a chance that the shutter-speed, T1−1, will be increased toward the (1/τi + 1/τo) value [which is fixed near 160 s−1 by the physiological temperature, metabolic state, and hematocrit (Eqs. [2b, 2c])], and the blood 1H2O signal will depart the FXL for the FXR condition. If this departure is significant, Eqs. [1] and [3] will not be valid. Equation [2], however, spans both the FXL and FXR conditions.
To accurately characterize GBCR relaxivity in physiologic whole blood, this study measured R1 associated with two “high relaxivity” reagents that bind/interact with serum albumin: gadobenate dimeglumine (MultiHance (MH); Bracco Imaging SpA, Milan, Italy) and gadofosveset trisodium (Ablavar (AB); Lantheus Medical, Billerica, USA); and two reagents that do not bind/interact with serum albumin: gadobutrol (Gadavist (GV); Bayer Healthcare, Leverkusen, Germany) and gadoteridol (ProHance (PH); Bracco Imaging SpA, Milan, Italy). These GBCRs were mixed in ex vivo whole human blood and plasma, and studied at both at 1.5 and 3.0 T. The measurements were performed under physiologic conditions and over a [CR] range spanning that of first-pass CE-MRA. The measured relaxation rates in whole blood were compared to those predicted by water exchange (Eq. [2]). The plasma relaxation rate constants were parameterized using the 1:1 stoichiometry binding model and used as empirical input to the water exchange prediction.
Methods
Sample Preparation
All experiments were performed with local institutional review board approval. Whole human blood from a single donor was obtained from the local blood bank, and the albumin concentration was measured in the laboratory. Blood was oxygenated with 95% O2 and 5% CO2 mixture via a bubble diffuser and placed in 6-mL HDPE tubes (13 mm I.D.). These were embedded in 2% agar gel (Cat. no. S70210A, Fisher Scientific, Pittsburgh, USA) in two separate 35-tube phantoms. This allowed simultaneous measurement of the samples in each tray. The four contrast reagents (PH, GV, MH, and AB) were added in 10 different concentrations (1, 2, 3, 4, 5, 6, 8, 10, 14, and 18 mM, measured per volume of whole blood) each, and the tubes sealed. Contrast agents were added in their respective formulary concentrations (AB: 0.25M, PH and MH: 0.5M, and GV: 1.0M), with whole blood then added to total volume of 6 mL. The associated, relatively small (<12%) increases in extracellular volume fractions due to the varying volumes of contrast solution added to each sample were accounted for in the analysis. The (30) remaining tubes were filled with saline or blood control samples. The phantoms were warmed to 37°C for the experiments and periodically mixed by inverting the samples between acquisitions until the whole blood measurements were completed. Following these measurements, the samples were set aside without movement for six hours to allow sedimentation of the red blood cells from the plasma, and the relaxation measurements were repeated for the plasma supernatant. Blood lab analysis (including oximetry) was performed before and after the whole blood relaxation measurements.
MR acquisitions
Relaxation measurements were performed using 1.5 and 3.0 T whole body scanners (Achieva, Philips Healthcare, Best, The Netherlands) and an 8-channel SENSE head RF coil for signal reception. R1 was measured using an inversion-recovery (IR) Look-Locker pulse sequence with TR = 1 s, ΔTI = 4.8 – 5.0 ms, TE = 1.9 ms, flip angle = 8°, and number of averages = 3. Additional scan parameters were: matrix, 100 × 152; voxel size 2.0 mm × 1.0 mm × 3.0 mm; field of view, 200 mm × 152 mm; bandwidth, 1230 Hz/pixel. Average signal intensities from a region-of-interest (ROI) placed within each tube were fitted with mono-exponential recovery curves using non-linear least squares (Matlab, Mathworks, Natick, MA, USA) to yield the effective R1. The standard Look-Locker correction was applied to obtain the ROI R1 value in the absence of RF read excitation (20).
Fitting plasma relaxivity and predicting blood R1 values
Plasma r1 for PH and GV were determined by linear least squares fittings of their 1H2O R1 [CR]-dependences (Eq. [1]) with fixed R10 values of 0.8 and 0.6 s−1 for 1.5 and 3.0 T, respectively. For MH and AB, the data were fitted with the 1:1 albumin binding model (Eqs. [4] and [A2–5]). This utilized the analytical [albuminT] value, 0.497 mM, Kb values of 1.5 mM−1 for MH (19) and 12.5 mM−1 for AB, approximately accounting for all the binding interactions reported by Caravan et al. (17), and fixed R10 values of 0.8 and 0.6 s−1 for 1.5 and 3.0 T, respectively.
The [CR]-dependence of whole blood 1H2O R1 was predicted using Eq. [2]: with the fitted plasma R1p [CR]-dependence as the [CRo]-dependence of R1o, τi = 10 ms, the analytical hematocrit fraction (0.36; adjusted for the added extracellular volume introduced by the contrast reagent solution) as pi, and R1i fixed at 0.8 and 0.6 s−1 for 1.5 and 3.0 T, respectively.
Results
Laboratory Analyses of Whole Blood Samples
After oxygenation of the blood and prior to the relaxation measurements, blood lab analyses measured: pH, 7.0; albumin, 3.3 g/dL [= 0.497 mM]; hematocrit, 36%; pO2, 169 mmHg; and sO2, 97.3%. After whole blood relaxation measurements, oximetry yielded: pO2, 197 mmHg; and sO2, 97.9%.
Plasma 1H2O R1 [CR]-Dependence: the plasma 1H2O Look-Locker IR ROI data are distinctly mono-exponential (see below). The dependences of plasma 1H2O R1p on PH and GV concentrations were well fitted as linear (Eq. [1]) with r1 values of 4.0 and 4.4 s−1mM−1, respectively at 1.5 T, and 3.7 and 3.9 s−1mM−1, respectively at 3.0 T. The results are shown in Figure 2a – 2d: [CRT] is mmol(CR)/L(plasma) in these cases. These r1 data values are in good agreement with literature values for PH and GV at physiologic temperature and these field strengths (4,5).
Figure 2.

Contrast reagent concentration [CR]-dependence of plasma 1H2O R1 (R1p) at 37°C and two field strengths. Circles give the measured R1 values, and error bars the confidence intervals for the mono-exponential fittings of inversion-recovery data. Solid curves represent linear non-binding fittings (Eq. [1]) for gadoteridol (PH) and gadobutrol (GV), and non-linear protein-binding fittings (Eq. [4]) for gadobenate (MH) and gadofosveset (AB) (parameter values given in the text). The dashed ordinate asymptotes illustrate the MH and AB non-linearity at small [CRT] values, and the relaxivity (r1) values (slopes) that would result from linear fitting of only low [CRT] data.
The plasma 1H2O R1 MH and AB concentration-dependences are non-linear; especially at very small [CRT] values (16–19). These were fitted using the 1:1 binding model (Eqs. [4] and [A2–5]): with [MT] = 0.497 mM, Kb = 1.5 and 12.5 mM−1 for MH and AB, respectively, and fixed R10 values of 0.8 and 0.6 s−1 for 1.5 and 3.0 T, respectively. The fittings are shown in Figs. 2e – 2h. They match the data (circles) very well, and returned r1f/r1b values of 5.1/18.1 and 9.2/48.3 s−1mM−1, respectively, for MH and AB at 1.5 T, and 4.6/12.1 and 7.0/15.6 s−1mM−1 at 3.0 T. As averaged binding site relaxivities, these are in good agreement with literature values considering field strength differences (16–19). The dashed ordinate asymptotic straight lines are shown in Figs. 2e – 2h. These illustrate clearly the model non-linearities below approximately 1 mM CR. We did not make measurements in this small [CR] region because we wanted to cover the greater range employed for CE-MRA. However, others have reported the non-linear plasma 1H2O behavior with small [MH] (19) and [AB] (17) values. The curvature occurs at low [CRT] because [MT] is only 0.5 mM: the primary albumin CR binding sites become occupied at quite small [CRT] values. The instantaneous slope of the R1vs. [CRT] plot represents the relaxivity (r1), and it is clear that r1 is [CR]-dependent in the MH and AB cases. If one studied only small [CR] values, and used the asymptotic slopes, one would obtain very large r1 values indeed (dominated by r1b) for these “high-relaxivity” reagents. The slopes at larger [CRT] values are not very different from those of PH and GV, because they are dominated by r1f. As stated above, one could analyze the plasma 1H2O R1 [CR]-dependence with more complicated binding stoichiometry models (17): our Kb = 12.5 mM−1 is actually the sum of AB step-wise Kb values, since we go to such large [CRT] values. With these, one could extract r1 values for various different M-CR binding sites. However, for our purpose, the excellent descriptions of the experimental plasma 1H2O R1 data by either the linear, non-binding model (Eq. [1]) in the cases of Figs. 2a – 2d, or the non-linear, albumin-binding model (Eq. [4]) in the cases of Figs. 2e – 2h are perfectly sufficient. Although they are quite analytical fittings, they can be considered empirical fittings for our next step.
Whole Blood 1H2O R1 [CR]-Dependence
Examples of whole blood 1H2O Look-Locker IR ROI data are shown in Figure 3. These are results for [ABT] values (mmol(AB)/L(blood)) ranging from 1 to 18 mM. Semi-log plots of the [M0 − M(tI)/M1] inversion time (tI) dependence are presented. The data (symbols) are fitted with a single-exponential IR expression having M0, M1, and R1b as variables. It is important to note the linearity of the data down to the noise threshold (~0.01). This demonstrates that the recoveries are mono-exponential: the R1b quantities are single-valued. The fitting-returned values for R1 are displayed in Fig. 2 (plasma) and Figure 4 (blood).
Figure 3.

Examples of whole blood 1H2Ob Look-Locker ROI inversion-recovery signal intensity, M(tI), data (symbols), plotted as (M0 − M(tI))/M1 (M0 and M1 represent the magnetization at equilibrium and deviation from equilibrium immediately after inversion, respectively). Results are shown for 1, 2, 4, 8, and 18 mM AB, [ABT], at 3.0 T. Note the linearity of the data down to the noise threshold (~0.01), indicating mono-exponential recovery. The slopes of the fits correspond to R1, and are displayed in Fig. 2 (plasma) and Fig. 4 (blood).
Figure 4.

[CR]-Dependence of whole human blood 1H2O R1 (R1b) (at 37°C, sO2 98%, pH 7.0, and two different field strengths) for gadoteridol (PH), gadobutrol (GV), gadobenate (MH), and gadofosveset (AB). Circles give the measured R1 values and error bars the confidence intervals for mono-exponential fittings of inversion-recovery data. The solid curves are a priori predictions using the two-site-exchange Eq. [2] (parameter values are given in the text). Not being data fittings, the curves provide remarkably accurate predictions of the measurements. The dot-dashed lines are predicted by the fast-exchange-limit (FXL) Eq. 3. There is clear, systematic, deviation from the FXL prediction, most pronounced for MH and AB.
In blood, there are two compartments, in which the CR and water molecules are not homogeneously distributed. Thus, the Fig. 3 mono-exponential recoveries mean that the exchange MR system is in the FXL or the FXR condition. It does not reach the slow-exchange-regime (SXR) condition, even at 18 mM [ABT]. If it did, one would observe curvature beginning near log[M0 − M(tI)/M1] ~ pi (in this study, pi = 0.36) (21): this is the definition of the SXR condition (12). Thus, one important question is whether the whole blood 1H2O signal falls into the FXL or the FXR condition? As justified above, since the 2SX Eq. [2] spans FXL and FXR, one must use it to describe the [CRT]-dependence of blood 1H2O R1b. The measured blood hematocrit fraction (0.36, with correction for added extracellular volume due to each contrast reagent solution) was set equal to pi, τi was taken as 10 ms, R1i was fixed at 0.8 and 0.6 s−1 for 1.5 and 3.0 T, respectively, and the fitted plasma 1H2O R1 vs. [CRT] curves for each of the four contrast agents at each field strength (Fig. 2) were used for the [CRo]-dependences of R1o. The blood 1H2O R1b [CRT]-dependence curves predicted by Eq. [2] are shown (solid) in Fig. 4: here, [CRT] is mmol(CR)/L(blood). They agree with the data (circles) very well. It is important to note that these curves are not fittings: no parameters were varied. They are predictions based on the literature parameter values and our empirical plasma data: making the results all the more compelling. With actual fittings, the agreement would be even better. The dot-dashed lines display the predicted R1 = f([CRT]) if the FXL Eq. [3] is assumed. A similar result would be predicted by allowing τi to become vanishingly small in Eq. [2]. These do not agree with the data in any case, and especially not for MH and AB.
Discussion
As expected, plasma 1H2O relaxation rate constants increased linearly with PH and GV concentrations (Figs. 2a – 2d). The observed relaxivities (slopes) (4.0 and 4.4 s−1mM−1 at 1.5 T, and 3.7 and 3.9 s−1mM−1 at 3.0 T, respectively) are slightly lower than values (4.1 and 5.2 s−1mM−1 at 1.5 T, and 3.7 and 5.0 s−1mM−1 at 3.0 T, respectively) reported elsewhere over a smaller [CR] range (0.25 to 0.5 mM) (4). This discrepancy may be related to very weak protein interactions that are more apparent over the smaller [CR] range (22). For MH and AB, the [CR]-dependence is distinctly non-linear (Figs. 2e – 2h). This is due to stronger binding of these reagents to plasma albumin. The effective 1:1 stoichiometric binding model (Eq. [4]) provides a parameterization of the non-linear behavior that can be used for predicting whole blood 1H2O R1 [CR]-dependency. Determination of true binding affinities and site relaxivities requires a multiple binding stoichiometry model. This has been performed elsewhere for AB (17). The application of the effective 1:1 binding model here yields a more abrupt “break” in the theoretical curve at [CRT] = [MT] = 0.50 mM for AB (Figs. 2g and 2h) than for MH (Figs. 2e and 2f), as the value of Kb is much greater for AB than for MH. More accurate characterization of the binding effects would require additional data points at lower concentrations but this was not the purpose of our study.
We believe the effective 1:1 binding model provides a sufficient description over the concentration ranges evaluated.
Contrary to the general expectation (13–15), constraint to the FXL condition (Fig. 4 dot-dashed lines) does not accurately describe the [CR]-dependence of whole blood 1H2O R1. This is particularly pronounced for MH and AB. While the PH and GV FXL lines match the data up to ~5 mM, the departure occurs at even lower concentrations for MH and AB. Generally speaking, departure from the FXL condition is quite evident whenever R1p surpasses ~25 s−1. However, the 2SX Eq. [2] with τi = 10 ms, pi = Hct/100, and R1o = R1p describes well the data for all CRs at both field strengths (Fig. 4 solid curves), even though it is not fitted to them. Since this formulation spans both the FXR and FXL conditions, it is only prudent to use Eq. [2].
Deviation from the FXL condition is more pronounced for contrast reagents with high plasma relaxivity (Fig. 4) because such agents produce larger extracellular relaxation rate constants at a given concentration. In this situation, blood 1H2O R1 values become influenced by the mean intracellular water molecule pre-exchange lifetime, τi. It has recently been shown that τi is dominated by active trans-membrane water cycling that is driven by active trans-membrane osmolyte cycling (21). This opens the exciting possibility that τi is a potential cellular metabolic activity imaging biomarker (23). In the current context, high relaxivity contrast agents may provide means for further study of erythrocyte metabolism. The question remains open as to why the red blood cell τi is anomalously small (7,24). To investigate further, equation [2] could be fitted to blood 1H2O R1 CR titration data (such as in Fig. 4) obtained under different metabolic conditions and/or enzyme inhibitor levels.
The non-linear [CR]-dependence of blood 1H2O R1 described here has important implications for the interpretation of image data obtained during GBCR first-pass. In particular, optimization of both CE-MRA and dynamic contrast enhanced (DCE) MRI data analyses for tissue perfusion quantification rely on accurate knowledge of the [GBCR] time-course during the first-pass. In CE-MRA, deliberate CR dose or injection rate modification to achieve the blood 1H2O R1 desired for optimal image quality requires knowledge of the [CR]-dependent r1 value. Quantitative DCE-MRI requires an accurate arterial input function (AIF ≡ [GBCRp](t)) (12).
Any non-linear [GBCR]-dependence of blood 1H2O R1 due to erythrocyte water exchange effects must obviously be taken into account.
To summarize, the longitudinal relaxation rate constant of the water proton MR signal was measured in human plasma and oxygenated (arterial) whole blood under physiologic conditions titrated with various concentrations (1 – 18 mM per whole blood volume) of four different GBCR’s. Because the GBCR molecules are confined to the extracellular space, the whole blood 1H2O R1 was influenced by the kinetics of water exchange between the plasma and intracellular spaces. At high GBCR concentrations, the R1 values were smaller than predicted by the fast-exchange-limit (FXL) despite the extremely rapid erythrocyte transcytolemmal water exchange. The non-linearity of the R1 [GBCR]-dependence at first-pass concentrations has important implications for CE-MRA and quantitative perfusion imaging using DCE. In addition, high relaxivity GBCR’s may serve as probes for erythrocyte transcytolemmal water exchange and cellular metabolic activity.
Acknowledgments
Grant Support: NIH RO1-NS40801, EB-11687, UO1-CA154602, and Philips Healthcare
The authors thank Eric Shankland, Ph.D. for valuable discussion regarding sample preparations. This work was supported in part by the Department of Veterans Affairs, Veterans Health Administration, Office of Research and Development.
List of Abbreviations
- CR
contrast reagent
- CE-MRA
contrast-enhanced MR angiography
- R1
longitudinal relaxation rate constant
- GBCR
gadolinium based contrast reagent
- SPGR
spoiled gradient echo
- R2*
transverse relaxation rate constant
- R10
relaxation rate constant in the absence of CR
- r1
longitudinal relaxivity
- r2
transverse relaxivity
- τi
mean intracellular residence time
- 2SX
two-site exchange
- FXR, FXL, SXR
fast-exchange-regime, -limit, slow-exchange-regime
- R1i, R1o
intracellular (i), extracellular (o, “outside”) rate constant
- τi, τo
intracellular (i), extracellular (o) characteristic water residence time
- pi,po
intracellular (i), extracellular (o) mole fraction (“population”)
- T1−1
shutter-speed
- r1o
extracellular (o) relaxivity
- [CRo]
extracellular (o) CR concentration
- R1o0
extracellular (o) rate constant in absence of CR
- r1f
unbound-CR relaxivity
- r1b
bound-CR relaxivity
- [CRM]
equilibrium concentration of macromolecule-bound CR
- [M]
equilibrium concentration of unbound macromolecules
- [CRT]
total CR concentration
- [MT]
total macromolecule concentration
- Kb
mean equilibrium constant for binding
- MH
gadobenate dimeglumine (MultiHance)
- AB
gadofosveset trisodium (Ablavar)
- GV
gadobutrol (Gadavist)
- PH
gadoteridol (ProHance)
- ROI
region-of-interest
- R1p
relaxation rate constant in plasma
- pO2
partial pressure of O2
- sO2
O2 saturation
- IR
inversion-recovery
- [ABT]
total concentration of AB
- tI
inversion time
- R1b
rate constant in blood
- Hct
hematocrit
- DCE
ynamic contrast enhanced
- AIF
arterial input function
Appendix 1. Longitudinal relaxation in the fast-exchange-limit
When water exchange in a two-compartment system is sufficiently rapid, that the system is well-characterized by mono-exponential longitudinal relaxation, the observed longitudinal relaxation rate constant R1 is given by Equation [A1-1]:
| [A1-1] |
where R1i and R1o are the intrinsic 1H2O relaxation rate constants and τi and τo are the characteristic residence times of water molecules inside and outside the compartment, respectively (10,11). This is Eq. [2] in the text, and can be rewritten as Equations [A1-2] and [A1-3].
| [A1-2] |
| [A1-3] |
Setting (R1i − R1o)2/(1/τi + 1/τo)2 = 0, the FXL condition (that is, the difference in relaxation rate constants is much less than the water exchange rate), yields Equation [A1-4].
| [A1-4] |
Then, using the relationship (1+x)1/2 = 1 + ½ x −…, for |x| < 1, also in the FXL, yields Equation [A1-5].
| [A1-5] |
This can be re-written as Equations [A1-6] then [A1-7].
| [A1-6] |
| [A1-7] |
And finally, using the equilibrium mass action relationships, pi/po = τi/τo and pi + po = 1, yields Equations [A1-8] then [A1-9].
| [A1-8] |
| [A1-9] |
For a two-compartment system in the fast-exchange-limit, Eq. [A1-9] describes the longitudinal relaxation rate constant as the population fraction-weighted average of the rate constants for the 1H2O signals from the two compartments. This result is used to describe the FXL condition in the text (Eq. [3]) and the dashed-dot lines in Fig. 4.
Note that the key assumption here is: (R1i − R1o)2/(1/τi + 1/τo)2 → 0 [ie., T1−1 ≪ (τi−1 + τo−1)]. This can happen because |R1o − R1i| → 0 or because τi (or τo) → 0. The biological intracellular τi values are fixed by the physiologic temperature, the one-dimensional cell size, and the cell membrane water permeability coefficient, Pw (21), the latter being dominated by active trans-membrane water cycling (21). It is important to realize, however, that τi (and τo) is always finite: the erythrocyte τi (10 ms) is anomalously small. Thus, the magnetic resonance FXL condition is realized in biology only where the shutter-speed T1−1 → 0, or is very small.
Appendix 2. The plasma 1H2O longitudinal relaxation rate constant dependence on the concentration of protein-binding contrast reagent assuming effective 1:1 binding stoichiometry
The binding equilibrium expressions are given in Equations [A2-1] – [A2-3]:
| [A2-1] |
| [A2-2] |
| [A2-3] |
where Kb is the mean binding constant, [CRT] is the total contrast reagent concentration, [CRM] is the equilibrium concentration of macromolecule-bound contrast reagent, [CR] is the equilibrium concentration of unbound contrast reagent, [MT] is the total macromolecule concentration, and [M] is the equilibrium concentration of unbound macromolecules.
Equations [A2-1] – [A2-3] can be combined as Equations [A2-4] and [A2-5].
| [A2-4] |
| [A2-5] |
Note that only one root of [A2-4] is valid. Combining Eqs. [A2-5], [A2-3], and [4] from the text, the plasma 1H2O relaxation rate constant can be written as a function of Kb, [CRT], [MT], r1f, and r1b. In this work, [CRT] and [MT] are known by composition. This result has been presented previously (16).
Footnotes
This work has been presented in part at the 21st Annual Meeting of the International Society for Magnetic Resonance in Medicine, Salt Lake City, UT, USA, April 2013.
References
- 1.Schneider G, Ballarati C, Grazioli L, Manfredi R, Thurnher S, Kroencke TJ, Taupitz M, Merlino B, Bonomo L, Shen N, Pirovano G, Kirchin MA, Spinazzi A. Gadobenate dimeglumine-enhanced MR angiography: Diagnostic performance of four doses for detection and grading of carotid, renal, and aorto-iliac stenoses compared to digital subtraction angiography. J Magn Reson Imaging. 2007;26(4):1020–1032. doi: 10.1002/jmri.21127. [DOI] [PubMed] [Google Scholar]
- 2.Maki JH, Springer CS, Jr, Woods M, Bastawrous S, Bhargava P, Kirchin MA, Wilson GJ. T1 and T2* Relaxation Rates of Four Gadolinium Based Contrast Agents in Whole Human Blood at First-Pass Concentrations: Non-linearities and Their Impact on Optimizing Contrast-Enhanced MRA. Proceedings of the 21st Annual Meeting of the International Society for Magnetic Resonance in Medicine; 2013; Salt Lake City, UT, USA. p. 1272. [Google Scholar]
- 3.Wilson GJ, Springer CS, Jr, Woods M, Bastawrous S, Bhargava P, Maki JH. High Concentration Relaxivities of Four Gadolinium-Based Contrast Reagents in ex vivo Physiologic Whole Blood and Plasma at 1.5 and 3.0T. Proceedings of the 21st Annual Meeting of the International Society for Magnetic Resonance in Medicine; 2013; Salt Lake City, UT, USA. p. 4459. [Google Scholar]
- 4.Rohrer M, Bauer H, Mintorovitch J, Requardt M, Weinmann HJ. Comparison of magnetic properties of MRI contrast media solutions at different magnetic field strengths. Invest Radiol. 2005;40(11):715–724. doi: 10.1097/01.rli.0000184756.66360.d3. [DOI] [PubMed] [Google Scholar]
- 5.Pintaske J, Martirosian P, Graf H, Erb G, Lodemann KP, Claussen CD, Schick F. Relaxivity of Gadopentetate Dimeglumine (Magnevist), Gadobutrol (Gadovist), and Gadobenate Dimeglumine (MultiHance) in human blood plasma at 0.2, 1. 5, and 3 Tesla. Invest Radiol. 2006;41(3):213–221. doi: 10.1097/01.rli.0000197668.44926.f7. [DOI] [PubMed] [Google Scholar]
- 6.Herbst MD, Goldstein JH. A review of water diffusion measurement by NMR in human red blood cells. Am J Physiol. 1989;256(5 Pt 1):C1097–1104. doi: 10.1152/ajpcell.1989.256.5.C1097. [DOI] [PubMed] [Google Scholar]
- 7.Kuchel PW, Benga G. Why does the mammalian red blood cell have aquaporins? Biosystems. 2005;82(2):189–196. doi: 10.1016/j.biosystems.2005.07.002. [DOI] [PubMed] [Google Scholar]
- 8.House CR. Water Transport in Cells and Tissues. Baltimore: Williams and Wilkins; 1974. [Google Scholar]
- 9.Hills BP, Belton PS. NMR Studies of Membrane Transport. Annual Reports on NMR Spectroscopy. 1989;21:99–159. [Google Scholar]
- 10.Woessner D. Nuclear Transfer Effects in Nuclear Magnetic Resonance Pulse Experiments. J Chem Phys. 1961;35:41–48. [Google Scholar]
- 11.Landis CS, Li X, Telang FW, Coderre JA, Micca PL, Rooney WD, Latour LL, Vétek G, Pályka I, Springer CS. Determination of the MRI contrast agent concentration time course in vivo following bolus injection: effect of equilibrium transcytolemmal water exchange. Magn Reson Med. 2000;44(4):563–574. doi: 10.1002/1522-2594(200010)44:4<563::aid-mrm10>3.0.co;2-#. [DOI] [PubMed] [Google Scholar]
- 12.Li X, Priest RA, Woodward WJ, Siddiqui F, Beer TM, Garzotto MG, Rooney WD, Springer CS. Cell membrane water exchange effects in prostate DCE-MRI. J Magn Reson. 2012;218:77–85. doi: 10.1016/j.jmr.2012.03.019. [DOI] [PMC free article] [PubMed] [Google Scholar]
- 13.Donahue KM, Weisskoff RM, Burstein D. Water diffusion and exchange as they influence contrast enhancement. J Magn Reson Imaging. 1997;7(1):102–110. doi: 10.1002/jmri.1880070114. [DOI] [PubMed] [Google Scholar]
- 14.Donahue KM, Burstein D, Manning WJ, Gray ML. Studies of Gd-DTPA relaxivity and proton exchange rates in tissue. Magn Reson Med. 1994;32(1):66–76. doi: 10.1002/mrm.1910320110. [DOI] [PubMed] [Google Scholar]
- 15.Wedeking P, Sotak CH, Telser J, Kumar K, Chang CA, Tweedle MF. Quantitative dependence of MR signal intensity on tissue concentration of Gd(HP-DO3A) in the nephrectomized rat. Magn Reson Imaging. 1992;10(1):97–108. doi: 10.1016/0730-725x(92)90378-d. [DOI] [PubMed] [Google Scholar]
- 16.Aime S, Chiaussa M, Digilio G, Gianolio E, Terreno E. Contrast agents for magnetic resonance angiographic applications: 1H and 17O NMR relaxometric investigations on two gadolinium(III) DTPA-like chelates endowed with high binding affinity to human serum albumin. J Biol Inorg Chem. 1999;4(6):766–774. doi: 10.1007/s007750050349. [DOI] [PubMed] [Google Scholar]
- 17.Caravan P, Cloutier NJ, Greenfield MT, McDermid SA, Dunham SU, Bulte JW, Amedio JC, Looby RJ, Supkowski RM, Horrocks WD, McMurry TJ, Lauffer RB. The interaction of MS-325 with human serum albumin and its effect on proton relaxation rates. J Am Chem Soc. 2002;124(12):3152–3162. doi: 10.1021/ja017168k. [DOI] [PubMed] [Google Scholar]
- 18.Laurent S, Elst LV, Muller RN. Comparative study of the physicochemical properties of six clinical low molecular weight gadolinium contrast agents. Contrast Media Mol Imaging. 2006;1(3):128–137. doi: 10.1002/cmmi.100. [DOI] [PubMed] [Google Scholar]
- 19.Henrotte V, Muller RN, Bartholet A, Elst LV. The presence of halide salts influences the non-covalent interaction of MRI contrast agents and human serum albumin. Contrast Media Mol Imaging. 2007;2(5):258–261. doi: 10.1002/cmmi.153. [DOI] [PubMed] [Google Scholar]
- 20.Look DC, Locker DR. Time Saving in Measurement of NMR and EPR Relaxation Times. Rev Sci Instrum. 1970;41:250–251. [Google Scholar]
- 21.Zhang Y, Poirier-Quinot M, Springer CS, Balschi JA. Active trans-plasma membrane water cycling in yeast is revealed by NMR. Biophys J. 2011;101(11):2833–2842. doi: 10.1016/j.bpj.2011.10.035. [DOI] [PMC free article] [PubMed] [Google Scholar]
- 22.Wang Y, Spiller M, Caravan P. Evidence for weak protein binding of commercial extracellular gadolinium contrast agents. Magn Reson Med. 2010;63(3):609–616. doi: 10.1002/mrm.22214. [DOI] [PubMed] [Google Scholar]
- 23.Pike MM, Jayatilake ML, Wang X, Lobo MR, Li X, Schabel MC, Rooney WD, Christensen DJ, Glickson JD, Sears RC, Huang W, Springer CS. Does DCE-MRI Have a Metabolic Dimension?. Proceedings of the 21st Annual Meeting of the International Society for Magnetic Resonance in Medicine; 2013; Salt Lake City, UT, USA. p. 3067. [Google Scholar]
- 24.Kuchel BW, Benga G. Why is the transmembrane exchange of water in the red blood cell so fast? Bull Mol Med. 2003;15–16:29–34. [Google Scholar]