

Abstract
2,3,7,8-Tetrachlorodibenzo-p-dioxin (TCDD or dioxin) disrupts craniofacial development in zebrafish larvae. However, the cellular changes responsible for the decreased jaw size remain poorly understood. We show that smaller jaw size is due to a decrease in both the size and number of chondrocytes in the developing craniofacial cartilages. TCDD was found to decrease ossification of osteoblasts in the perichondrium of craniofacial cartilages. We also discovered that TCDD caused clefting of the parasphenoid, an effect with similarity to TCDD-induced cleft palate in mice. Thus, dermal and perichondrial bone development of the craniofacial skeleton are clearly disrupted by TCDD exposure in the zebrafish larvae. This dysmorphic response of the zebrafish craniofacial skeleton after exposure to TCDD is consistent with findings demonstrating disruption of axial bone development in medaka and repression of sox9b in zebrafish.
Keywords: Dioxin, Sox9b, Aryl hydrocarbon receptor, Craniofacial cartilage, Zebrafish, Development, chondrocyte, Proliferation, Perichondrium, Dermal bone, Cleft parasphenoid
1. Introduction
Craniofacial malformations are a hallmark of TCDD developmental toxicity in fish, birds, and mammals (Couture et al., 1990; Henry et al., 1997; Thomae et al., 2005; Yeager et al., 2006). Mammals and other vertebrates often develop a cleft palate when exposed early in development to TCDD (Couture et al., 1990; Thomae et al., 2005; Yeager et al., 2006). Teleost fish are among the most sensitive species to TCDD toxicity, and exhibit a more pronounced response. TCDD exposure produces decreased jaw size and other craniofacial malformations in developing lake trout sac fry, and zebrafish embryos (Cook et al., 2003; Henry et al., 1997). In zebrafish, these malformations can be prevented by mutations in, or knockdown of, the aryl hydrocarbon receptor 2 (Ahr2) (Prasch et al., 2003).
Normal craniofacial development in zebrafish involves numerous signaling pathways. Originating in the pharyngeal endoderm, Runx3, Egr1, and Sox9b form a regulatory cascade that represses follistatin A. This cascade promotes growth and proliferation of cranial neural crest cell (cNCC)-derived chondrocytes (Dalcq et al., 2012). In normal development, the ceratohyal cartilage grows by a process called convergent extension whereby immature chondrocytes at the medial epiphysis of the ceratohyal cartilage comprise a population of cells that divide, intercalate, and elongate the cartilage (Shwartz et al., 2012).
As indicated above, the Sox9b transcription factor is involved in the normal growth and development of craniofacial cartilages in zebrafish (Yan et al., 2005). We know that TCDD repression of sox9b is a key element in producing craniofacial malformations (Xiong et al., 2008). We have recently constructed a sox9b:EGFP reporter fish, Tg(−2421/+29sox9b:EGFP) that aids the investigation of jaw development and understanding the effects of TCDD (Plavicki et al., 2014; Hofsteen et al., 2013)
Although fish have been shown to have a decreased jaw size after exposure to TCDD, the cellular cause of this is unknown. In this study we sought to determine whether the reduction in jaw size was due to reduced cell size, or number, and what specific cell types in the jaw were affected. Since medaka ossification markers are decreased after TCDD exposure in the cell-rich hyaline cartilage of the hypural plate (Dong et al., 2012), we expected to see a decrease in perichondrial ossification of craniofacial cartilages.
TCDD has been shown to cause cleft palate in mice and beak deformities in birds, yet little is known about potential effects of embryonic exposure to TCDD on the developing medial craniofacial dermal bones in fish. Therefore, we were also interested in determining whether the zebrafish could be used as a model for palate clefting caused by TCDD exposure. We focused on effects of TCDD on development of the parasphenoid, a dermal bone lying in a position similar to the palate of mammals (Swartz et al., 2011).
Here we report that TCDD decreased the size of the developing craniofacial cartilages by reducing both size, and number of chondrocytes within the cartilages. We also demonstrate that TCDD-induced craniofacial malformation in zebrafish includes reduced ossification of chondrocytes as they begin to form bone, and clefting of the parasphenoid.
2. Materials and methods
2.1. Zebrafish
All fish were from the AB background. Zebrafish of an AB background expressing the transgene, Tg(−2421−/+29sox9b:EGFP), were used in the perichondrium marker and proliferation assays. Adults were housed in 38 L glass aquaria with recirculating reverse osmosis water lightly buffered with Instant Ocean Sea Salts (60 mg/L; Aquarium Systems, Mentor, OH) and maintained at 27 °C. Embryos were housed in plastic plates with methylene blue added to the water (50 μM). Larvae were anesthetized with 0.8 mM tricaine (MS 222, Sigma) buffered to pH 7 in Tris for in vivo staining. Zebrafish were euthanized by tricaine overdose. Adhering to the National Institutes of Health’s Guide for the Care and Use of Laboratory Animals, all procedures involving zebrafish were approved by the Animal Care and Use Committee of the University of Wisconsin–Madison.
2.2. TCDD exposure of zebrafish embryos
Embryos were exposed to waterborne TCDD (>99% purity; Chemsyn, Lenexa, KS) at 1 ng (3.1 nM)/ml or vehicle (DMSO 0.1%) for 1 h in glass scintillation vials at 10 embryos per ml with gentle rocking (Antkiewicz et al., 2005). Each treatment group was considered an n = 1.
2.3. Staining cartilage and bone
Zebrafish cartilage was stained with alcian blue 8GX (Sigma–Aldrich, St. Louis, MO) as previously described (Walker and Kimmel, 2007). Briefly, embryos were anesthetized with Tricaine-S and fixed overnight in 4% paraformaldehyde (USB Corporation, Cleveland, OH). Larvae were dehydrated with graduated concentrations of ethanol, and stained with 0.02% Alcian blue in 70% ethanol with 200 mM MgCl2 in water overnight.
Alizarin red (A-5533; Sigma–Aldrich, St. Louis, MO) was used to stain developing bone within the cartilages. For ossification staining, the cartilage stain was supplemented with a final concentration of 0.007% Alizarin red.
In all cases the stains were neutralized with saturated sodium tetraborate and the embryos were digested with 1 mg trypsin/ml (T4799, Sigma). Stains were cleared with graded concentrations of glycerol in KOH: 20% glycerol/0.25% KOH; 50% glycerol/0.25% KOH; and 80% glycerol/0.1% KOH for storage.
For staining bone in live larvae, two methods were used. Zebrafish larvae, 144 hpf, were immersed in 0.2% calcein (C0875; Sigma) staining solution (adjusted to pH 7.2 with 0.5N NaOH) for 5 min, rinsed 5 times for 5 min with fish water, cleared 10 min in fresh fish water, and euthanized in a method described previously by Du et al. (2001). In a method adapted from DeLaurier et al. (2010), zebrafish larvae, 120 hpf, were transferred to egg water supplemented with 0.01 M HEPES and 0.006% Alizarin red overnight. At 144 hpf, they were rinsed 3 times in fish water (5 min/rinse), anesthetized, and imaged.
2.4. Immunohistochemistry
Euthanized zebrafish were fixed overnight at 4 °C with 4% paraformaldehyde in phosphate buffered saline (PBS), rinsed with PBS, and bleached with 0.9% H2O2 and 1% KOH, protected from light with foil, and placed on a rocking table for about 1.25 h, or until clear and rinsed five times for five minutes with PBS.
Fixed samples were immunostained as described previously (Dong et al., 2007; Plavicki et al., 2013). Samples were blocked overnight at 4 °C with PBS containing 0.3% Triton (PT, X-100, Sigma–Aldrich, St. Louis, MO) and 4% bovine serum albumin (PBT). Samples were incubated with the primary antibody in PBT overnight at 4 °C.
The primary rabbit IgG antibody against a mitotic marker, p-histone H3 (Ser-10, Hendzel et al., 1997), was purchased from Santa Cruz Biotechnology, Inc. Dallas, TX (sc-8656) and used at a 1:200 PBT dilution. The secondary antibody for the chondrocyte proliferation study was the goat anti rabbit highly cross absorbed Alexa Fluor 488 (2° Alexa Fluor® 488, Invitrogen, Carlsbad, CA). The secondary antibody for the perichondrial proliferation assay was the goat anti rabbit highly cross absorbed Alexa Fluor 568 (2° Alexa Fluor® 568, Invitrogen). The primary mouse antibody against collagen type II was purchased from the Developmental Studies Hybridoma Bank at the University of Iowa (II-II6B3) and used at a 1:20 PBT dilution. The secondary antibody for collagen II was a goat anti mouse Alexa Fluor 633 highly cross absorbed (2° Alexa Fluor® 633, Invitrogen).
Primary antibodies were diluted in PBT and tissue samples were covered in this solution. Samples were rinsed in PT overnight at 4 °C. Secondary antibodies were diluted in PBT (1:200) and covered with this solution overnight at 4 °C. Embryos were placed in 300 nM DAPI (4′,6-diamidino-2-phenylindole, 422,801, Biolegend, San Diego, CA) for more than 15 min or immediately mounted. Embryos were mounted in Vectashield with DAPI or Vectashield (Vector Laboratories, Burlingame, CA).
2.5. Imaging
Alcian blue and Alizarin red stains were imaged with a Zeiss Axioskop2 Plus microscope equipped with an Axiocam and differential/Nomarski interference contrast microscopy optics. Calcein stains were imaged with an Olympus DP72 digital camera on an Olympus S2 × 16 microscope with a GFP filter (excite, 470 nm; emit 525 nm). The proliferation assays and immunofluorescent stains were imaged with an Olympus Fluoview FV1000 confocal microscope. For both chondrocyte proliferation studies, about 70 optical sections at 1.5 μm intervals were collected, analyzed, and counted using FV10 ASW 1.7 Fluoview software with the appropriate filters for the secondary antibodies and EGFP expression in Tg(−2421/ + 29sox9b:EGFP) zebrafish. Fluorescent Alizarin red was imaged with an Olympus Fluoview FV1000 confocal microscope using a Texas Red filter (excite, 595 nm; emit, 615 nm).
2.6. Chondrocyte analyses
Chondrocyte length was determined by imaging and measuring the lengths of 5–10 chondrocytes per ceratohyal cartilage in Adobe Photoshop that spanned the entire width of the ceratohyal cartilage (Swartz et al., 2012). Alcian blue stained ceratohyal cartilages of 72 hpf zebrafish were used (DMSO vs. TCDD; 1 ng/ml; n = 4 / treatment; 1 fish per n). Chondrocyte numbers were determined by excising, imaging, and counting chondrocytes in Alcian blue stained Meckel’s and ceratohyal cartilages (Sarmah et al., 2010). Chondrocytes not in the field of view of the image also were counted, recorded at the microscope, and added to the total number of chondrocytes for the image (DMSO vs. TCDD; 1 ng/ml; n = 4 / treatment; 2 fish per n). Only cartilages with chondrocytes in the posterior plane were counted, because counting stacked chondrocytes underestimates their total number.
To assess chondrocyte and perichondrial cell proliferation, two investigators, blinded to the identity of the treatment groups, independently scored a stack of 60 images. Cells clearly in anaphase or telophase were counted as a single dividing cell. The mean of the two independent scores of proliferating chondrocytes within an individual ceratohyal cartilage in each treatment group was obtained. A proliferation index was calculated by dividing the total number of chondrocytes by total number of proliferating cells. Chondrocytes were identified by their morphology in the visual field and by DAPI staining (DMSO vs. TCDD; 1 ng/ml; n = 6 / treatment; 10 fish per n). In the perichondrial proliferation study, proliferating perichondrial cells were identified as having co-localized mitotic marker and EGFP directly adjacent to ceratohyal chondrocytes identified by morphology (DMSO and TCDD 1ng/ml; n = 3/treatment; 20 fish per n).
2.7. Statistical analyses
Numerical data analysis was computed using Microsoft® Excel. Results are expressed as mean ± SE. P-values were calculated using a two-tailed Student’s t-test, and mean differences between vehicle and TCDD treatment groups were considered significant at p ≤ 0.05.
3. Results
3.1. TCDD decreases craniofacial cartilage size
Zebrafish embryos were exposed to either TCDD or vehicle at 4 h post fertilization (hpf) and cartilages were stained with Alcian blue at 120 hpf (Fig. 1). Representative images show that all craniofacial cartilages were present in both TCDD and DMSO (vehicle control) treatment groups at 120 hpf (Fig. 1A and B). However, tracings of individual cartilages clearly show that the basihyal, ceratohyal, Meckel’s, palatoquadrate, and ceratobranchial cartilages were all reduced in size in the TCDD group compared to the controls (Fig. 1C and D).
Fig. 1.

TCDD reduces the size of craniofacial cartilages in the zebrafish larva.
Alcian blue was used to visualize cartilage growth in the ventral craniofacial cartilages of 120 hpf zebrafish larvae exposed to vehicle or TCDD (1 ng/ml) at 4 hpf. The panels show whole mounted specimens (A and B), and their traces (C and D) for easy identification. These panels illustrate the decrease in size of zebrafish craniofacial cartilages after exposure to TCDD (B and D) compared to vehicle (A and C). The ceratohyal cartilages are highlighted in blue for reference in the lower panels. Abbreviations are: bh, basihyal; cb 1–5, ceratobrachials; ch, ceratohyal; Me, Meckel’s; pq, palatoquadrate. Bars = 100 μm.
In previous work, it was shown that TCDD produces a measurable reduction in the size of the ceratohyal cartilages, highlighted in blue in Fig. 1C and D (Xiong et al., 2008). We examined the effect on the ceratohyal cartilages in more detail to better understand why these cartilages are smaller after TCDD exposure.
3.2. TCDD decreases chondrocyte size
We hypothesized that the reduction in cartilage size was due to the formation of smaller individual chondrocytes. To assess columnar chondrocyte length, Alcian blue stained ceratohyal cartilages from 72 hpf TCDD- and vehicle-exposed zebrafish were imaged at 40x from a ventral view, showing the columnar cells from the side (Fig. 2). Chondrocytes were still stacked, but they appeared smaller in the TCDD group. This suggests an effect on size, but minimal impact on the cellular organization of this cartilage (Fig. 2).
Fig. 2.
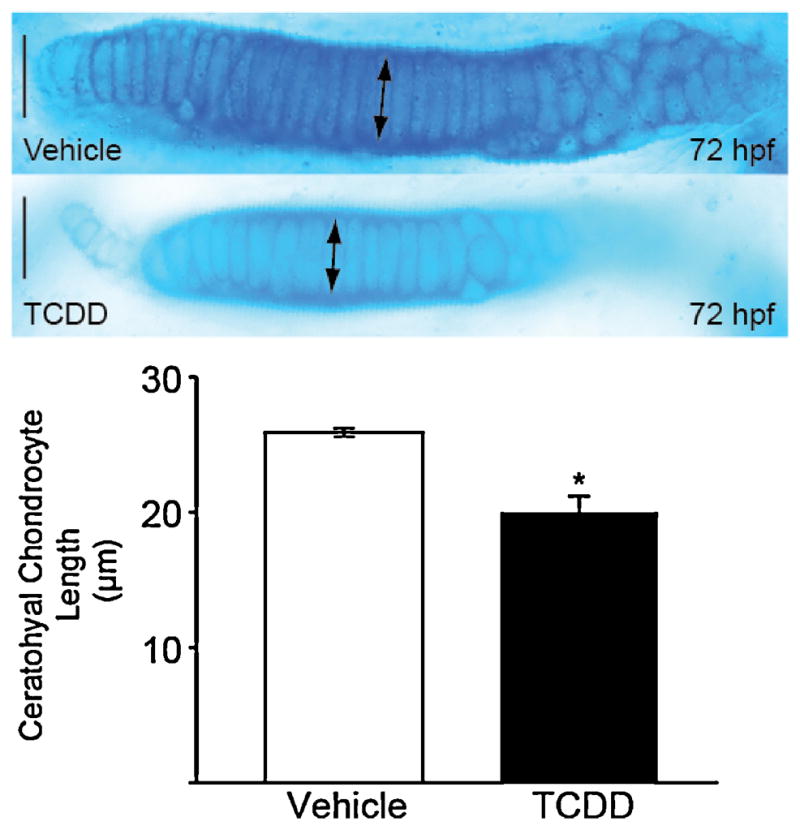
TCDD reduces the length of chondrocytes in the ceratohyal cartilage of the zebrafish larva.
Zebrafish exposed to TCDD or vehicle at 4 hpf were stained with Alcian blue at 72 hpf as described in the Methods. The ventral view of the ceratohyal cartilage shows that chondrocytes intercalate in the ceratohyal cartilages of TCDD- and vehicle-exposed groups. Ceratohyal chondrocytes from TCDD-exposed groups had a mean length of 20.7 μm compared to a mean length of 26 μm in the control groups. The asterisk indicates p < 0.05 (n = 4). Midline is to the right. Bars = 25 μm.
To quantify chondrocyte size, the lengths of ceratohyal chondrocytes were measured in cartilages from the two groups using digital imaging, as described in the Methods (Fig. 2). Chondrocyte length was significantly decreased in TCDD-treated larvae compared to control (Fig. 2; p < 0.05). Consistent with the macroscopic view in which the cartilages are still present but reduced in size, we found smaller chondrocytes with relatively normal stacked columnar organization.
3.3. TCDD decreases chondrocyte number
We also hypothesized that the cartilages are smaller because TCDD exposure reduces chondrocyte number. To test this, we exposed zebrafish embryos at 4 hpf to 1 ng/ml of TCDD or vehicle and stained them with Alcian blue at 72 hpf. During this time frame, ceratohyal cartilages are made up of a relatively small number of chondrocytes that grow rapidly. We found that observing the columnar chondrocytes end-on was the most effective for counting cells. The excised ceratohyal cartilages were oriented for a posterior view, and a chondrocyte was defined by a ring of dark Alcian blue staining surrounding a more lightly stained cell interior (Fig. 3). It was readily apparent that TCDD-treated larvae had significantly fewer chondrocytes in the ceratohyal cartilage than control (Fig. 3, p ≤ 0.01). Using a similar approach to count cells in Meckel’s cartilage (not shown), we found a significant reduction in the number of chondrocytes caused by TCDD exposure (97 ± 2.4 TCDD vs. 122 ± 2.8 control; p ≤ 0.01).
Fig. 3.
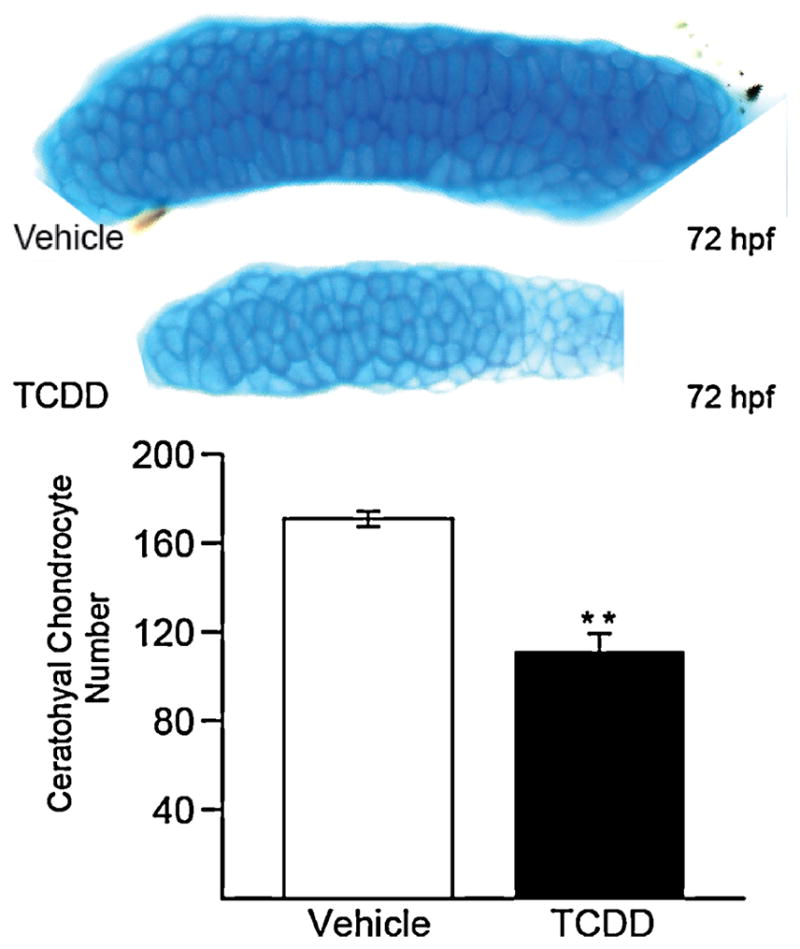
TCDD reduces the number of chondrocytes in the ceratohyal cartilage of the zebrafish larva.
Zebrafish exposed to TCDD or vehicle at 4 hpf were stained with Alcian blue at 72 hpf as described in the methods. The ventral view of the ceratohyal cartilage shows that chondrocytes intercalate in the ceratohyal cartilages of TCDD- and vehicle-exposed groups. Ceratohyal chondrocytes from TCDD-exposed groups had a mean length of 20.7 μm compared to a mean length of 26 μm in the control groups. The asterisk indicates p < 0.05 (n = 4). Midline is to the right. Bars = 25 μm.
3.4. TCDD tends to decrease chondrocyte proliferation
The finding that the ceratohyal and Meckel’s cartilages have fewer cells suggests that chondrocyte proliferation is reduced. This could at least partially explain the reduction in cartilage size. To test this, we exposed zebrafish to TCDD or vehicle as before, and collected the embryos at 72 hpf for phosphohistone H3 immunostaining, revealing mitotic cells (Fig. 4). As shown, the number of cells undergoing mitosis in each cartilage is quite low for either treatment group. This meant that a large number of cartilages were examined in order to get quantitative results. Chondrocytes in the cartilage were identified by their morphology combined with DAPI staining. The antibody marking dividing chondrocytes fluoresces green, and only a small number of chondrocytes were dividing in either treatment group. More specifically, 0.5% of chondrocytes were dividing per ceratohyal cartilage in DMSO treated larvae compared to 0.3% in TCDD (Fig. 4; n = 6, 10 fish per n, p = 0.13).
Fig. 4.
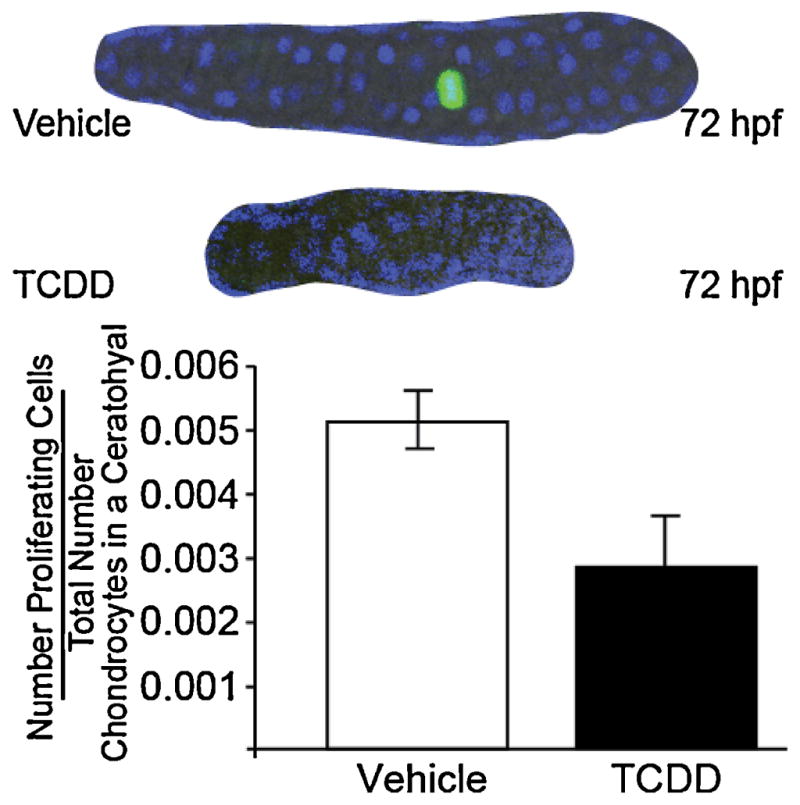
TCDD tends to reduce the proliferative index of chondrocytes in the ceratohyal cartilage of the zebrafish larva.
Embryos were exposed to TCDD or vehicle at 4 hpf and allowed to grow to the age of 72 hpf. Embryos were immunostained against p-histone H3 (Ser-10) labeling mitotic cells with green fluorescence. Nuclei are blue from DAPI staining. Representative single plane confocal microscopy images of ceratohyal cartilages are shown with the midline to the right.
3.5. A sox9b reporter fish expresses EGFP in the perichondrium
We hypothesized that exposure to TCDD would decrease the number of pharyngeal endoderm cells lying peripheral to the chondrocytes in the ceratohyal cartilages. These cells control cranial neural crest-derived chondrocyte growth and proliferation (Dalcq et al., 2012; Yan et al., 2005), and we know that reduction of sox9b expression in the jaw is necessary and sufficient to produce the craniofacial malformations produced by TCDD (Xiong et al., 2008).
To test this we made use of a newly derived reporter line Tg(−2421/+29sox9b:EGFP) that expresses EGFP from sox9b promoter elements (Plavicki et al., 2014; Hofsteen et al., 2013), and co-stained for collagen 2a1 to mark the chondrocytes. Consistent with previous reports that sox9b is expressed in the pharyngeal endoderm (Dalcq et al., 2012; Yan et al., 2005), we found EGFP expressed in perichondrial cells surrounding the immunostained collagen 2a1-expressing craniofacial cartilages, (Fig. 5A and B). At 72 hpf, we discovered sox9b:EGFP reporter expression in endoderm-derived perichondrial cells surrounding the Meckel’s, ceratohyal, and palatoquadrate cartilages. Interestingly, collagen2a1 expression in sox9b positive perichondrial cell was localized to the side of the perichondrium that formed an interface with chondrocytes (Fig. 5, arrows in boxes).
Fig. 5.

A sox9b:EGFP transgenic zebrafish marks regions of sox9b expression in the perichondrium.
A transgenic, Tg(−2421/+29sox9b:EGFP), zebrafish was used to mark perichondrial cells surrounding chondrocytes. Chondrocytes were co-stained with an antibody against col2a1, labeling chondrocytes as blue. Note expression of EGFP at 72 hpf in cells that surround the region of col2a1 staining in Meckel’s cartilage (Me, panel A), ceratohyal cartilage (ch, panel B), and the palatoquadrate cartilage (pq, panel B). Boxes show these regions in greater detail. Representative single plane confocal microscopy images are shown.
3.6. TCDD exposure decreased proliferation of perichondrial cells after pharyngeal arch restriction
We hypothesized that exposure to TCDD after cranial neural crest cell migration would decrease proliferation of pharyngeal endoderm cells. As EGFP was poorly expressed within the chondrocytes, this sox9b reporter provided a tool for easily identifying perichondrial cells in proliferation assays. We exposed the reporter line of zebrafish to TCDD or vehicle and measured proliferation with immunostaining for phosphohistone H3 as before. We wanted to distinguish effects on perichondrial division and possible inhibition of neural crest migration, so in contrast to the previous experiments, we waited until 26 hpf before exposing embryos to TCDD. By administering TCDD or vehicle at 26 hpf, initial condensation populations would have completed migration, ruling out decreased neural crest migration as a cause of malformation.
The fish were collected at 72 hpf, and immunostained for phosphohistone H3. The EGFP signal was used to detect cells peripheral to the chondrocytes. Our results show that there were fewer proliferating cells within the pharyngeal endoderm from TCDD-exposed samples than in the controls (Fig. 6; p < 0.05). This TCDD-induced decrease in perichondrial cell proliferation is associated with a decrease in size and number of chondrocytes in the cartilages.
Fig. 6.

TCDD exposure, beginning after pharyngeal arch restriction at 26 hpf, reduces ceratohyal perichondrial cell proliferation in the zebrafish larva.
Tg(−2421/+29sox9b:EGFP) embryos were exposed to TCDD or vehicle after pharyngeal arch restriction at 26 hpf and allowed to grow to the age of 72 hpf. Embryos were immunostained against p-histone H3 (Ser-10) labeling mitotic cells with red fluorescence (Alexa fluor 568). Dividing perichondrial cells were identified by the presence of both EGFP and red fluorescence (arrow). Representative single plane confocal microscopy images of ceratohyal cartilages are shown with the midline to the right. The asterisk indicates p < 0.05 (n = 3, 20 fish per n, p value < 0.05).
While this result is consistent with reduced proliferation in the TCDD-treated embryos, and with the reduced number of chondrocytes, it must be qualified due to a number of factors. First, because we found very few mitotic cells, proliferation was difficult to measure. Second, the conditions that we used for staining made it difficult to count the individual perichondrial cells. For example, we had difficulty getting clearly defined DAPI staining. Therefore, the results are presented per cartilage rather than as a mitotic index of mitotic cells per cell. Finally, because the TCDD-treated cartilages are reduced in size, it seems reasonable to suspect that the number perichondrial cells present was lower at the time of staining. With a smaller pool of cells, the number of dividing cells would be reduced even if TCDD had no effect on the mitotic index.
Nonetheless, from the simple standpoint of adding cells to grow the perichondrial population and thus the cartilage, we found that the process as a whole was considerably faster in the control group than in the TCDD-exposed group. This difference in rate of cell division per cartilage would contribute to the reduction in perichondrial cell number and cartilage size.
3.7. A sox9b:EGFP transgenic fish reports prior sox9b expression in osteoblasts
Because sox9b expression is required for proper bone development in vertebrates (Cheng and Genever, 2010; Flores et al., 2004; Zhou et al., 2006), we hypothesized that the EGFP would be expressed in our reporter strain in cells destined to become osteoblasts. At 144 hpf, We found EGFP in the perichondrium of the ceratohyal, Meckel’s, and palatoquadrate cartilages (Fig. 7). Co-staining for calcium in bone matrix with Alizarin red (DeLaurier et al., 2010) showed that ossification of craniofacial bones has begun by 144 hpf (Fig. 7A and B). Furthermore, Figs. 7A and B show overlapping Alizarin red and EGFP signal in dentary, quadrate, and ceratohyal bone at this time (Fig. 7 arrows in boxes). This indicates that the reporter marks presumptive ossification sites in the jaw.
Fig. 7.

Colocalization of sox9b:EGFP signal with developing osteoblasts at 144 hpf.
Tg(−2421/+29sox9b:EGFP) zebrafish were collected at 144 hpf and stained for calcification using Alizarin red as described in the Methods. As shown, EGFP was observed in the perichondrium of the ceratohyal, Meckel’s, and palatoquadrate cartilages (inserts). Alizarin red stained bone matrix was found in the perichondrium. (A) Ossification in developing Meckel’s/dentary, palatoquadrate/quadrate cartilage and bone. (B) Ossification in perichondrium of developing ceratohyal/ceratohyal cartilage and bone. Boxes show these regions in greater detail. The abbreviations are: ch, ceratohyal; chb, ceratohyal bone; d, dentary; Me, Meckel’s; pq, palatoquadrate; and q, quadrate.
3.8. TCDD reduces ossification of craniofacial osteoblasts
Although Alazarin red stains well-ossified cartilages quite well, we found that calcein produced a stronger, more sensitive signal, and that it could be used in vivo. We used in vivo calcein staining, marking osteoblasts, and bone in live zebrafish (Du et al., 2001; Haga et al., 2010), to determine whether TCDD exposure inhibits ossification of the jaw cartilages. In control zebrafish embryos at 144 hpf, we found clear calcein staining in ceratohyal, dentary, and quadrate bone in whole mount live fluorescent images (Fig. 8). In striking contrast, exposure to TCDD dramatically reduced calcein staining, indicating a loss of ossification in craniofacial dermal and perichondrial dermal bone, as well as in opercles (Fig. 8).
Fig. 8.
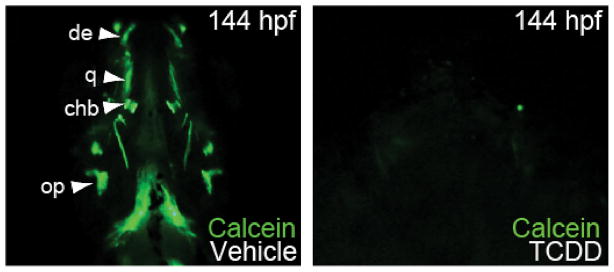
TCDD reduces ossification of developing craniofacial bone.
Embryos were exposed to TCDD or vehicle at 4 hpf, allowed to grow to 144 hpf, and stained with calcein as described in the methods. Calcein identifies ossification by fluorescing green in the presence of calcium in developing zebrafish. Vehicle-exposed larvae show perichondrial ossification in the dentary of the Meckel’s cartilage, the ceratohyal bone of the ceratohyal, and the quadrate of the palatoquadrate. Craniofacial bones of TCDD-exposed zebrafish fail to ossify (n = 3, 2 replicates, 10 fish each). Abbreviations are: ch, ceratohyal; chb, ceratohyal bone; d, dentary; Me, Meckel’s; op,opercle; pq, palatoquadrate; q, quadrate.
3.9. TCDD clefts the parasphenoid
Because the zebrafish parasphenoid and ethmoid plates share similarities in development and morphology with the amniotic palatal skeleton, and require a common set of genes for normal development (Swartz et al., 2011), we hypothesized that the parasphenoid might make a model for the mammalian cleft palate caused by TCDD.
To test this we examined the parasphenoids in 144 hpf zebrafish embryos exposed to TCDD at 4 hpf. Specimens were fixed and stained with Alcian blue and Alizarin red, the lower jaws were dissected away to reveal the parasphenoid, and the samples were examined by microscopy (Fig. 9A and B). The figure shows representative whole mount images of the upper jaw and the associated craniofacial skeleton, after removal of the lower jaw. The blue staining shows the cartilages, and in the control specimen calcification of the parasphenoid and notochord can be clearly seen as pale Alizarin red staining. In contrast almost no ossification can be seen in the TCDD-exposed specimen. The TCDD- exposed embryos showed decreased medial convergence of the parasphenoid, and failed ossification in the medial region, indicated by the arrows.(Fig. 9C and D)
Fig. 9.

TCDD reduces ossification and clefts the parasphenoid of the zebrafish larva at 144 hpf.
Zebrafish embryos were exposed to TCDD or vehicle at 4 hpf (n = 3, 2 replicates, 10 fish each), and were collected and stained with Alcian blue and Alizarin red, as described in the Methods, at 144 hpf. Panels A and B show whole mount specimens from TCDD- and vehicle-exposed groups with the lower jaw removed to allow better visualization of the parashenoid, lying at the roof of the mouth. Ossification of the parasphenoid (ps) and the tip of the notochord can be observed stained with Alizarin red in the control sample but not in the TCDD-treated sample. The DIC signal shows convergence of the parasphenoid cells in the control, while signs of this convergence and tissue organization are difficult to see in the TCDD-treated sample (area between arrows in C and D).
This phenotype was observed in 83% (n = 6) of 120 hpf and 100 % (n = 6) of 144 hpf larvae exposed to TCDD, compared to 16% (n = 6) of 120 hpf and 0% (n = 6) of 144 hpf larvae exposed to vehicle. The failure of the parasphenoid tissue to converge medially and ossify is reminiscent of cleft palate caused by TCDD exposure in mice, and also observed in Sox9 +/− mouse fetuses (Bi et al., 2001; Thomae et al., 2005).
4. Discussion
4.1. AHR2 and Sox9b: linkage to craniofacial malformation
Zebrafish without a functional Ahr2 are resistant to the teratogenic effects of TCDD, suggesting that over activation of Ahr2 is responsible for the craniofacial effects produced by TCDD. Furthermore, when Ahr2 is mutated or missing in zebrafish, some cranial elements are smaller and fin skeleton elements are longer (Goodale et al., 2012). Together, these results point to a role for Ahr2 activity in skeletal development. However, the link between Ahr2 activation and craniofacial effects is not at all clear.
Xiong et al. showed that TCDD exposure produces greater than 10-fold down regulation of sox9b mRNA in the jaw of developing zebrafish. Experiments in which sox9b expression was titrated downwards with morpholino oligonucleotides closely replicated the craniofacial malformation caused by TCDD. In addition, injection of sox9b mRNA could protect the TCDD-treated jaw from malformation (Xiong et al., 2008). This told us that the effect of TCDD on sox9b expression in the jaw is important, but not how the developing cartilages were affected, nor where sox9b was expressed within the jaw. These questions led us to develop a sox9b:EGFP reporter strain, and to examine chondrogenesis and ossification in TCDD-treated embryos more carefully.
Here we show that TCDD reduces chondrocyte size and number in the ceratohyal cartilage. We show inhibition of dermal and perichondrial bone ossification in the craniofacial skeleton of zebrafish consistent with effects observed in the axial skeleton of medaka (Dong et al., 2012).
4.2. Chondrocyte size and number are reduced by TCDD
Although the decrease in chondrocyte number could potentially involve a TCDD-induced inhibition of cranial neural crest cell migration, this seems unlikely. TCDD exposure after completion of cranial neural crest cell migration still produces defects in cranial facial morphology and cartilage size (Xiong et al., 2008).
Our finding that TCDD reduces cartilage cell number suggests an effect on cell division. However, our experiments with a mitotic marker used cartilages that were already reduced in cell number when examined. At a constant cell division rate, a smaller body of cells produces fewer dividing cells than a tissue containing more cells. Nonetheless, we found a reduced cell division index in TCDD-treated fish chondrocytes in ceratohyal cartilage. Furthermore, by using a sox9b:EGFP reporter we were able to identify and count dividing perichondrial cells. While we could not determine a cell division index for these cells, our results suggest a reduced rate of new cell formation in TCDD-treated perichondrium. Therefore, we propose that one mechanism by which TCDD causes smaller craniofacial cartilages is reduction in cell number.
We also found that TCDD reduces the actual size of individual chondrocytes. By examining the regular array of columnar chondrocytes from the side, it was relatively simple to use computer measurements of length to determine that TCDD exposure reduces the size of these cells. Cartilage size is determined by cell number and cell size: we found that TCDD reduces both.
4.3. TCDD reduces ossification
We used two different techniques for measuring calcium deposition in chondrocytes. Alizarin red is commonly used, and showed the surrounding structures in clear detail. However, we found the fluorescent stain calcein to be useful in showing even very low levels of initial calcification in structures like the perichondrial ceratohyal bone as an example. We found the two stains to be complementary, in that the calcein staining showed more robustly, but less detail than the Alizarin red, while the Alizarin red complimented ossification staining with the sox9b:EGFP reporter.
Although the ability of live staining to visualize processes as they occur is attractive, there are some caveats; especially with TCDD exposure. Because TCDD induces cytochrome P-450 oxidases meant to degrade exogenous organic molecules, it is possible that the calcein stain is simply gone, or present at very low levels, in the TCDD treated live samples. This would produce an artificially low estimate of calcification in the TCDD samples. Because of this, we confirmed our calcein results in euthanized fixed specimens (not shown) and found the same reduction of staining in the TCDD-treated samples. The use of two types of stain further strengthens our results showing reduced calcification in the TCDD-treated zebrafish at 120 and 144 hpf.
4.4. Zebrafish embryos as a possible model for palate clefting
While TCDD induces cleft palate in mice and some other vertebrates, this response had not been observed in fish. The zebrafish parasphenoid and ethmoid plate share many developmental origins and morphological elements with the amniotic palatal skeleton. In addition, there is a large overlap between the genes involved in development of the zebrafish parasphenoid and the mouse palate (Swartz et al., 2011). Our finding of disrupted medial condensation in the parasphenoid suggests that conserved mechanisms may make the zebrafish an effective model for studying disruption of palate development by TCDD. Interestingly, humans with Sox9 haploinsufficiency often develop a cleft palate (Bi et al., 2001; Lee and Saint-Jeannet, 2011; Pritchett et al., 2011). However, the cause of cleft palate in many patients is often unknown (Parker et al., 2010). The cleft parasphenoid phenotype shown here may be helpful to investigators screening chemicals and studying pathways that disrupt palate development.
5. Conclusions
The present study reports new information about how TCDD disrupts craniofacial development in zebrafish. TCDD decreased growth of the ceratohyal cartilages by decreasing both chondrocyte number and size. A sox9b:EGFP reporter was used to mark pharyngeal endoderm-derived perichondrial cells demonstrating that proliferation of these sox9b-positive cells was slowed by TCDD. Osteoblasts in the perichondrium surrounding the ceratohyal, palatoquadrate, and Meckel’s cartilages of TCDD-exposed zebrafish larvae exhibited decreased calcein staining of calcium, and ossification of dermal bones in the zebrafish craniofacial skeleton was also reduced by TCDD. Finally a novel response to TCDD was discovered, clefting of the zebrafish parasphenoid, a flat bone that forms at the roof of the zebrafish mouth.
Acknowledgments
Funding information
This research was supported by NIH grant ES012716 and by UW Sea Grant R/BT 25. FRB was supported by a supplement to NIH grant ES012716 for underrepresented minorities and by an Advanced Opportunity Fellowship from the University of Wisconsin, Science and Medical School, Graduate Research Scholars Program.
We thank Dorothy Nesbit and her team for excellent zebrafish husbandry, Andrew Sentkowski for assistance with data collection, Lauren Bischel and Brianah “Breezy” Mader of Dr. David J. Beebe’s UW-Madison lab for fabricating a channel slide for fluorescent microscopy imaging, Joan Palmer for editing assistance, Maynard James Keenan, and the entire zebrafish lab for helpful comments. The collagen type II monoclonal antibody, developed by R. Holmdahl and K. Rubin, was obtained from the Developmental Studies Hybridoma Bank, created by the NICHD of the NIH and maintained at The University of Iowa, Department of Biology, Iowa City, IA 52,242.
Abbreviations
- TCDD
2,3,7,8-Tetrachlorodibenzo-p-dioxin
- sox9b
SRY [sex determining region Y]-box 9b
- Ahr
aryl hydrocarbon receptor
- cNCC
cranial neural crest cell
- EGFP
enhanced green fluorescent protein
Footnotes
Contributions
Dr. Heideman directed the research and was assisted by Dr. Peterson. Dr. Burns and Dr. Peterson wrote the manuscript with revisions done by Dr. Heideman. Felipe Burns conducted the in-life study and was responsible for experimental design, data collection, and statistical analysis of the data. All authors participated in the interpretation of results. All authors have approved the submitted manuscript.
Conflicts of interest
The authors declare no conflict of interests.
References
- Antkiewicz DS, Burns CG, Carney SA, Peterson RE, Heideman W. Heart malformation is an early response to TCDD in embryonic zebrafish. Toxicol Sci. 2005;84:368–377. doi: 10.1093/toxsci/kfi073. [DOI] [PubMed] [Google Scholar]
- Bi W, Huang W, Whitworth DJ, Deng JM, Zhang Z, Behringer RR, de Crombrugghe B. Haploinsufficiency of Sox9 results in defective cartilage primordia and premature skeletal mineralization. Proc Natl Acad Sci. 2001;98:6698–6703. doi: 10.1073/pnas.111092198. [DOI] [PMC free article] [PubMed] [Google Scholar]
- Cheng A, Genever PG. SOX9 determines RUNX2 transactivity by directing intracellular degradation. J Bone Mineral Res. 2010;25:2680–2689. doi: 10.1002/jbmr.174. [DOI] [PubMed] [Google Scholar]
- Couture LA, Abbott BD, Birnbaum LS. A critical review of the developmental toxicity and teratogenicity of 2,3,7,8-tetrachlorodibenzo-p-dioxin: recent advances toward understanding the mechanism. Teratology. 1990;42:619–627. doi: 10.1002/tera.1420420606. [DOI] [PubMed] [Google Scholar]
- Dalcq J, Pasque V, Ghaye A, Larbuisson A, Motte P, Martial JA, Muller M. RUNX3, EGR1 and SOX9B form a regulatory cascade required to modulate BMP-signaling during cranial Cartilage development in zebrafish. PLoS ONE. 2015;7:e50140. doi: 10.1371/journal.pone.0050140. [DOI] [PMC free article] [PubMed] [Google Scholar]
- DeLaurier A, Eames BF, Blanco-Sánchez B, Peng G, He X, Swartz ME, Ullmann B, Westerfield M, Kimmel CB. Zebrafish sp7:EGFP: a transgenic for studying otic vesicle formation, skeletogenesis, and bone regeneration. Genesis. 2010;48:505–511. doi: 10.1002/dvg.20639. [DOI] [PMC free article] [PubMed] [Google Scholar]
- Dong PD, Munson CA, Norton W, Crosnier C, Pan X, Gong Z, Neumann CJ, Stainier DY. Fgf10 regulates hepatopancreatic ductal system patterning and differentiation. Nature Genet. 2007;39:397–402. doi: 10.1038/ng1961. [DOI] [PubMed] [Google Scholar]
- Dong W, Hinton DE, Kullman S. TCDD disrupts hypural skeletogenesis during medaka embryonic development. Toxicol Sci. 2012;125(1):91–104. doi: 10.1093/toxsci/kfr284. [DOI] [PMC free article] [PubMed] [Google Scholar]
- Du SJ, Frenkel V, Kindschi G, Zohar Y. Visualizing normal and defective bone development in zebrafish embryos using the fluorescent chromophore calcein. Dev Biol. 2001;238:239–246. doi: 10.1006/dbio.2001.0390. [DOI] [PubMed] [Google Scholar]
- Flores MV, Tsang VWK, Hu W, Kalev-Zylinska M, Postlethwait J, Crosier P, Crosier K, Fisher S. Duplicate zebrafish runx2 orthologues are expressed in developing skeletal elements. Gene Expr Patterns. 2004;4:573–581. doi: 10.1016/j.modgep.2004.01.016. [DOI] [PubMed] [Google Scholar]
- Goodale BC, La Du JK, Bisson WH, Janszen DB, Waters KM, Tanguay RL. AHR2 mutant reveals functional diversity of aryl hydrocarbon receptors in zebrafish. PLoS ONE. 2012;7:e29346. doi: 10.1371/journal.pone.0029346. [DOI] [PMC free article] [PubMed] [Google Scholar]
- Haga Y, Du SJ, Masui S, Fujinami Y, Aritaki M, Satoh S. Visualization of skeletons and intervertebral disks in live fish larvae by fluorescent calcein staining and disk specific GFP expression. J Appl Ichthyol. 2010;26:268–273. [Google Scholar]
- Hendzel MJ, Wei Y, Mancini MA, Van Hooser A, Ranalli T, Brinkley BR, Bazett-Jones DP, Allis CD. Mitosis-specific phosphorylation of histone H3 initiates primarily within pericentromeric heterochromatin during G2 and spreads in an ordered fashion coincident with mitotic chromosome condensation. Chromosoma. 1997;106:348–360. doi: 10.1007/s004120050256. [DOI] [PubMed] [Google Scholar]
- Henry TR, Spitsbergen JM, Hornung MW, Abnet CC, Peterson RE. Early life stage toxicity of 2,3,7,8-tetrachlorodibenzo-p-dioxin in zebrafish (Danio rerio) Toxicol Appl Pharmacol. 1997;142:56–68. doi: 10.1006/taap.1996.8024. [DOI] [PubMed] [Google Scholar]
- Hofsteen P, Plavicki J, Johnson SD, Peterson RE, Heideman W. Sox9b Is required for epicardium formation and plays a role in TCDD-induced heart malformation in zebrafish. Mol Pharmacol. 2013;84:353–360. doi: 10.1124/mol.113.086413. [DOI] [PMC free article] [PubMed] [Google Scholar]
- Lee YH, Saint-Jeannet JP. Sox9 function in craniofacial development and disease. Genesis. 2011;49:200–208. doi: 10.1002/dvg.20717. [DOI] [PMC free article] [PubMed] [Google Scholar]
- Parker SE, Mai CT, Canfield MA, Rickard R, Wang Y, Meyer RE, Anderson P, Mason CA, Collins JS, Kirby RS, et al. Updated national birth prevalence estimates for selected birth defects in the United States, 2004–2006. Birth Defects Res Part A Clin Mol Teratol. 2010;88:1008–1016. doi: 10.1002/bdra.20735. [DOI] [PubMed] [Google Scholar]
- Plavicki J, Hofsteen P, Peterson RE, Heideman W. Dioxin inhibits zebrafish epicardium and proepicardium development. Toxicol Sci. 2013;131:558–567. doi: 10.1093/toxsci/kfs301. [DOI] [PMC free article] [PubMed] [Google Scholar]
- Plavicki JS, Baker TR, Burns FR, Xiong KM, Gooding AJ, Hofsteen P, Peterson RE, Heideman W. Construction and characterization of a sox9b transgenic reporter line. Int J Dev Biol. 2014;58:643–718. doi: 10.1387/ijdb.140288jp. [DOI] [PMC free article] [PubMed] [Google Scholar]
- Prasch AL, Teraoka H, Carney SA, Dong W, Hiraga T, Stegeman JJ, Heideman W, Peterson RE. Aryl hydrocarbon receptor 2 mediates 2,3,7,8-Tetrachlorodibenzo-p-dioxin developmental toxicity in zebrafish. Toxicol Sci. 2003;76:138–150. doi: 10.1093/toxsci/kfg202. [DOI] [PubMed] [Google Scholar]
- Pritchett J, Athwal V, Roberts N, Hanley NA, Hanley KP. Understanding the role of SOX9 in acquired diseases: lessons from development. Trends Mol Med. 2011;17:166–174. doi: 10.1016/j.molmed.2010.12.001. [DOI] [PubMed] [Google Scholar]
- Sarmah S, Barrallo-Gimeno A, Melville DB, Topczewski J, Solnica-Krezel L, Knapik EW. Sec24D-dependent transport of extracellular matrix proteins is required for zebrafish skeletal morphogenesis. PLoS ONE. 2010;5:e10367. doi: 10.1371/journal.pone.0010367. [DOI] [PMC free article] [PubMed] [Google Scholar]
- Shwartz Y, Farkas Z, Stern T, Aszódi A, Zelzer E. Muscle contraction controls skeletal morphogenesis through regulation of chondrocyte convergent extension. Dev Biol. 2012;370:154–163. doi: 10.1016/j.ydbio.2012.07.026. [DOI] [PubMed] [Google Scholar]
- Swartz ME, Sheehan-Rooney K, Dixon MJ, Eberhart JK. Examination of a palatogenic gene program in zebrafish. Dev Dyn. 2011;240:2204–2220. doi: 10.1002/dvdy.22713. [DOI] [PMC free article] [PubMed] [Google Scholar]
- Thomae TL, Stevens EA, Bradfield CA. Transforming growth factor-μ3 restores fusion in palatal shelves exposed to 2,3,7,8-tetrachlorodibenzo-p-dioxin. J Biol Chem. 2005;280:12742–12746. doi: 10.1074/jbc.M410780200. [DOI] [PubMed] [Google Scholar]
- Walker M, Kimmel C. A two-color acid-free cartilage and bone stain for zebrafish larvae. Biotechnol Histochem. 2007;82:23–28. doi: 10.1080/10520290701333558. [DOI] [PubMed] [Google Scholar]
- Xiong KM, Peterson RE, Heideman W. Aryl hydrocarbon receptor-mediated down-regulation of sox9b causes jaw malformation in zebrafish embryos. Mol Pharmacol. 2008;74:1544–1553. doi: 10.1124/mol.108.050435. [DOI] [PMC free article] [PubMed] [Google Scholar]
- Yan YL, Willoughby J, Liu D, Crump JG, Wilson C, Miller CT, Singer A, Kimmel C, Westerfield M, Postlethwait JH. A pair of sox: distinct and overlapping functions of zebrafish sox9 co-orthologs in craniofacial and pectoral fin development. Development. 2005;132:1069–1083. doi: 10.1242/dev.01674. [DOI] [PubMed] [Google Scholar]
- Yeager RL, Oleske DA, Millsap DS, Henshel DS. Severe craniofacial malformations resulting from developmental exposure to dioxin. Reprod Toxicol. 2006;22:811–812. doi: 10.1016/j.reprotox.2006.07.004. [DOI] [PubMed] [Google Scholar]
- Zhou G, Zheng Q, Engin F, Munivez E, Chen Y, Sebald E, Krakow D, Lee B. Dominance of SOX9 function over RUNX2 during skeletogenesis. Proc Natl Acad Sci. 2006;103:19004–19009. doi: 10.1073/pnas.0605170103. [DOI] [PMC free article] [PubMed] [Google Scholar]