Abstract
High-resolution characterization of the structure and dynamics of intrinsically disordered proteins (IDPs) remains a challenging task. Consequently, a detailed understanding of the structural and functional features of IDPs remains limited, as very few full-length disordered proteins have been structurally characterized. We have performed microsecond-long molecular dynamics (MD) simulations of Noxa, the smallest member of the large Bcl-2 family of apoptosis regulating proteins, to characterize in atomic-level detail the structural features of a disordered protein. A 2.5-μs MD simulation starting from an unfolded state of the protein revealed the formation of a central antiparallel β-sheet structure flanked by two disordered segments at the N- and C-terminal ends. This topology is in reasonable agreement with protein disorder predictions and available experimental data. We show that this fold plays an essential role in the intracellular function and regulation of Noxa. We demonstrate that unbiased MD simulations in combination with a modern force field reveal structural and functional features of disordered proteins at atomic-level resolution.
Introduction
Intrinsically disordered proteins (IDPs) constitute a new class of proteins that lack a well-defined structure. 1–4 The absence of ordered structure is an essential characteristic that provides these proteins with several functional advantages over globular proteins.4–11 For example, disordered proteins/regions can bind their partners with high specificity while modulating binding affinity. Disordered proteins/regions usually undergo disorder-to-order transitions upon binding, e.g., IDPs or IDRs adopt an ordered structure upon binding to their biological partners.4, 12–14 Thus, binding is what ultimately determines the conformation of IDPs in the bound state.12, 15 Binding-induced folding can occur in full length IDPs, or in large or short disorder regions within partially folded IDPs. In other cases, IDPs retain structural disorder in the bound state, which is necessary to optimize their function in the cell.16, 17
A high-resolution visualization of the structural characteristics of disordered proteins is essential for understanding the function and mechanisms for regulation of IDPs in the cell. The structural dynamics of IDPs have been studied using various experimental techniques such as small-angle X-ray scattering (SAXS),18, 19 fluorescence resonance energy transfer (FRET),20, 21 electron paramagnetic resonance (EPR)22, 23 and NMR spectroscopy. 24–27 However, high-resolution structural characterization of IDPs in solution remains a challenge because of the flexibility of these proteins in solution and the inherent limitations of experimental techniques. For instance, although SAXS can provide quantitative information on shapes, oligomeric states, and quaternary structures of folded proteins and protein complexes, the low-resolution nature of the data necessitates its use in combination with other methods (e.g., NMR) for the characterization of IDPs.27 Atomic-level characterization of IDPs can be performed using various NMR strategies, such as residual dipolar couplings and paramagnetic relaxation enhancements;24–26 however, high-resolution NMR studies of intrinsically disordered proteins often suffer from inherently low signal dispersion, resulting in signal overlap. In addition, the vast majority of published NMR studies have been limited to isolated short domains of these proteins, often neglecting global structural properties of full-length IDPs. Recently, molecular dynamics (MD) simulations have emerged as a powerful technique to overcome these limitations.28 Despite the inherent limitations of modern force fields and the time scales covered with standard methods, MD simulations are uniquely positioned to characterize, at atomic-level resolution, the structure and dynamics of IDPs in solution, thus providing crucial information that is currently unavailable through experiments alone.
We have used microsecond MD simulations to characterize in atomic-level resolution the structure of human Noxa, a 54-residue disordered protein. Noxa is a BH3-only protein and the smallest member of the large Bcl-2 family.29 It interacts with Bcl-2 family member Mcl-1 via its BH3 domain, through coupled folding and binding,30 to promote apoptosis. In most epithelial cells, the Noxa protein is induced in response to stress stimuli such as DNA damage and hypoxia;31, 32 however, the protein is constitutively expressed and phosphorylated by a glucose-regulated kinase in leukemia cells. This phosphorylation, at a single serine residue, regulates Noxa’s pro-apoptotic activity.33 We simulated Noxa because (i) it belongs to a very important family of cancer-associated proteins, (ii) its size allows us to study a full-length IDP in solution, and (iii) its structural properties have been studied experimentally and computationally.30, 33, 34 Our MD simulations, starting from an unfolded state of Noxa, revealed the formation of a central antiparallel β-sheet structure flanked by two disordered segments at the N- and C-terminal ends. We found that this topology is in reasonable agreement with protein disorder predictions and available experimental data. MD simulations allowed us to resolve structural features of Noxa at a level of resolution not currently attainable through experiments, and demonstrate that unbiased MD simulations resolve essential structural and functional features of a disordered protein under physiological conditions.
Methods
Prediction of structural disorder
We used five methods to predict structural disorder in human Noxa: (1) PONDR-FIT is a consensus artificial neural network prediction method, which was developed by combining the outputs of several individual disorder predictors.35 (2) IUPred estimates pairwise interaction energies using a statistical potential. The IUPred algorithm captures the essential cause of protein non-folding in a more general way: if a residue in a protein is not able to form enough favorable intrachain contacts, it will not adopt a stable position in the 3D structure of the chain; if such residues are clustered along a segment of a protein or the whole protein then this segment, or the entire protein, will be disordered.36 (3) DisEMBL, predicts classic loops, flexible loops with high B-factors, missing coordinates in X-ray structures, and regions of low-complexity that are prone to aggregation.37 (4) SPINE-D makes a three-state prediction first (ordered residues and disordered residues in short and long disordered regions) and reduces it into a two-state prediction later.38 (5) ESpritz is an ensemble of protein disorder predictors based on bidirectional recursive neural networks and trained on three different types of disorder, including a novel NMR flexibility predictor.39
Modeling of Noxa structure
We constructed an extended model of Noxa using the full sequence of the protein. To generate a random structural model, we performed a short 10-ns MD simulation of Noxa at 400K. The structure at the end of this simulation contained two short α-helices but was mostly disordered (% secondary structure <20%). This structure was solvated using TIP3P water molecules with a minimum margin of 2.5 nm between the protein and the edges of the periodic box. Na+ and Cl− ions were added to the system to neutralize the charge of the system and to produce a NaCl concentration of approximately 150 mM. CHARMM36 force field topologies were used for the protein, water and ions.40, 41 We used this force field because we have previously shown that it describes well the structural dynamics of an functional disordered region in solution.42
Molecular dynamics simulations
We performed MD simulations using the program NAMD 2.9.43 Periodic boundary conditions 44, particle mesh Ewald,45, 46 a non-bonded cutoff of 0.9 nm and a 2 fs time step were used. The NPT ensemble was maintained with a Langevin thermostat (310K) and a Langevin piston barostat (1 atm). The system was first subjected to energy minimization for 1000 steps, followed by a warming up period for 200 ps. This procedure was followed by equilibration for 0.01 ns with backbone atoms harmonically restrained using a force constant of 100.0 kcal mol−1 nm−2. An unrestrained production MD simulation of Noxa was continued for 2.5 μs.
Results
Prediction of structural disorder in Noxa
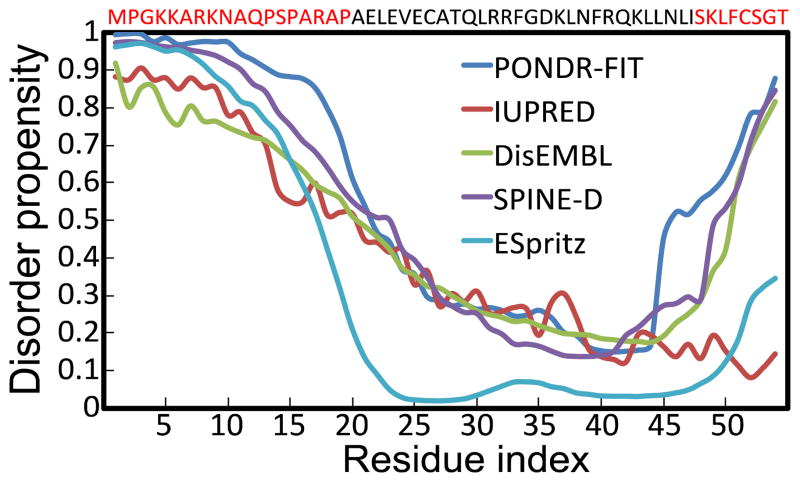
Members of the Bcl-2 family are either intrinsically disordered or contain intrinsically disordered regions that are critical to their function.47 Disorder-promoting amino acids such as proline or serine prevent proteins from folding, thus allowing the protein to remain disordered.48 We found that strong disorder-promoting amino acids proline, glutamic acid, serine, and lysine accounted for ~50% of Noxa’s sequence. We used several structure disorder predictors to determine whether Noxa is partially or fully disordered (Fig. 1). Analysis of disorder propensities revealed that, on average, 22 residues (41% of the total sequence) are structurally disordered. Analysis of the structure disorder plots revealed that that 86% of the unstructured regions are located at the N-terminus of Noxa. All five algorithms predict a consensus disordered N-terminal region spanning residues M1-P18 (Fig. 1); this N-terminal segment contains the regulatory phosphorylation site S13.33 The algorithms also predict a disordered C-terminus, although there is a large variability in the length of this disordered region. For example, PONDR-FIT predicts residues I46-T54 to be disordered, whereas ESpritz and IUPred predict the C-terminus as a completely ordered region (Fig. 1).
Fig. 1. Disorder analysis of Noxa using multiple prediction algorithms.
The plot shows the disorder propensity of each amino acid in Noxa. All prediction algorithms use the same disorder scale: residues with values between 0 and 0.5 are considered structurally ordered, whereas residues with disorder propensity values between 0.5 and 1 are considered structurally disordered. The sequence of Noxa is shown at the top of the graph, and residues that are likely to be disordered based on disorder prediction algorithms are shown in red.
All five algorithms predict a consensus ordered region between residues A19-S47. This ordered region includes the highly conserved BH3 motif (29LRRFGDK35). X-ray crystallography studies have shown that this domain adopts an α-helix on binding to a hydrophobic groove of Mcl-1.30 Secondary structure predictions using JPRED49 and PSIPRED50 algorithms indicate that A19-S47 exclusively populates an α-helical structure; these algorithms predict that between 56–68% of Noxa is α-helical. However, circular dichroism (CD) studies of the isolated BH3 domain of Noxa showed that this domain is mostly unstructured in solution.30 Furthermore, CD analyses of full-length Noxa showed that <18% of Noxa folds into an α-helix. Therefore, we simulated the dynamics of Noxa using microsecond MD simulations to reconcile the apparent contradiction between structural secondary structure/protein disorder predictions and available experimental data.
Energy landscapes of Noxa
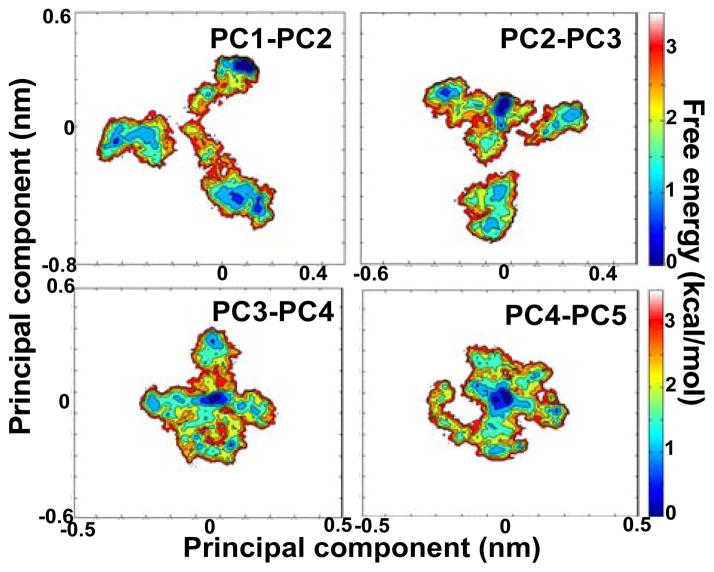
We used dihedral angle principal component analysis (dPCA) to measure the structural space sampled by Noxa in our trajectory. We found that 90% of the structural space sampled in the 2.5-μs trajectory can be reduced to 82 dimensions (principal components), indicating that Noxa adopts a very heterogeneous structure even in this time scale. We also found that the first 5 principal components could be used to describe ~50% of the total structural space of Noxa. Therefore, we used these as reaction coordinates to construct free energy landscapes of Noxa in solution (Fig. 3). In all cases, the plots represent rugged landscapes that feature several energy minima; for example, the landscape constructed using principal components 1 and 2 revealed the presence of at least 5 energy minima populated in the MD trajectory, but the energy barriers separating these minima are relatively small (≤3.5 kcal/mol). Thus, the energy landscape of Noxa can be described as a weakly funnelled one,51 in which the protein is inherently flexible but in which the backbone samples a limited number of structural states.
Fig. 3. dPCA-based free energy landscapes of Noxa.
Free energy landscapes were obtained using combinations of principal components 1–2, 2–3, 3–4 and 4–5 as reaction coordinates. In all cases, the free energy landscapes features multiple minima separated by relatively small energy barriers.
Fluctuations in secondary structure
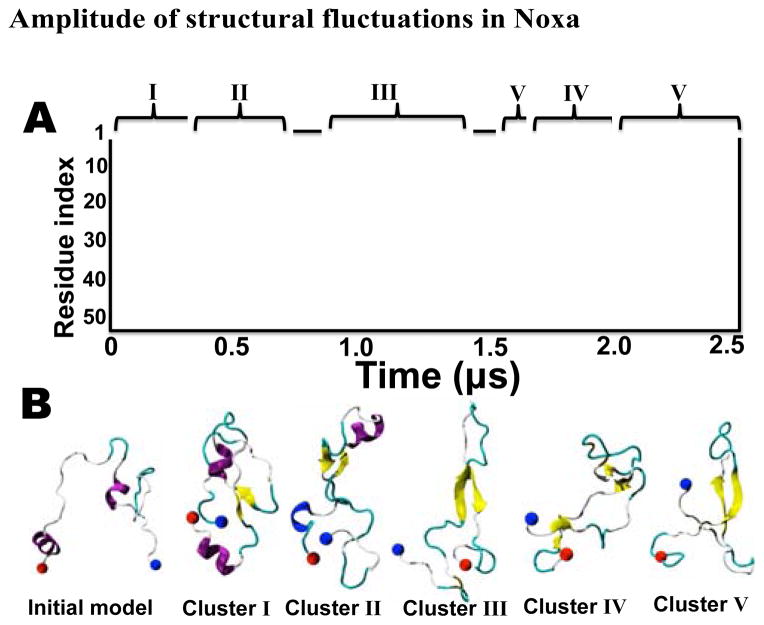
We analyzed the secondary structure evolution of Noxa to characterize the formation and stability of secondary structure in the MD trajectory. Noxa is mostly disordered during the first 0.12 μs (Fig. 2A). After this initial period of time, Noxa folds into two antiparallel β-sheets (residues A19-V23 and L36-N40) connected by a 10-residue loop at residues C25-K35 (Fig. 2A). Two disordered segments at the N- and C-terminus flank this β-sheet. We found that this structure remains stable for the remaining 2.38 μs in the trajectory. We used five-dimensional clustering based on the first five principal components obtained by dPCA. Although we identified five distinct structural states in our trajectory (Fig. 2B), the central β-sheet present in all representative structure for each cluster. This indicates that the central β-sheet is an intrinsic structural feature of Noxa in solution. This finding is in excellent agreement with disorder propensity algorithms predicting that residues A19-N40 are natively folded (Fig. 1). We also detected the presence of three additional folded segments that were either present in the initial model or folded during the trajectory: two α-helices at positions V23-T27 and L45-C51, and a 310-helix at positions R30-F32 (Fig. 2A). However, we found that these helical segments unfold in the sub-microsecond time scale. Nevertheless, we observed the spontaneous formation and breaking of 310-helices at positions L29-R31 and F50-S52, indicating that folding of these segments into short helical segments occurs transiently.
Fig. 2. Time-dependent structural fluctuations of Noxa.
(A) Evolution of the secondary structure of Noxa in the 2.5-μs trajectory. Secondary structure is colored as α-helix (pink), 310-helix (blue), β-strand (yellow) turn (cyan), and coil (white). (B) Snapshots illustrating the key structural features of Noxa as determined by 5-D dPCA clustering analysis. Each cluster is indicated in Roman numerals; the location of each cluster in the trajectory is shown with keys above panel A. The structure of Noxa is represented in ribbons and colored based on secondary structure, and N- and C-termini are shown as blue and red spheres, respectively.
We compared our trajectory against available experimental data. Linear fit of the CD spectrum of Noxa had yielded 17.5% α-helix, 45.8% β-sheet and 36.7% coil.33 We calculated the average secondary structure content of Noxa from the structures extracted between 1–2.5 μs to avoid biasing due to the presence of α-helical segments in the initial structure of the protein (Fig. 2A,B). We then calculated the percent of secondary structure content using a combination of secondary structure assignments with STRIDE52 and (φ,ψ) dihedral angles for each residue. On average, our analyses yielded 5% α-helix, 29% β-sheet and 33% coil. Although our simulation underestimates the overall secondary structure content (particularly the percent of α-helix), the β/coil ratio of 0.88:1 in our simulation, is in reasonable agreement with the 1.25:1 ratio observed in CD experiments. The discrepancy in α-helical content between experiments and our trajectory is probably due to the possibility that the helix-coil transitions occur slowly, e.g., in tens of microseconds. It is also possible that the structural complexity of Noxa cannot be captured accurately by CD due to the intrinsic limitations of this technique for protein structure analysis.53 Our simulation captures the specific structural features of Noxa with reasonable accuracy, despite these differences.
Amplitude of structural fluctuations in Noxa
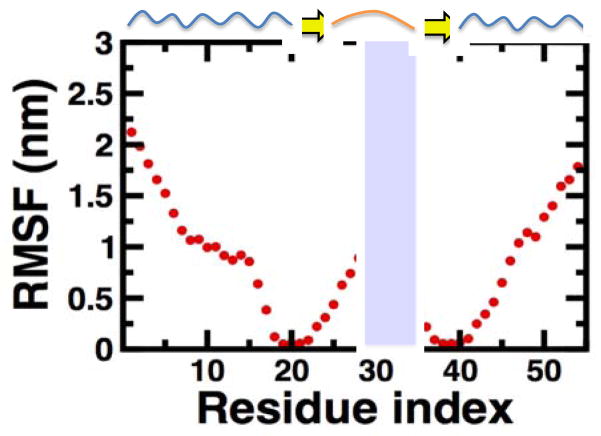
We characterized the amplitude of structural fluctuations in Noxa by calculating the root mean-square fluctuations (RMSF) of Cα atoms using the structures obtained between t=1 μs and t=2.5. We superposed all structures onto residues A19-V23 and L36-N40 because these are the only regions of the protein folding into a well-defined structure in our trajectory. In agreement with our structure disorder predictions, we found that the N-terminal segment up to residue A17 is very flexible in solution, with RMSF values between 0.5 and 2.3 nm (Fig. 4). Similar amplitude for structural fluctuations is also observed the C-terminus, in which residues L45-T54 have RMSF values equal or larger than 0.5 nm (Fig. 4). Although the β-sheet motif is structurally stable (Fig. 2), the loop connecting the two β-strands is inherently flexible. Nevertheless, the amplitude of structural fluctuation in this loop (0.5–1.0 nm) is substantially lower compared to the rest of the N- and C-terminal segments, indicating that the structural flexibility of this domain is controlled by the formation of a β-sheet motif. Thus, this loop can be considered a flexible region within a folded region the protein, which explains why disorder propensity algorithms predict structural order in this region of Noxa (Fig. 1).
Fig. 4. RMSF values calculated for Noxa.
RMSF values were calculated between 1–2.5 μs by aligning the Cα atoms of Noxa onto residues A19-V23 and L36-N40. A cartoon representation of the secondary structure content of of Noxa is shown at the top of the plot. The shaded area in the plot indicates the location of the BH3 motif.
Mechanism for β-sheet formation
It has been proposed that β-nucleation is a local phenomenon resulting either from sequential or topological proximity.54 The formation of the central β-sheet occurs rapidly in our MD trajectory despite the fact that the region where β-nucleation initiates does not have a predefined structure (Fig. 2A). It is possible that β-nucleation is driven by the formation of non-native contacts between the helices present in the initial structure of Noxa (Fig. 2B). Therefore, we analyzed potential non-native contacts between structured regions during the first 0.12 μs of simulation. We found that during this period of time, the average centroid-centroid distance between α-helices V23-T27 and L45-C51 is 2.2±0.5 nm, indicating that these α-helices do not interact prior to β-nucleation. Furthermore, we found no evidence of transient contacts involving α-helix V23-T27. Our trajectories revealed the formation of a transient salt bridge between residues E24 of α-helix V23-T27 and acidic residue K35 at time interval t=0.01–0.03 μs. However, time-dependent changes in secondary structure (Fig. 2A) did not show evidence of β-nucleation during this time interval. These observations indicate that β-nucleation of Noxa does not result from topological proximity of ordered segments.
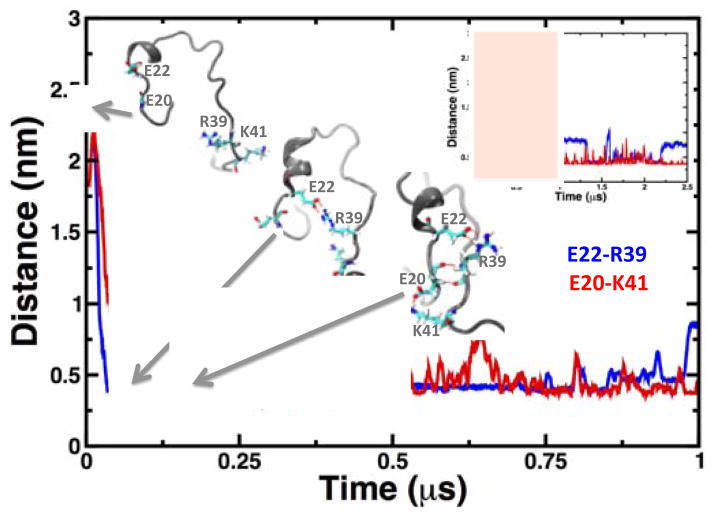
We analyzed initiation of β-nucleation through sequential proximity because the folded segment of Noxa is rich in charged residues (38% of the folded β-sheet). Our analysis revealed two salt bridges, E22-R39 and E20-K41, which stabilize the folding module that holds two stretches of coil close together to bring their backbones in close proximity for β-nucleation. To quantitatively determine the role of E22-R39 and E20-K41 in β-nucleation, we plotted the distances between Cδ of glutamate and Cζ and Nζ of arginine and lysine respectively (Fig. 5). We found that the salt bridge E22-R39 forms at t=0.06 μs and remains stable for the first 1 μs of simulation time. Salt bridge E22-R39 brings together the two segments of Noxa where folding occurs, albeit not sufficiently close for β-nucleation. Instead, this salt bridge facilitates the formation of the salt bridge E20-K41, which stabilizes the folding module and initiates β-nucleation (Fig. 5). We found that the salt bridge E20-K41 is present in most of the MD trajectory (Fig. 5, inset plot), indicating that it also plays a central role in the structural stability of the central β-sheet.
Fig. 5. Time-dependent changes in the distance distances E22-R39 and D20-K41.
We calculated the distances between Cδ of glutamate and Cζ and Nζ of arginine and lysine, respectively. The formations of salt bridges at different times are shown as grey cartoons; the residues involved in salt-bridge formation and β-nucleation are shown as sticks. The main plot shows the distances calculated only for the first 1 μs in the trajectory; the inset plot shows the changes in interresidue distances for the entire 2.5 μs of simulation time.
Structural stability of the backbone hydrogen-bond network of the β-sheet
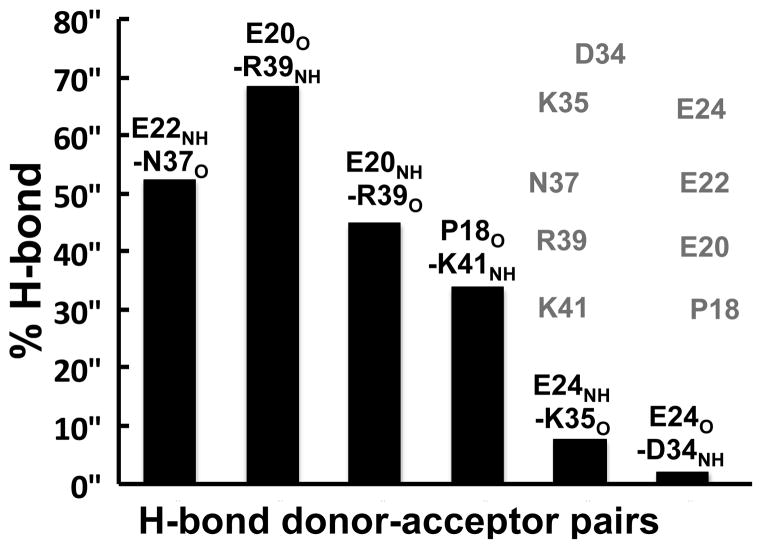
Experimental studies have shown that the β-sheet we have characterized in this study folds into an α-helix upon binding to Mcl-1.30 This suggests that the β-sheet of Noxa must be adaptable to allow β-sheet unfolding and subsequent folding into an α-helix upon binding. We calculated the percentage of time backbone hydrogen bonds are present at the strand-strand interface of the central β-sheet (Fig. 6). We found that the hydrogen bonds near residue pairs E20 and R39 are present for at least 35% of the simulation time, although the hydrogen bond E20O-R39NH is present for ~70% of the simulation (Fig. 6). These results indicate that while four hydrogen bonds are sufficiently stable to support the β-sheet fold, the interstrand hydrogen bond network is dynamic in the microsecond time scale. In addition, we found that interstrand hydrogen bonds closer to the flexible loop are only transient (<8% of the time). These observations suggest that, despite partial folding of Noxa into a β-sheet, the interstrand hydrogen-bond network becomes less stable closer to the loop where the BH3 motif is located. We suggest that this structural feature is necessary because excessive structural ordering around the BH3 motif could result in energetically unfavorable structural transitions upon binding to Mcl-1.
Fig. 6. Occurrence of interstrand hydrogen bonds.
% H-bond was calculated between t=1 μs and t=2.5 μs using individual structures at time intervals of 0.04 μs. The cartoon shows the location of the hydrogen bond donors and acceptors located at the interface of the β-sheet. Backbone atoms are shown as van der Waals spheres and colored according to atom type: oxygen (red), nitrogen (blue), carbon (cyan) and hydrogen (white).
Discussion
We have used microsecond MD simulations to characterize the structural dynamics of Noxa, a disordered protein. We found that the full-length human Noxa protein adopts a partially folded structure characterized by a central β-sheet flanked by two flexible N- and C-terminal segments. In addition, we found that functional sites in Noxa, such as the phosphorylation site (residue S19) and BH3 motif (residues L29-F32) are located within flexible regions. These structural characteristics are in reasonable agreement with available experimental data,30, 33 and indicate that our simulations capture the structural features of Noxa in solution.
Folding and binding of disordered proteins/regions occur through a hierarchical mechanism that involves several intermediates rather than a two-state condensation-propagation model.55 Structural elements/molecular recognition features are inherently arranged in a ‘bound-like’ conformation which is suitable for the formation of the encounter complex with the binding partners of IPDs.55 In the case of Noxa, there are three important structural features that contribute to the formation of the encounter complex and the coupled folding and binding. First, while the loop that contains the BH3 domain is inherently flexible, its structural flexibility is partially restrained by the β-sheet fold. We observed that more than 80% of the side chain area of the BH3 motif is exposed to solvent. This results in the formation of a claw-like structure56 that exposes all residues in the BH3 motif (Fig. 7). This structural arrangement is likely to serve as the recognition platform for binding to Mcl-1. Second, a 310-helix was observed to form transiently at positions L29-R31. This finding is important because a 310-helix is an intermediate in the formation of an α-helix;57 thus, this transient structure might facilitate coupled folding upon binding to Mcl-1. This finding is in line with previous studies suggesting that IDPs contain preformed structural elements/molecular recognition features.55, 58–60 Finally, the nature of the interstrand backbone hydrogen-bond network possibly allows for a relatively low-energy unfolding of the β-sheet, e.g., the average activation energy for the rupture of the hydrogen bond in a β-sheet in water is ~1.6 kcal/mol.61 Thus, the rupture of interstrand hydrogen bonds probably contributes to the binding selectivity of Noxa for Mcl-1 by creating additional kinetic traps. We propose that the exposure of the BH3 motif and the presence of a transient 310-helix reduce the dimensionality of the structural search and facilitate the formation of the Noxa•Mcl-1 encounter complex, whereas the sequential rupture of interstrand hydrogen bonds and the formation of α-helix upon binding contribute to the binding specificity to Mcl-1.
Fig. 7. Claw-like structure of the BH3 motif.
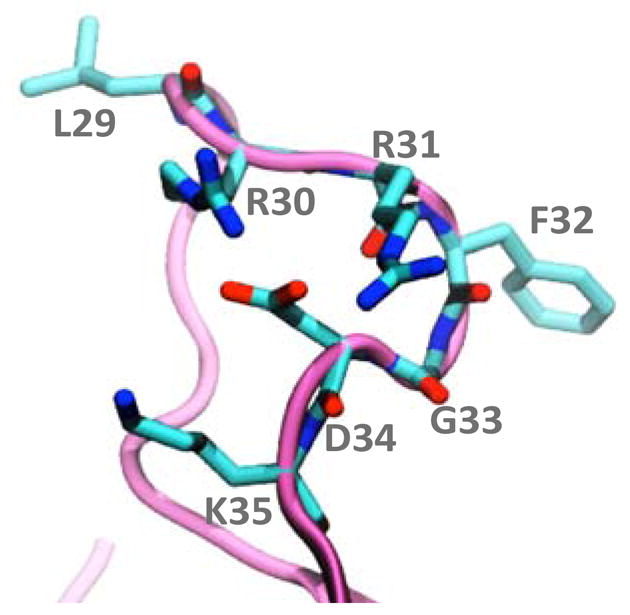
The structure of Noxa corresponds to the representative cluster V shown in Fig. 3C. Noxa is shown as cyan ribbons and the side chain residues of the BH3 motif (residues L29-K35) are shown as sticks.
Previous studies have shown that members of the Bcl-2 family are fully or partially disordered in solution, and that they undergo folding into ordered helical segments upon binding.47 Therefore, we expect that a substantial amount of preformed helical structure must be present in Noxa to reduce the entropic penalty associated with coupled folding and binding through populating bound-like structures prior binding. However, we found that the region of Noxa that undergoes coupled folding and binding, folds into a β-sheet and has a negligible amount of helical structure. Why does Noxa natively fold into a central β-sheet, and not into a segmented α-helix? A recent study showed that phosphorylation of 4E-BP2, the major neural isoform of the family of three mammalian proteins that bind eIF4E, inhibits binding though a mechanism that involves additional β-sheet formation which partially sequesters the binding motif.62 Noxa’s activity is regulated by phosphorylation on residue 13, which inhibits binding to Mcl-1.33 Based on the 4E-BP2 study, we propose that Noxa’s β-sheet fold is advantageous for regulation as it provides the phosphorylated motif a structural scaffold to sequester the BH3 domain and inhibit binding to Mcl-1 in a rapid and selective fashion.
Finally, another important question to consider is whether the β-sheet fold of Noxa poses any toxicity to the cell. β-sheet proteins are usually soluble, but fragments or designs of β structure usually aggregate. In particular, regular β-sheet edges are dangerous, because they are already in the right conformation to interact with any other β-strand they encounter. To overcome edge-to-edge aggregation, β-sheets normally have charged residues or proline to disfavor further β interactions.63 Indeed, we found that the β-sheet is rich in charged residues (Fig. 6, inset cartoon), suggesting that Noxa does not form toxic oligomers under physiological conditions. The inability of Noxa to undergo edge-to-edge aggregation due to charged residues is supported by mass spectrometry experiments showing that Noxa predominantly exists as a monomer.33
Conclusions
We have characterized the structure of human Noxa, a disordered protein, using microsecond-long MD simulations. Our simulations showed that Noxa rapidly folds into an antiparallel β-sheet flanked by two disordered segments at the N- and C-terminal ends. This fold is in reasonable agreement bioinformatics analyses and available experimental data. Our findings indicate that β-sheet folding is a functional structural state of Noxa in the cell. We conclude that unbiased MD simulations in combination with a modern force field resolves structural and functional features of disordered proteins at atomic-level resolution.
Acknowledgments
This work was supported by a NIH grant R01 CA157971 to A.K. This project made extensive use of the outstanding facilities at the University of Minnesota’s Supercomputing Institute.
References
- 1.Uversky VN, Gillespie JR, Fink AL. Proteins. 2000;41:415–427. doi: 10.1002/1097-0134(20001115)41:3<415::aid-prot130>3.0.co;2-7. [DOI] [PubMed] [Google Scholar]
- 2.Uversky VN. Protein Sci. 2002;11:739–756. doi: 10.1110/ps.4210102. [DOI] [PMC free article] [PubMed] [Google Scholar]
- 3.Tompa P. Trends Biochem Sci. 2002;27:527–533. doi: 10.1016/s0968-0004(02)02169-2. [DOI] [PubMed] [Google Scholar]
- 4.Uversky VN, Dunker AK. Biochim Biophys Acta. 2010;1804:1231–1264. doi: 10.1016/j.bbapap.2010.01.017. [DOI] [PMC free article] [PubMed] [Google Scholar]
- 5.Wright PE, Dyson HJ. J Mol Biol. 1999;293:321–331. doi: 10.1006/jmbi.1999.3110. [DOI] [PubMed] [Google Scholar]
- 6.Dunker AK, Obradovic Z. Nat Biotechnol. 2001;19:805–806. doi: 10.1038/nbt0901-805. [DOI] [PubMed] [Google Scholar]
- 7.Tompa P. FEBS Lett. 2005;579:3346–3354. doi: 10.1016/j.febslet.2005.03.072. [DOI] [PubMed] [Google Scholar]
- 8.Tompa P, Szasz C, Buday L. Trends Biochem Sci. 2005;30:484–489. doi: 10.1016/j.tibs.2005.07.008. [DOI] [PubMed] [Google Scholar]
- 9.Uversky VN, Oldfield CJ, Dunker AK. J Mol Recognit. 2005;18:343–384. doi: 10.1002/jmr.747. [DOI] [PubMed] [Google Scholar]
- 10.Dunker AK, Silman I, Uversky VN, Sussman JL. Curr Opin Struct Biol. 2008;18:756–764. doi: 10.1016/j.sbi.2008.10.002. [DOI] [PubMed] [Google Scholar]
- 11.Dyson HJ, Wright PE. Nat Rev Mol Cell Biol. 2005;6:197–208. doi: 10.1038/nrm1589. [DOI] [PubMed] [Google Scholar]
- 12.Dyson HJ, Wright PE. Curr Opin Struct Biol. 2002;12:54–60. doi: 10.1016/s0959-440x(02)00289-0. [DOI] [PubMed] [Google Scholar]
- 13.Espinoza-Fonseca LM. Biochem Biophys Res Commun. 2009;382:479–482. doi: 10.1016/j.bbrc.2009.02.151. [DOI] [PubMed] [Google Scholar]
- 14.Hammes GG, Chang YC, Oas TG. Proc Natl Acad Sci U S A. 2009;106:13737–13741. doi: 10.1073/pnas.0907195106. [DOI] [PMC free article] [PubMed] [Google Scholar]
- 15.Click TH, Ganguly D, Chen J. Int J Mol Sci. 2010;11:5292–5309. doi: 10.3390/ijms11125292. [DOI] [PMC free article] [PubMed] [Google Scholar]
- 16.Meszaros B, Simon I, Dosztanyi Z. Phys Biol. 2011;8:035003. doi: 10.1088/1478-3975/8/3/035003. [DOI] [PubMed] [Google Scholar]
- 17.Tompa P, Fuxreiter M. Trends Biochem Sci. 2008;33:2–8. doi: 10.1016/j.tibs.2007.10.003. [DOI] [PubMed] [Google Scholar]
- 18.Bernado P, Svergun DI. Methods Mol Biol. 2012;896:107–122. doi: 10.1007/978-1-4614-3704-8_7. [DOI] [PubMed] [Google Scholar]
- 19.Bernado P, Svergun DI. Mol Biosyst. 2012;8:151–167. doi: 10.1039/c1mb05275f. [DOI] [PubMed] [Google Scholar]
- 20.Huang F, Rajagopalan S, Settanni G, Marsh RJ, Armoogum DA, Nicolaou N, Bain AJ, Lerner E, Haas E, Ying L, Fersht AR. Proc Natl Acad Sci U S A. 2009;106:20758–20763. doi: 10.1073/pnas.0909644106. [DOI] [PMC free article] [PubMed] [Google Scholar]
- 21.Haas E. Methods Mol Biol. 2012;895:467–498. doi: 10.1007/978-1-61779-927-3_28. [DOI] [PubMed] [Google Scholar]
- 22.Habchi J, Martinho M, Gruet A, Guigliarelli B, Longhi S, Belle V. Methods Mol Biol. 2012;895:361–386. doi: 10.1007/978-1-61779-927-3_21. [DOI] [PubMed] [Google Scholar]
- 23.Longhi S, Belle V, Fournel A, Guigliarelli B, Carriere F. Journal of peptide science: an official publication of the European Peptide Society. 2011;17:315–328. doi: 10.1002/psc.1344. [DOI] [PubMed] [Google Scholar]
- 24.Salmon L, Nodet G, Ozenne V, Yin GW, Jensen MR, Zweckstetter M, Blackledge M. Journal of the American Chemical Society. 2010;132:8407–8418. doi: 10.1021/ja101645g. [DOI] [PubMed] [Google Scholar]
- 25.Jensen MR, Ruigrok RW, Blackledge M. Curr Opin Struct Biol. 2013;23:426–435. doi: 10.1016/j.sbi.2013.02.007. [DOI] [PubMed] [Google Scholar]
- 26.Kosol S, Contreras-Martos S, Cedeno C, Tompa P. Molecules. 2013;18:10802–10828. doi: 10.3390/molecules180910802. [DOI] [PMC free article] [PubMed] [Google Scholar]
- 27.Sibille N, Bernado P. Biochemical Society transactions. 2012;40:955–962. doi: 10.1042/BST20120149. [DOI] [PubMed] [Google Scholar]
- 28.Lindorff-Larsen K, Trbovic N, Maragakis P, Piana S, Shaw DE. J Am Chem Soc. 2012;134:3787–3791. doi: 10.1021/ja209931w. [DOI] [PubMed] [Google Scholar]
- 29.Oda E, Ohki R, Murasawa H, Nemoto J, Shibue T, Yamashita T, Tokino T, Taniguchi T, Tanaka N. Science. 2000;288:1053–1058. doi: 10.1126/science.288.5468.1053. [DOI] [PubMed] [Google Scholar]
- 30.Day CL, Smits C, Fan FC, Lee EF, Fairlie WD, Hinds MG. J Mol Biol. 2008;380:958–971. doi: 10.1016/j.jmb.2008.05.071. [DOI] [PubMed] [Google Scholar]
- 31.Ploner C, Kofler R, Villunger A. Oncogene. 2008;27(Suppl 1):S84–92. doi: 10.1038/onc.2009.46. [DOI] [PMC free article] [PubMed] [Google Scholar]
- 32.Puthalakath H, Strasser A. Cell Death Differ. 2002;9:505–512. doi: 10.1038/sj.cdd.4400998. [DOI] [PubMed] [Google Scholar]
- 33.Lowman XH, McDonnell MA, Kosloske A, Odumade OA, Jenness C, Karim CB, Jemmerson R, Kelekar A. Molecular cell. 2010;40:823–833. doi: 10.1016/j.molcel.2010.11.035. [DOI] [PubMed] [Google Scholar]
- 34.Pang YP, Dai H, Smith A, Meng XW, Schneider PA, Kaufmann SH. Scientific reports. 2012;2:257. doi: 10.1038/srep00257. [DOI] [PMC free article] [PubMed] [Google Scholar]
- 35.Xue B, Dunbrack RL, Williams RW, Dunker AK, Uversky VN. Biochim Biophys Acta. 2010;1804:996–1010. doi: 10.1016/j.bbapap.2010.01.011. [DOI] [PMC free article] [PubMed] [Google Scholar]
- 36.Dosztanyi Z, Csizmok V, Tompa P, Simon I. Bioinformatics. 2005;21:3433–3434. doi: 10.1093/bioinformatics/bti541. [DOI] [PubMed] [Google Scholar]
- 37.Linding R, Jensen LJ, Diella F, Bork P, Gibson TJ, Russell RB. Structure. 2003;11:1453–1459. doi: 10.1016/j.str.2003.10.002. [DOI] [PubMed] [Google Scholar]
- 38.Zhang T, Faraggi E, Xue B, Dunker AK, Uversky VN, Zhou Y. Journal of biomolecular structure & dynamics. 2012;29:799–813. doi: 10.1080/073911012010525022. [DOI] [PMC free article] [PubMed] [Google Scholar]
- 39.Walsh I, Martin AJ, Di Domenico T, Tosatto SC. Bioinformatics. 2012;28:503–509. doi: 10.1093/bioinformatics/btr682. [DOI] [PubMed] [Google Scholar]
- 40.Best RB, Zhu X, Shim J, Lopes PE, Mittal J, Feig M, Mackerell AD., Jr Journal of chemical theory and computation. 2012;8:3257–3273. doi: 10.1021/ct300400x. [DOI] [PMC free article] [PubMed] [Google Scholar]
- 41.MacKerell J, Bashford ADD, Bellott M, Dunbrack RL, Jr, Evanseck JD, Field MJ, Fischer S, Gao J, Guo H, Ha S, Joseph-McCarthy D, Kuchnir L, Kuczera K, Lau FTK, Mattos C, Michnick S, Ngo T, Nguyen DT, Prodhom B, Reiher I, Roux WEB, Schlenkrich M, Smith JC, Stote R, Straub J, Watanabe M, Wiorkiewicz-Kuczera J, Yin D, Karplus M. J Phys Chem B. 1998;102:3586–3616. doi: 10.1021/jp973084f. [DOI] [PubMed] [Google Scholar]
- 42.Espinoza-Fonseca LM, Ilizaliturri-Flores I, Correa-Basurto J. Molecular bioSystems. 2012;8:1798–1805. doi: 10.1039/c2mb00004k. [DOI] [PubMed] [Google Scholar]
- 43.Phillips JC, Braun R, Wang W, Gumbart J, Tajkhorshid E, Villa E, Chipot C, Skeel RD, Kale L, Schulten K. J Comput Chem. 2005;26:1781–1802. doi: 10.1002/jcc.20289. [DOI] [PMC free article] [PubMed] [Google Scholar]
- 44.Weber W, Hünenberger PH, McCammon JA. J Phys Chem B. 2000;104:3668–3675. [Google Scholar]
- 45.Darden T, York D, Pedersen L. J Chem Phys. 1993;98:10089–10092. [Google Scholar]
- 46.Essmann U, Perera L, Berkowitz ML. J Chem Phys. 1995;103:8577–8593. [Google Scholar]
- 47.Rautureau GJ, Day CL, Hinds MG. Int J Mol Sci. 2010;11:1808–1824. doi: 10.3390/ijms11041808. [DOI] [PMC free article] [PubMed] [Google Scholar]
- 48.Campen A, Williams RM, Brown CJ, Meng J, Uversky VN, Dunker AK. Protein Pept Lett. 2008;15:956–963. doi: 10.2174/092986608785849164. [DOI] [PMC free article] [PubMed] [Google Scholar]
- 49.Cuff JA, Barton GJ. Proteins. 2000;40:502–511. doi: 10.1002/1097-0134(20000815)40:3<502::aid-prot170>3.0.co;2-q. [DOI] [PubMed] [Google Scholar]
- 50.Jones DT. J Mol Biol. 1999;292:195–202. doi: 10.1006/jmbi.1999.3091. [DOI] [PubMed] [Google Scholar]
- 51.Papoian GA. Proc Natl Acad Sci U S A. 2008;105:14237–14238. doi: 10.1073/pnas.0807977105. [DOI] [PMC free article] [PubMed] [Google Scholar]
- 52.Frishman D, Argos P. Proteins. 1995;23:566–579. doi: 10.1002/prot.340230412. [DOI] [PubMed] [Google Scholar]
- 53.Khrapunov S. Anal Biochem. 2009;389:174–176. doi: 10.1016/j.ab.2009.03.036. [DOI] [PMC free article] [PubMed] [Google Scholar]
- 54.Wathen B, Jia Z. J Biol Chem. 2010;285:18376–18384. doi: 10.1074/jbc.M110.120824. [DOI] [PMC free article] [PubMed] [Google Scholar]
- 55.Fuxreiter M, Simon I, Friedrich P, Tompa P. J Mol Biol. 2004;338:1015–1026. doi: 10.1016/j.jmb.2004.03.017. [DOI] [PubMed] [Google Scholar]
- 56.Hamelberg D, Shen T, McCammon JA. Proc Natl Acad Sci U S A. 2007;104:14947–14951. doi: 10.1073/pnas.0703151104. [DOI] [PMC free article] [PubMed] [Google Scholar]
- 57.Millhauser GL. Biochemistry. 1995;34:3873–3877. doi: 10.1021/bi00012a001. [DOI] [PubMed] [Google Scholar]
- 58.Oldfield CJ, Cheng Y, Cortese MS, Romero P, Uversky VN, Dunker AK. Biochemistry. 2005;44:12454–12470. doi: 10.1021/bi050736e. [DOI] [PubMed] [Google Scholar]
- 59.Csizmok V, Bokor M, Banki P, Klement E, Medzihradszky KF, Friedrich P, Tompa K, Tompa P. Biochemistry. 2005;44:3955–3964. doi: 10.1021/bi047817f. [DOI] [PubMed] [Google Scholar]
- 60.Mohan A, Oldfield CJ, Radivojac P, Vacic V, Cortese MS, Dunker AK, Uversky VN. J Mol Biol. 2006;362:1043–1059. doi: 10.1016/j.jmb.2006.07.087. [DOI] [PubMed] [Google Scholar]
- 61.Sheu SY, Yang DY, Selzle HL, Schlag EW. Proc Natl Acad Sci U S A. 2003;100:12683–12687. doi: 10.1073/pnas.2133366100. [DOI] [PMC free article] [PubMed] [Google Scholar]
- 62.Bah A, Vernon RM, Siddiqui Z, Krzeminski M, Muhandiram R, Zhao C, Sonenberg N, Kay LE, Forman-Kay JD. Nature. 2014 doi: 10.1038/nature13999. [DOI] [PubMed] [Google Scholar]
- 63.Richardson JS, Richardson DC. Proc Natl Acad Sci U S A. 2002;99:2754–2759. doi: 10.1073/pnas.052706099. [DOI] [PMC free article] [PubMed] [Google Scholar]


