

Abstract
2-Amino-1-methyl-6-phenylimidazo[4,5-b]pyridine (PhIP) is a carcinogenic heterocyclic aromatic amine formed in cooked meat. The use of naturally colored hair containing PhIP can serve as a long-term biomarker of exposure to this carcinogen. However, the measurement of PhIP in dyed hair, a cosmetic treatment commonly used by the adult population, is challenging because the dye process introduces a complex mixture of chemicals into the hair matrix, which interfere with the measurement of PhIP. The high-resolution scanning features of the Orbitrap Fusion™ mass spectrometer were employed to biomonitor PhIP in dyed hair. Because of the complexity of chemicals in the hair dye, the consecutive reaction monitoring of PhIP at the MS3 scan stage was employed to selectively remove the isobaric interferences. The limit of quantification (LOQ) of PhIP was 84 parts-per-trillion (ppt) employing 50 mg hair. Calibration curves were generated in dyed hair matrices and showed good linearity (40 to 1000 pg PhIP/g hair) with a goodness-of-fit regression value r2 > 0.9978. The within-day (between-day) coefficients of variation were 7.7% (17%) and 5.4% (6.1%), respectively, with dyed hair samples spiked with PhIP at 200 and 600 ppt. The levels of PhIP accrued in dyed hair from volunteers on a semi-controlled feeding study who ingested known levels of PhIP were comparable to the levels of PhIP accrued in hair of subjects with natural hair color. The method was successfully employed to measure PhIP in non-dyed and dyed hair biospecimens of participants in a case-control study of colorectal adenoma on their regular diet.
INTRODUCTION
2-Amino-1-methyl-6-phenylimidazo[4,5-b]pyridine (PhIP), a carcinogenic heterocyclic aromatic amine (HAA), is formed in well-done cooked meat at levels ranging from several parts per billion (ppb) up to 500 ppb.1–4 PhIP and other HAAs produced during high temperature cooking of meats have been linked to several dietary-associated cancers such as colon, prostate, and female mammary gland.5–6 PhIP and its metabolites can be measured in urine; however, these biomarkers are short-lived and must be measured within 24 – 48 hour of ingestion of cooked meat.7–8 For individuals who chronically but intermittently consume cooked meats, urinary biomarkers of PhIP can be at undetectable levels and these individuals can be misclassified. Thus, long-lived biomarkers are required for human biomonitoring.
Human hair has served as a matrix to biomonitor exposure to veterinary drugs or narcotics, and drugs of abuse.9–11 High performance liquid chromatography (HPLC)-Mass spectrometry (MS) stands out from other analytical methods for the analysis of contaminants in hair because of its fast operation and high level of sensitivity.10–11 Reports have recently emerged on the quantification of recreational illicit drugs in hair, including morphine, codeine, and their metabolites, by high resolution mass spectrometry (HRMS), employing a LTQ Orbitrap MS or a LTQ-Orbitrap XL™ MS in the full scan mode with a resolution of 60,000 or greater.12–14 Exogenous androgen anabolic steroids also have been measured using a single stage Orbitrap (Exactive™ Orbitrap MS).15
Hair dye treatments have been used for cosmetic purposes throughout history, and a considerable proportion of population world-wide use hair dye products, especially permanent hair dyes.16 The color formation of the permanent hair dye treatment is an oxidative process employing hydrogen peroxide and pre-colorants, primarily substituted aromatic amines.17 We and others have shown that a portion of the PhIP ingested becomes entrapped in the human hair follicle and is incorporated into the cortex of the newly grown hair shaft.18–21 We established an HPLC-triple quadrupole (TQ)-MS/MS method to measure PhIP in non-dyed human hair and animal fur with excellent reproducibility and an LOQ value of 50 pg/g in natural colored hair.20–22 However, the treatment of hair with dyes results in the formation of a complex array of chemicals in the hair matrix and the TQ-MS/MS is not sufficiently selective to assay PhIP in dyed hair.23
To our knowledge, there are no reports in the literature on the measurements of dietary or environmental carcinogens, in dyed hair samples by HPLC-MS. In this work, we have developed a method, employing UPLC-Orbitrap HRMS at the MS3 scan stage, to measure PhIP in dyed hair samples of subjects on a semi-controlled feeding study where known quantities of PhIP were ingested. We also show that the method can be employed to measure PhIP in dyed hair of patients on their regular diet in a case-control study of colorectal adenoma.
EXPERIMENTAL SECTION
Caution: PhIP is a potential human carcinogen and should be handled with caution in a well-ventilated fume hood with the appropriate protective clothing.
Materials
PhIP and 2-amino-1-trideuteromethyl-6-phenylimidazo[4,5-b]pyridine ([2H3C]-PhIP (99% isotopic purity) were purchased from Toronto Research Chemicals (Toronto, ON, Canada). Oasis MCX cartridges (30 mg) were purchased from Waters (Milford, MA). LC/MS grade NH4HCO3 was purchased from Sigma Aldrich (St. Louis, MO). Optima™ LC-MS grade formic acid, acetonitrile, ammonia, and water, were purchased from Fisher Chemical (Pittsburgh, PA). L’Oréal Superior Performance permanent dye, level 3 soft black natural color (L’Oréal USA, Inc., New York, NY) and Clairol Nice’n Easy permanent dye, 5/118 natural medium brown color (P&G Beauty, New York, NY), were purchased from a local supermarket in Minneapolis, MN.
Study subjects and semi-controlled meat feeding study
Volunteers were recruited from the University of Hawaii (Honolulu, HI). Inclusion criteria included regular beef eater, age >18, no use of hair dyes, taking no prescribed or over-the-counter medication except an occasional analgesic. The population demographics were described and reported in Supporting Information.21 All subjects provided informed consent, and the study was approved by the Institutional Review Board of the University of Hawaii and University of Minnesota, and the Wadsworth Center, New York State Department of Health (Albany, NY).
Isolation of PhIP from hair samples
The tandem solvent and solid phase extraction (SPE) of PhIP from hair was published.20–22 The protocol is provided in Supporting Information. Fifty mg of finely minced hair was employed for each sample work-up with the internal standard [2H3C]-PhIP spiked at the level of 1000 pg/g hair.
UPLC/TQ-MS/MS analysis of PhIP in hair
The analysis was performed with a nanoAcquity UPLC system (Waters Corporation) equipped with a BEH Shield RP18 column (0.3 × 150 mm, 1.7 μm, Waters Corporation) and a HESI II source interfaced with a TSQ Quantiva™ TQ mass spectrometer (Thermo Scientific, San Jose, CA). Solvent A was 5 mM NH4HCO3 (pH 9.0) and solvent B was CH3CN. A linear gradient was employed, starting at 10% B and arriving to 99% B in 10 min at a flow rate 5 μL/min.. The MS instrument parameters were: positive spray voltage, 3000 V; Nitrogen was the sheath gas, 4 arbitrary units; no auxiliary gas and sweep gas; ion transfer tube temperature, 400 °C; dwell time, 10 ms; Q1 and Q3 resolution (FWHM), 0.7; Argon was the CID gas, 1.5 mTorr; source fragmentation, 10 V. The selected reaction monitoring (SRM) scan transitions were: PhIP, 225.1 > 210.1, 140.1; and [2H3C]-PhIP, 228.1 > 210.1, 140.1.
UPLC/Ion trap-Orbitrap-MS3 analysis of PhIP in hair
The chromatography was performed with an UltiMate® 3000 RSLCnano UHPLC system (Thermo Scientific) equipped with the same BEH Shield RP18 column and a HESI II source interfaced with an Orbitrap Fusion™ Tribrid™ mass spectrometer (Thermo Scientific). The same UHPLC solvents and programs were applied as described above. The MS instrument parameters were: positive spray voltage, 2500 V; Nitrogen was the sheath gas, 8 arbitrary units; auxiliary gas, 5 arbitrary units; no sweep gas; ion transfer tube temperature, 320 °C; S-lens RF level, 110%; in-source fragmentation, 30 eV; isolation mode for MS2 precursor selection, quadrupole; isolation width 1.2 m/z; MS2 activation type, collision induced dissociation (CID); activation Q, 0.35; activation time, 10 ms; collision energy, 42%; MS3 ion trap isolation width, 0.4 m/z; MS3 activation type, high energy collision induced dissociation (HCD); HCD collision energy, 50%; detector type, Orbitrap; resolution, 120 000; AGC target, 5.0 × 10⁴; maximum injection time, 100 ms; 1 microscan. Mass list: PhIP: 225.114 (MS) > 210.091 (MS2), mass range 100–250 m/z; [2H3C]-PhIP: 228.133 (MS) > 210.091 (MS2), mass range 100–250 m/z.
Calibration curve and quantitation of PhIP
PhIP and [2H3C]-PhIP were measured at MS3 scan stage using the common product ion at m/z 141.0573, with a 5 ppm mass tolerance. [2H3C]-PhIP was spiked at the level of 1000 pg/g hair, and seven calibrant levels were constructed with PhIP (0, 40, 100, 200, 400, 500, 1000 pg/g hair) employing 50 mg of dyed hair (N=3). Details of sample preparation are reported in Supporting Information. Data were fitted to a straight line (area of response of PhIP/internal standard versus the amount of PhIP/internal standard) using ordinary least-squares with equal weightings.
Method validation
The within-day and between-day reproducibility was performed by spiking 200 or 600 pg PhIP/g hair of freshly cut hair from two subjects tested positive for PhIP prior to hair dye treatment. Subject one (86 ± 20 pg PhIP/g hair, Mean ± SD, N = 3) was spiked with 200 pg PhIP/g hair, prior to treatment with hair dye #1 (see Supporting Information). Subject two (117 ± 20 pg PhIP/g hair, Mean ± SD, N = 3) was spiked with 600 pg PhIP/g hair with hair dye #2. The reproducibility studies were repeated on three different days. The dyeing procedure followed the instructions of the manufacturer and is described in Supporting Information. The % coefficient of variation (%CV) was used as the measure of reproducibility.
RESULTS AND DISCUSSION
Product ion spectra of PhIP at the MS3 scan stage
The chemical structure of PhIP and its major fragment ions produced by CID-HCD are presented in Figure 1. Both PhIP and [2H3C]-PhIP undergo CID to produce a single major fragment ion [M+H-CH3•]+ and [M+H-2H3C•]+ at m/z 210.0900. At the MS3 scan stage, employing HCD, prominent fragment ions of both PhIP and [2H3C]-PhIP occur at m/z 183.0791, 168.0682, and 141.0573.
Figure 1.
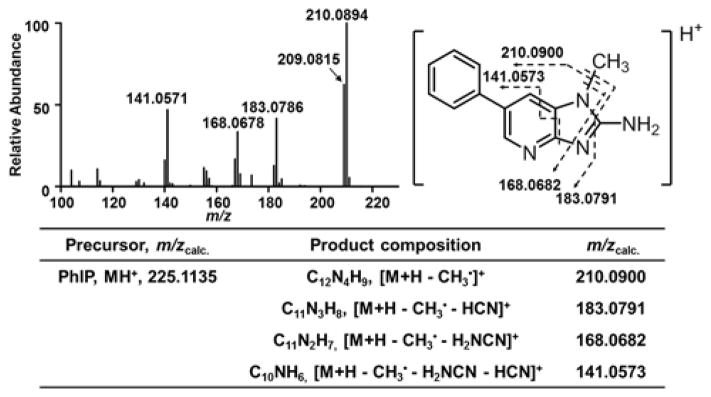
Product ion spectrum of PhIP at the MS3 scan stage. The MS2 fragmentation was performed by CID in the first scan stage in the ion trap, to form the base peak at m/z 210.09, which underwent HCD with detection in the Orbitrap at a resolution of 120,000. The chemical structure of PhIP and the proposed fragment ions are shown. The calculated m/z of the major fragment ions are shown in the table.
UPLC/TQ-MS/MS and UPLC/IT-Orbitrap-MSn
The oxidation process of the permanent dyes introduces a complex array of chemicals into the hair matrix. We conducted the analysis of PhIP in dyed hair samples by the UPLC/TQ-MS/MS method previously established for the measurement of PhIP in naturally colored hair.20–21 Our original chromatography conditions required modification because of the large amount of isobaric interferences from the dyed hair matrix that co-eluted with PhIP.24 We adapted the chromatographic conditions by employing NH4HCO3 (pH.9.0) as a modifier,24 which improved the separation of PhIP from the bulk of the interfering chemicals in the dyed hair matrix. However, severe isobaric interferences remained and precluded reliable quantitation of PhIP by UPLC/TQ-MS/MS (Figure S-1). Iwasaki also reported that PhIP in dyed hair samples could not be measured, by HPLC-TQ-MS/MS.23 Thus, we explored the scanning features of the Orbitrap Fusion™ Tribrid™ MS, by employing high resolution multistage MSn, to measure PhIP in dyed hair.
Full scan monitoring of the protonated PhIP and [2H3C]-PhIP ([M+H]+ at m/z 225.1135 and 228.1323, respectively) was done with the Orbitrap at a resolution of 120,000 and an elevated source fragmentation voltage (35 V) to induce in-source fragmentation of fragile molecules that may interfere with PhIP or its internal standard. However, even with a stringent mass tolerance of 5 ppm, significant amounts of isobaric interferences of PhIP were observed (Figure 2A and 2D). The MS2 scan stage mode employing either HCD or CID for fragmentation produced a major fragment ion at m/z 210.0900, attributed to cleavage of the CH3 moiety of PhIP [M+H-CH3•]+, was examined for monitoring PhIP. However, background isobaric interference signals were still within the 5 ppm of m/z 210.0900 for some dyed hair samples. Moreover, the relative ion abundances of other fragment ions were well below 10% of the base peak, precluding the reliable use of secondary fragment ions for structural confirmation of PhIP at the MS2 scan stage (Figure 2B and 2E).
Figure 2.

Representative EIC of PhIP and [2H3C]-PhIP in dyed hair of subjects with a quantifiable level of PhIP by UPLC/IT-Orbitrap-MS in (A) full scan mode, (B) MS2 and (C) MS3 scan stage and their corresponding mass spectra (D to F). Data were acquired with a resolution of 120,000 and a mass tolerance of 5 ppm. The insert in A is a zoom-in of the tR 8–11 min. PhIP elutes at ~ tR = 9.4 min.
Thereafter, we investigated consecutive reaction monitoring of PhIP at the MS3 scan stage. The optimized scan parameters employed CID fragmentation of PhIP, to isolate the [M+H-CH3•]+ fragment ion at m/z 210.1 in the ion trap, followed by MS3 employing HCD with detection of the ions of PhIP (225.1 > 210.1 >) and [2H3C]-PhIP (228.1 > 210.1 >) in the Orbitrap. The radical cation of PhIP [M+H-CH3•]+ at m/z 210.0900 remained the major ion at the MS3 scan stage. However, the extracted ion chromatogram (EIC) at m/z 210.0900 of some dyed hair samples still contained interferences within the 5 ppm mass tolerance window. Therefore, the fragment ion at m/z 141.0573, the second most abundant ion in the HCD spectrum (Figure 1), was selected as the target ion for quantification of PhIP (Figure 2C and 2F). The employment of the MS3 scan stage was crucial in obtaining peaks devoid of isobaric interferences.
Validation of the method
A seven-point calibration curve of the ion at m/z 141.0573, ranging from 0, 40 up to 1000 pg of PhIP/g hair was constructed from two post-dyed hair samples. The levels of calibrants and concentration range were chosen based on our published data on the levels of PhIP in naturally colored hair.20–21 Each calibrant point was obtained as the average of 3 samples. The calibration curves of both post-dyed hair samples were combined and shown in Figure S-2. The linearity of the calibration curve is shown by the slope, the goodness-of-fit linear regression value, r2 = 0.9978, and supported by residuals plots (data not shown).25–26
The background signal at m/z 141.0573 was employed to determine the LOD and LOQ values of PhIP in dyed hair samples that contained no detectable PhIP. Based upon recommended guidelines for data acquisition and quality evaluation in environmental chemistry, the values of the LOD and LOQ for analytes were set at 3σ and 10σ SD units above the background level signal of an uncontaminated matrix.27 However, the precision and reproducibility of measurements at the LOD and LOQ levels employing a high resolution ion-trap MS-based instrument at the MS3 scan stage are impacted by both the signal intensity and the number of scans acquired across the peak. In addition, there is often no measurable background signal especially for MSn analysis. In the unspiked hair sample, a very weak signal was obtained on just two scans for m/z 141.0573, both of which were within the full width at half maximum (FWHM) of the peak as defined by the internal standard peak (Figure S-3). When hair samples were spiked with 100 pg PhIP/g hair, a level near LOQ (vide infra), seven to nine scans were acquired at FWHM, and 13 to 16 scans were acquired across the full width of the peak. At spiking levels above 100 pg PhIP/g hair, the number of scans closely matched those of the internal standard spiked in hair at a level of 1000 pg/g hair: 8 to 12 scans were obtained at FWHM and 19 to 22 scans were acquired across the full width of the peak. Increasing the maximum injection time from 100 to 500 ms decreased the number of scans across the peak for the internal standard [2H3C]-PhIP by ~50%; however, the ion signal statistics and peak shape of the target analyte PhIP improved, particular at the LOQ. Therefore, the LOD and LOQ were estimated by the standard deviation of the response of the slope (s), using the respective formulae: and .26 The LOD was estimated at about 28 pg PhIP/g hair, and the LOQ value was estimated at 84 pg PhIP/g hair.
The validation of the analytical method was conducted on two other dyed hair samples. Both subjects had low levels of PhIP, which bordered the LOQ value. The performance of the analytical method was determined by performing 4 independent measurements of PhIP on three different days. The results are summarized in Table 1. The overall accuracy was 100 ± 15% at the 200 ppt spiking level, and 103 ± 1.5% at the 600 ppt spiking level. The intra-day and inter-day precision values, represented as the %CV of PhIP, were between 5.4 – 7.7% and 6.1 and 17%, respectively.
Table 1.
Within-day and between-day estimates of PhIP (pg/g hair) spiked into post-dye hair sample.
| Subject | Unspiked post-dye (pg/g hair) | Spiking level (pg/g hair) | Day 1 | Day 2 | Day 3 | CV (%)within- day | CV (%)between-day | |
|---|---|---|---|---|---|---|---|---|
| 1 | Mean | 86 | 200 | 245 (86%)1 | 327 (115%)1 | 283 (99%)1 | ||
| SD | 20 | 16 | 22 | 25 | ||||
| RSD (%) | 24 | 6.6 | 6.7 | 8.9 | 7.7 | 17 | ||
| 2 | Mean | 117 | 600 | 747 (104%)1 | 731 (101%)1 | 742 (103%)1 | ||
| SD | 20 | 48 | 48 | 19 | ||||
| RSD (%) | 17 | 6.4 | 6.5 | 2.5 | 5.4 | 6.1 |
Within-day and between-day estimates were conducted with 4 independent measurements on three different days
Unspiked post-dye estimates were conducted with 3 independent measurements
Values in parentheses represent accuracy of the method.
Stability and recovery of PhIP in hair treated with permanent hair dyes
The treatment of hair with permanent dyes can result in the possible loss of PhIP by several mechanisms. The alkaline pH of the dying mixture swells the hair shaft and allows the hydrogen peroxide to penetrate and oxidize the users’ natural hair colorants.28 The hydrogen peroxide also may oxidize the exocyclic amino group, the ring system or pyridine nitrogen atom of PhIP;29 or the oxidized primary amine group of PhIP may be coupled to functional groups such as phenol sulfates in the dye complex.17 The conditioning and rinsing process also may wash-out some of the PhIP from the newly dyed hair. PhIP levels before and after the permanent hair dyeing process from samples of two positive subjects were compared (Table S-1). The amount of PhIP in hair of subject 1, pre- and post-dyed hair was 78 ± 7.8 versus 86 ± 20 (Mean, ± SD, n=4), and the levels of PhIP were not significantly different (P = 0.49). For subject 2, the level of PhIP in pre- and post-dyed hair was 179 ± 8.8 versus 117 ± 20 (Mean, ± SD, n=3). The levels of PhIP were significantly lower in post-dyed hair of subject 2 (P = 0.0038). The stability of PhIP in the dyed hair matrix will depend upon the natural pigmentation of hair, as well as the composition of ingredients in the hair dye. The treatment of dyed hair by chemical reduction employing Zn at 60 °C for 2 h was examined to determine if the levels of PhIP increased. PhIP was stable under these reducing conditions;30–31 however, the reduction did not increase the PhIP content in dyed hair (Table S-2). These data demonstrate that a significant portion of the PhIP in hair survives the permanent dye treatment process.
PhIP hair biomarkers in dyed hair of subjects on a semi-controlled meat feeding study
The subjects provided hair (50–200 mg) from the nape of the neck prior to the commencement of the 3 week feeding study with cooked meat. During this time, the subjects refrained from eating well-done cooked meat containing PhIP. The volunteers then, consumed well-done meat 5 days per week for 3 weeks, then dyed their hair immediately after completion of the feeding study and provided another set of newly grown hair from the nape of the neck. The newly grown hair represents an accrual of the dietary exposure to PhIP during the preceding 3 weeks.21
The levels of PhIP in the naturally colored hair of 14 subjects pre-feeding and in their hair dyed immediately following 3 weeks of feeding of cooked meat are depicted in Figure S-4. The mean level of PhIP in the hair samples obtained during pre-feeding was below LOQ (84 pg/g hair), except for subjects 306 and 312 (Table S-3). Following the semi-controlled feeding study, the mean level of PhIP increased in the dyed hair samples on average by 7-fold above the LOQ value (mean level 563, range 52 to 1343 pg PhIP/g hair). Representative chromatograms and HCD product ion spectra from the same subject, pre-feeding with a level of PhIP at 30 pg/g hair and post-feeding with a level of PhIP at 623 pg/g hair, are shown in Figure S-5. The increase in the level of PhIP accrued in the dyed hair samples is similar to the level accumulated in non-dyed hair samples of volunteers following feeding with similar amounts of PhIP in cooked beef.21 This reaffirms our findings that a major portion of PhIP in the hair matrix is stable towards the oxidative permanent dye process.
Identification of PhIP in hair of patients in a case-control study of colorectal adenoma
We sought to determine if our analytical method could be implemented to biomonitor PhIP in hair of subjects from a case-control study of colorectal adenoma. The subjects were on their regular diet and collected a sample of their hair at the time of a haircut. Dyed hair samples from two patients with colorectal adenoma, one negative and one positive for PhIP, are depicted in Figure 3. The product ion spectra confirm the identity of the analyte as PhIP.
Figure 3.

Representative EIC (shown as sticks) of PhIP and [2H3C]-PhIP from dyed hair samples of colorectal adenoma patients analyzed by UPLC/IT-Orbitrap-MS at the MS3 scan stage with a resolution 120,000 and mass tolerance 5 ppm: (A) subject negative for PhIP and (B) subject positive for PhIP (104 pg/g hair). The background subtracted product ion spectra of PhIP and [2H3C]-PhIP in dyed hair of subject positive for PhIP are shown in C. X is a background contaminant.
Conclusions
To our knowledge, this is the first report on the identification and quantitation of dietary carcinogens in hair of subjects who color their hair with permanent dyes, the most popular dye treatment.16 Remarkably, our data show that a major portion of PhIP survives the hair dye oxidation process and can be recovered by alkaline digestion of the hair samples. The selectivity of HRMS of the Orbitrap Fusion™ MS at the MS3 scan stage was crucial for the successful measurement of PhIP in dyed hair samples. Applying this method, we were able to measure PhIP from dyed hair of subjects on the semi-controlled feeding study. Our preliminary data also show that PhIP can be measured in both naturally colored hair (unpublished data) and dyed hair of subjects with colorectal adenoma on their regular diet. The sensitivity and the LOQ of measurement of PhIP in dyed hair by UPLC/IT-Orbitrap-MS3 is comparable to that of the UPLC/TQ-MS/MS, when assaying naturally colored hair samples.20–21
Supplementary Material
Acknowledgments
Funding: This research was supported by grant R01 CA122320 (R.J.T.) and Center Support grant no. CA-77598 (R.J.T.) from the National Cancer Institute, and by Grant RFA 09/149 (L. L.M.) from the World Cancer Research Fund United Kingdom.
Funding: This research was supported by grant R01 CA122320 (R.J.T.) from the National Cancer Institute, and in part by National Cancer Institute Cancer Center Support grant no. CA-77598 (R.J.T.); and grant RFA 09/149 (L. L.M.) from the World Cancer Research Fund United Kingdom.
The authors thank Dr. Peter Villalta and Dr. Byeong Hwa Yun from Masonic Cancer Center, University of Minnesota, for helpful discussion on the manuscript and on the operation of the Orbitrap Fusion mass spectrometer.
Footnotes
Supporting Information Available: This material is available free of charge via the Internet at http://pubs.acs.org
References
- 1.Sugimura T, Wakabayashi K, Nakagama H, Nagao M. Cancer Sci. 2004;95:290–299. doi: 10.1111/j.1349-7006.2004.tb03205.x. [DOI] [PMC free article] [PubMed] [Google Scholar]
- 2.Felton JS, Jagerstad M, Knize MG, Skog K, Wakabayashi K. In: Food Borne Carcinogens Heterocyclic Amines. Nagao M, Sugimura T, editors. John Wiley & Sons Ltd; Chichester, England: 2000. pp. 31–71. [Google Scholar]
- 3.Knize MG, Dolbeare FA, Carroll KL, Moore DH, Felton JS. Food Chem Toxicol. 1994;32:595–603. doi: 10.1016/0278-6915(94)90002-7. [DOI] [PubMed] [Google Scholar]
- 4.Ni W, McNaughton L, LeMaster DM, Sinha R, Turesky RJ. J Agric Food Chem. 2008;56:68–78. doi: 10.1021/jf072461a. [DOI] [PubMed] [Google Scholar]
- 5.Zheng W, Lee SA. Nutr Cancer. 2009;61:437–446. doi: 10.1080/01635580802710741. [DOI] [PMC free article] [PubMed] [Google Scholar]
- 6.Le Marchand L, Hankin JH, Pierce LM, Sinha R, Nerurkar PV, Franke AA, Wilkens LR, Kolonel LN, Donlon T, Seifried A, Custer LJ, Lum-Jones A, Chang W. Mutat Res. 2002;506–507:205–214. doi: 10.1016/s0027-5107(02)00167-7. [DOI] [PubMed] [Google Scholar]
- 7.Boobis AR, Lynch AM, Murray S, de la Torre R, Solans A, Farr‚ M, Segura J, Gooderham NJ, Davies DS. Cancer Res. 1994;54:89–94. [PubMed] [Google Scholar]
- 8.Turesky RJ, Le Marchand L. Chem Res Toxicol. 2011;24:1169–1214. doi: 10.1021/tx200135s. [DOI] [PMC free article] [PubMed] [Google Scholar]
- 9.Wada M, Ikeda R, Kuroda N, Nakashima K. Anal Bioanal Chem. 2010;397:1039–1067. doi: 10.1007/s00216-010-3569-z. [DOI] [PubMed] [Google Scholar]
- 10.Vincenti M, Salomone A, Gerace E, Pirro V. Mass Spectrom Rev. 2013;32:312–332. doi: 10.1002/mas.21364. [DOI] [PubMed] [Google Scholar]
- 11.Vincenti M, Salomone A, Gerace E, Pirro V. Bioanalysis. 2013;5:1919–1938. doi: 10.4155/bio.13.132. [DOI] [PubMed] [Google Scholar]
- 12.Vogliardi S, Favretto D, Tucci M, Stocchero G, Ferrara SD. Anal Bioanal Chem. 2011;400:51–67. doi: 10.1007/s00216-011-4742-8. [DOI] [PubMed] [Google Scholar]
- 13.Favretto D, Vogliardi S, Stocchero G, Nalesso A, Tucci M, Ferrara SD. J Chromatogr A. 2011;1218:6583–6595. doi: 10.1016/j.chroma.2011.07.050. [DOI] [PubMed] [Google Scholar]
- 14.Ye HY, Zheng SQ, Liang C, Wang R, Zhang YR, Zhang LY, Zhang WB, Zhang RS. Chinese Journal of Analytical Chemistry. 2012;40:1674–1679. [Google Scholar]
- 15.Strano-Rossi S, Castrignano E, Anzillotti L, Odoardi S, De-Giorgio F, Bermejo A, Pascali VL. Anal Chim Acta. 2013;793:61–71. doi: 10.1016/j.aca.2013.07.028. [DOI] [PubMed] [Google Scholar]
- 16.Reisch MS. Chem Eng News. 2003;81:25–27. [Google Scholar]
- 17.Morel OJX, Christie RM. Chem Rev. 2011;111:2537–2561. doi: 10.1021/cr1000145. [DOI] [PubMed] [Google Scholar]
- 18.Reistad R, Nyholm SH, Huag LS, Becher G, Alexander J. Biomarkers. 1999;4:263–271. [Google Scholar]
- 19.Hashimoto H, Hanaoka T, Kobayashi M, Tsugane S. J Chromatogr B Analyt Technol Biomed Life Sci. 2004;803:209–213. doi: 10.1016/j.jchromb.2003.12.029. [DOI] [PubMed] [Google Scholar]
- 20.Bessette EE, Yasa I, Dunbar D, Wilkens LR, Marchand LL, Turesky RJ. Chem Res Toxicol. 2009;22:1454–1463. doi: 10.1021/tx900155f. [DOI] [PMC free article] [PubMed] [Google Scholar]
- 21.Turesky RJ, Liu L, Gu D, Yonemori KM, White KK, Wilkens LR, Le Marchand L. Cancer Epidemiol Biomarkers Prev. 2013;22:356–364. doi: 10.1158/1055-9965.EPI-12-1206. [DOI] [PMC free article] [PubMed] [Google Scholar]
- 22.Gu D, Neuman ZL, Modiano JF, Turesky RJ. J Agric Food Chem Toxicol. 2012;60:9371–9375. doi: 10.1021/jf302969h. [DOI] [PMC free article] [PubMed] [Google Scholar]
- 23.Iwasaki M, Mukai T, Takachi R, Ishihara J, Totsuka Y, Tsugane S. Cancer Causes Control. 2014;25:1015–1028. doi: 10.1007/s10552-014-0401-7. [DOI] [PubMed] [Google Scholar]
- 24.Yin RC, Liu SQ, Zhao C, Lu ML, Tang MS, Wang HL. Anal Chem. 2013;85:3190–3197. doi: 10.1021/ac3034695. [DOI] [PubMed] [Google Scholar]
- 25.Magnusson B, Örnemark U. Eurachem Guide: The Fitness for Purpose of Analytical Methods - A Laboratory Guide to Method Validation and Related Topics. 2. 2014. Available from www.eurachem.org.
- 26.Edwards RJ, Murray BP, Murray S, Schulz T, Neubert D, Gant TW, Thorgeirsson SS, Boobis AR, Davies DS. Carcinogenesis. 1994;15:829–836. doi: 10.1093/carcin/15.5.829. [DOI] [PubMed] [Google Scholar]
- 27.MacDougall D, Amore FJ, Cox GV, Crosby DG, Estes FL, Freeman DH, Gibbs WE, Gordon GE, Keith LH, Lal J, Langner RR, McClelland NI, Phillips WF, Pojasek RB, Sievers RE. Anal Chem. 1980;52:2242–2249. [Google Scholar]
- 28.Valko EI, Barnett G. J Soc Cosmetic Chemists. 1952;3:108–117. [Google Scholar]
- 29.Sidgwick NV. The Organic Chemistry of Nitrogen. 3. Oxford Press; 1966. [Google Scholar]
- 30.Turesky RJ, Freeman JP, Holland RD, Nestorick DM, Miller DW, Ratnasinghe DL, Kadlubar FF. Chem Res Toxicol. 2003;16:1162–1173. doi: 10.1021/tx030029r. [DOI] [PubMed] [Google Scholar]
- 31.Hudlicky M. Reductions in organic chemistry. 2. Vol. 188 American Chemical Society; 1996. [Google Scholar]
Associated Data
This section collects any data citations, data availability statements, or supplementary materials included in this article.