

Abstract
We determined the impact diet induced obesity (DIO) and types 1 and 2 diabetes has on peripheral neuropathy with emphasis on corneal nerve structural changes in C57Bl/6J mice. Endpoints examined included nerve conduction velocity, response to thermal and mechanical stimuli and innervation of the skin and cornea. DIO mice and to a greater extent type 2 diabetic mice were insulin resistant. DIO and both types 1 and 2 diabetic mice developed motor and sensory nerve conduction deficits. In the cornea of DIO and type 2 diabetic mice there was a decrease in sub-epithelial corneal nerves, innervation of the corneal epithelium and corneal sensitivity. Type 1 diabetic mice did not present with any significant changes in corneal nerve structure until after 20 weeks of hyperglycemia. DIO and type 2 diabetic mice developed corneal structural damage more rapidly than type 1 diabetic mice even though hemoglobin A1C values were significantly higher in type 1 diabetic mice. This suggests that DIO with or without hyperglycemia contributes to development and progression of peripheral neuropathy and nerve structural damage in the cornea.
Keywords: obesity, diabetes, diabetic peripheral neuropathy, corneal nerves, corneal confocal microscopy
Introduction
Animal models of obesity and diabetes can play an important role in the discovery of new treatments for diabetic neuropathy (Islam, 2013; Stables, et al., 2013; Hoke, 2012). Streptozotocin is widely used to create rodent models for type 1 diabetes (Islam, 2013; Lenzen, 2008; Rees and Alcolado, 2005). For type 2 diabetes the most common model is the db/db mouse (Fellmann, et al., 2013; Tesch and Lim, 2011). However, concern regarding the translation of results from these mice to humans because of the recessive homozygous mutation in the leptin receptor (fa/fa) (Davis, et al., 2013; Reinwald, et al., 2009) led us to study the development of diabetic neuropathy in the high fat fed/low dose streptozotocin treated mouse.
Unlike rats, feeding C57Bl/6J mice a high fat diet causes an elevated level of fasting blood glucose (Davidson, et al., 2011; Coppey, et al., 2011). However, hyperglycemia in the high fat fed mouse is very modest and not associated with an increase in hemoglobin A1C levels. Using a low dose of streptozotocin with a high fat fed C57Bl/6J mouse creates a higher level of blood glucose. This type 2 diabetic mouse model has been previously used to examine pharmacological interventions, vascular biology and atherosclerosis, cardiomyocyte hypertrophy and β-cell function (Lin, et al., 2014; Zhu, et al., 2014; Mali, et al., 2014; Wang, et al., 2014; Ullevig, et al., 2011; Bansal, et al., 2012; Xue, et al., 2010; Lv, et al., 2010).
Materials and Methods
Unless stated otherwise all chemicals used in these studies were obtained from Sigma Chemical Co. (St. Louis, MO).
C57Bl/6J mice were purchased from Jackson Laboratories. Mice were housed in a certified animal care facility and standard diet (Harlan Teklad, #7001, Madison, WI) and water were provided ad libitum. Measures were taken to minimize pain or discomfort and all experiments were conducted in accordance with international standards on animal welfare and were compliant with all institutional and National Institutes of Health guidelines for use of animals (ACURF protocol 1212258). C57Bl/6J mice at 12 weeks of age were divided into four groups. After 1 week on a standard diet two of the groups were fed a high fat diet (D12492; Research Diets, New Brunswick, NJ). One of these groups was maintained on this diet for the duration of the study and was referred to as the diet induced obesity (DIO) group. To create the type 2 diabetic model, the other high fat fed mouse group after 8 weeks on the high fat diet was treated with 75 mg/kg streptozotocin (EMD Chemicals, San Diego, CA) followed three days later with a second dose of streptozotocin (50 mg/kg). Mice with blood glucose ≥13.8 mM (250 mg/dl) were considered diabetic. This group remained on the high fat diet for the duration of the study. The third group after 8 weeks on the standard diet was treated with multiple doses of streptozotocin to create type 1 diabetes model as previously described (Stavniichuk, et al., 2014). The final group served as the control group and with the type 1 diabetic mice was fed the standard diet for the duration of the study.
Intraperitoneal glucose tolerance test in DIO and type 2 diabetic mice were performed after an overnight fast as previously described (Coppey, et al., 2011). Thermal nociceptive response in the hindpaw was measured using the Hargreaves method with instrumentation provided by IITC Life Science (San Diego, CA) as previously described (Coppey, et al., 2011). Tactile responses were evaluated using von Frey filaments as previously described (Stavniichuk, et al., 2014).
Mice were anesthetized with Nembutal (75 mg/kg, i.p., Abbott Laboratories, North Chicago, IL) and motor and sensory nerve conduction velocities were determined as previously described (Coppey, et al., 2011). Core temperature was monitored using a rectal probe and temperature regulated between 36° C and 37° C using a heating pad and radiant heat. To confirm that a normal temperature near the sciatic nerve was maintained a thermal probe was inserted through an incision in the skin and muscle in the region of the sciatic nerve. In all mice tested temperature near the nerve ranged from 35.6° to 36.4° C. Spectral domain optical coherence tomography (SD-OCT) analysis was performed using a Spectralis SD-OCT (Heidelberg Engineering, Vista, CA) imaging system coupled with a 25D lens (Heidelberg Engineering, Vista, CA), as we have previously described (Yorek, et al., 2014). Sub-epithelial corneal nerves were imaged in vivo using the Rostock cornea module of the Heidelberg Retina Tomograph (Heidelberg Engineering, Vista, CA) confocal microscope as previously described (Yorek, et al., 2014; Davidson, et al., 2012). After completion of all in vivo analyses, corneas were dissected from the eyes and corneal nerves in the sub-epithelial layer and penetrating the epithelium were visualized as previously described (Yorek, et al., 2014). Analysis of corneal nerve images was completed with Imaris software version 7.6.4 X64 (Bitplane, Zurich, Switzerland). Skin from the footpads was collected and intraepidermal nerve fibers immunohistochemical stained and counted as previously described (Stavniichuk, et al., 2014).
Nitrotyrosine and 4-hydroxynonenal fluorescence intensity of individual dorsal root ganglia neurons was determined as previously described (Lupachyk, et al., 2013). Protein bound 3-nitrotyrosine concentration was measured in serum samples by indirect enzyme-linked immunosorbent assay as previously described (Weber, et al., 2012). Serum was also used for determining levels of free fatty acid, triglyceride and free cholesterol using commercial kits as previously described (Yorek, et al., 2014). To examine steatosis liver samples were frozen in OCT compound (Sakura FineTek USA, Torrance, CA) at −80°C. Liver sections, 5 μm, were incubated with BODIPY (Molecular Probes, Carlsbad, CA, USA), at a 1:5000 dilution in 1% BSA for 1h at room temperature. After washing liver sections were mounted using ProLong® Gold antifade reagent (Molecular Probes, Carlsbad, CA, USA) and covered with a glass coverslip. Images were collected using Zeiss LSM confocal laser scanning microscope. Images were analyzed for % area fraction of lipid droplets using Image J software.
Results are presented as mean ± SEM. Comparisons between groups were conducted using a one-way ANOVA and Dunnett’s pairwise test for multiple comparisons (Prism software; GraphPad, San Diego, CA). A p value of less 0.05 was considered significant.
Results
At 13 weeks of age the average weight of the mice assigned to the four different groups were the same. At the end of the 12 week experimental period all mice had gained weight. The type 1 diabetic mice weighed significantly less than the other three groups. The DIO mice and type 2 diabetic mice weighed significantly more than the control mice and DIO mice weighed significantly more than the type 2 diabetic mice. Non-fasting blood glucose and hemoglobin A1C values were significantly increased in the type 1 and type 2 diabetic mice compared to control and DIO mice, which were not significantly different from each other. Hemoglobin A1C and blood glucose levels in type 1 diabetic mice were significantly higher compared to type 2 diabetic mice. Serum lipid levels were mostly unchanged by the experimental conditions the only differences were the significant increase in free fatty acids in type 1 diabetic mice and cholesterol in the DIO mice when compared to control mice. DIO and type 2 diabetic mice had fatty livers compared to control and type 1 diabetic mice (Table 1).
Table 1.
Effect of Diet-induced Obesity or Type 1 or Type 2 Diabetes on Change in Body Weight, non-fasting Blood Glucose, Hemoglobin A1C and Serum Triglycerides, Free Fatty Acids and Cholesterol and Steatosis
| Determination | Control (12) | Type 1 Diabetic (15) | DIO (11) | Type 2 Diabetic (14) |
|---|---|---|---|---|
| Start weight (g) | 24.0 ± 0.5 | 23.4 ± 0.6 | 22.9 ± 0.3 | 22.9 ± 0.2 |
| End weight (g) | 32.3 ± 0.8 | 25.3 ± 0.8a | 48.6 ± 1.1a,b | 37.7 ± 1.4a,b,c |
| Blood glucose (mg/dl) | 196 ± 9 | 462 ± 24a | 233 ± 13b | 350 ± 24a,b,c |
| Hemoglobin A1C (%) | 5.9 ± 0.2 | 13.1 ± 0.6a | 6.2 ± 0.3b | 8.3 ± 0.3a,b,c |
| Serum Triglycerides (mg/dl) | 83.7 ± 14.0 | 89.9 ± 11.3 | 66.1 ± 4.1 | 67.4 ± 9.4 |
| Serum Free fatty acids (mmol/l) | 0.22 ± 0.02 | 0.39 ± 0.04a | 0.23 ± 0.02b | 0.28 ± 0.04 |
| Serum Cholesterol (mg/ml) | 1.29 ± 0.05 | 1.54 ± 0.08 | 2.27 ± 0.26a,b | 1.77 ± 0.11c |
| Steatosis (% area) | 3.4 ± 0.5 | 5.7 ± 0.5 | 26.9 ± 2.2a,b | 26.4 ± 2.5a,b |
Data are presented as the mean ± S.E.M.
p < 0.05 compared to control;
p < 0.05 compared to type 1 diabetic;
p < 0.05 compared to DIO. Parentheses indicate the number of experimental animals.
Serum and dorsal root ganglion neuron nitrotyrosine levels were significantly increased in type 1 and type 2 diabetic mice compared to control mice. 4-Hydroxynonenal level was significantly increased in dorsal root ganglion neurons from type 1 diabetic mice compared to control mice. Motor nerve conduction velocity was significantly slower in mice fed a high fat diet compared to control mice. In type 1 and type 2 diabetic mice, motor nerve conduction velocity was further impaired. Sensory nerve conduction velocity was significantly reduced in DIO mice and type 1 or type 2 diabetic mice compared to control mice (Table 2). Glucose clearance was significantly impaired in mice fed a high fat diet for 20 weeks and to a greater extent in type 2 diabetic mice compared to control mice (Fig. 1).
Table 2.
Effect of Diet-induced Obesity or Type 1 or Type 2 Diabetes on Motor (MNCV) and Sensory (SNCV) Nerve Conduction Velocity, Thermal Nociception, Mechanical Allodynia, Serum Nitrotyrosine and Dorsal Root Ganglion Neurons Nitrotyrosine, 4-Hydroxynonenal (4-HNE) and Inner Retinal Ganglion Cell Complex (RGC) Thickness
| Determination | Control (12) | Type 1 Diabetic (15) | DIO (11) | Type 2 Diabetic (14) |
|---|---|---|---|---|
| MNCV (m/sec) | 51.1 ± 2.8 | 29.2 ± 0.9a | 38.2 ± 2.4a,b | 28.7 ± 1.7a,c |
| SNCV (m/sec) | 29.9 ± 1.1 | 23.3 ± 0.6a | 23.8 ± 0.6a | 23.5 ± 0.7a |
| Thermal sensitivity (sec) | 5.6 ± 0.2 | 8.8 ± 0.3a | 8.0 ± 0.3a | 8.6 ± 0.3a |
| Mechanical response (g) | 2.92 ± 0.21 | 1.07 ± 0.05a | 1.11 ± 0.05a | 1.19 ± 0.08a |
| Serum Nitrotyrosine (pmol/mg protein) | 4.1 ± 0.4 | 5.8 ± 0.4a | 4.4 ± 0.5 | 5.7 ± 0.4a |
| DRG Nitrotyrosine (RFU/cell area (mm2)) | 346 ± 21 | 468± 29a | 414 ± 31 | 452 ± 25a |
| DRG 4-HNE (RFU/cell area (mm2)) | 359 ± 15 | 505 ± 26a | 458 ± 33 | 451 ± 23 |
| RGC (μm) | 77.7 ± 1.1 | 71.3 ± 0.4a | 74.6 ± 0.4 | 72.6 ± 0.7a |
Data are presented as the mean ± S.E.M.
p < 0.05 compared to control;
p < 0.05 compared to type 1 diabetic;
p < 0.05 compared to DIO. Parentheses indicate the number of experimental animals.
Figure 1. Glucose utilization curve for control mice, DIO mice and type 2 diabetic mice.

Fasting blood glucose at time 0 for control, high fat fed and type 2 diabetic mice was 113 ± 8, 163 ± 8* and 257 ± 18*, mg/dl respectively (* p < 0.05, compared to control). Data are the mean ± S.E.M.. The area under the curve (AUC) was significantly different p < 0.01 for DIO mice and type 2 diabetic mice vs. control and p < 0.05 for DIO mice vs. type 2 diabetic mice. The number of mice in each group was the same as shown in Table 1.
Intraepidermal nerve fiber density was significantly decreased in skin from the hindpaw from DIO mice and type 1 and type 2 diabetic mice compared to control mice (Fig. 2). Thermal sensitivity and response to a mechanical stimulus in DIO mice and type 1 and type 2 diabetic mice are also significantly different from control mice (Table 2).
Figure 2. Effect of DIO, type 1 or type 2 diabetes on intraepidermal nerve fiber density.
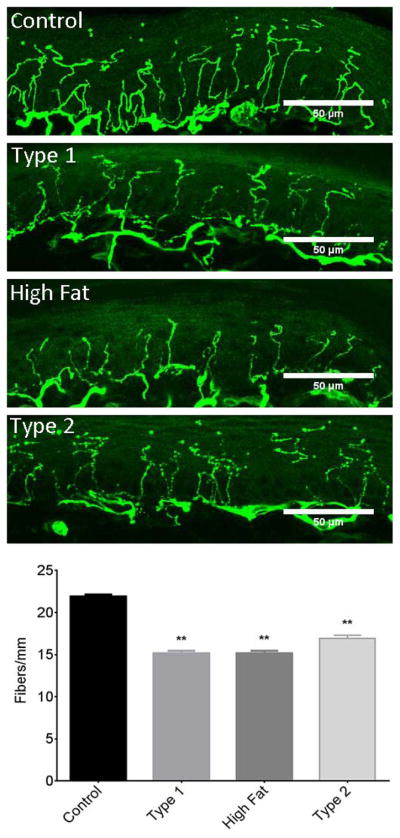
The groups examined and the number of mice in each group was the same as described in Table 1. Data are presented as the mean ± S.E.M. ** p < 0.01 compared to control mice; One-way analysis of variance with Dunnett’s pairwise test for multiple comparisons. Scale bar = 50 μm.
Sub-epithelial corneal nerve density determined by corneal confocal microscopy was significantly decreased in type 2 diabetic mice compared to control mice. There was a trend for corneal nerve density to be decreased in DIO mice and to a lesser extent in type 1 diabetic mice but these differences were not statistically different from control mice (Fig. 3). Fig. 4 provides a representative image of tubulin staining of mouse sub-epithelial corneal nerves for the entire cornea. Analysis of these images demonstrate a significant loss of corneal nerves in DIO mice and type 2 diabetic mice. Analysis of sub-epithelial corneal nerves from type 1 diabetic mice indicated that after 12 weeks of hyperglycemia there was no change in nerve density compared to control mice. There is a significant loss of corneal nerves penetrating the corneal epithelium in DIO mice and type 2 diabetic mice compared to control mice. In type 1 diabetic mice after 12 weeks of hyperglycemia there was no loss of corneal nerves penetrating the corneal epithelium (Fig. 5). After 20 weeks of hyperglycemia in type 1 diabetic mice and 12 weeks of hyperglycemia in type 2 diabetic mice the loss of corneal nerves are similar (Fig. 6) (Yorek, et al., 2014). In type 1 and type 2 diabetic mice there is a significant thinning of the retinal ganglion complex compared to control mice. The thickness of the retinal ganglion complex in DIO mice was not significantly different from control mice (Table 2).
Figure 3. Effect of DIO, type 1 or type 2 diabetes on innervation of sub-epithelial layer of the cornea.

The groups examined and the number of mice in each group was the same as described in Table 1. The photographs show examples of sub-epithelial layer of corneal nerves of a control mouse (top left), type 1 diabetic mouse (top right), mouse fed a high fat diet (bottom left) and type 2 diabetic mouse (bottom right). Data are presented as the mean ± S.E.M. ** p < 0.01 compared to control mice; one-way analysis of variance with Dunnett’s pairwise test for multiple comparisons. Scale bar = 50 μm.
Figure 4. Effect of DIO, type 1 or type 2 diabetes on innervation of sub-epithelial layer of the whole cornea stained with anti-tubulin.

The groups examined and the number of mice in each group was the same as described in Table 1. The images show examples of sub-epithelial layer of corneal nerves of a control mouse (top left), type 1 diabetic mouse (top right), mouse fed a high fat diet (bottom left) and type 2 diabetic mouse (bottom right). Data are presented as the mean ± S.E.M. * p < 0.05 compared to control mice; ** p < 0.01 compared to control mice; one-way analysis of variance with Dunnett’s pairwise test for multiple comparisons. Scale bar = 500 μm.
Figure 5. Effect of DIO, type 1 or type 2 diabetes on innervation of the corneal epithelium.

The groups examined and the number of mice in each group was the same as described in Table 1. The images show examples of corneal nerves penetrating the epithelium of a control mouse (top left), type 1 diabetic mouse (top right), mouse fed a high fat diet (bottom left) and type 2 diabetic mouse (bottom right). Data are presented as the mean ± S.E.M. * p < 0.05 compared to control mice; one-way analysis of variance with Dunnett’s pairwise test for multiple comparisons. Scale bar = 50 μm.
Figure 6. Representative images of sub-epithelial corneal nerves and corneal nerves penetrating the epithelium from control, type 1 diabetic and type 2 diabetic mice.

Corneal nerves of the sub-epithelial layer and penetrating the cornea epithelium from control mice, type 1 diabetic mice (20 weeks duration of hyperglycemia) and type 2 diabetic mice (12 weeks duration of hyperglycemia) were visualized by immunohistochemical staining. Images were collected from the region of the whorl for both the sub-epithelial nerves and nerves penetrating the cornea. Scale bar = 50 μm.
Discussion
Mice were fed a high fat diet for 8 weeks. This ensures mice are in a steady state of insulin resistance due to diet induced obesity prior to injection of low doses of streptozotocin that will destroy some but not all of the β-cells. This protocol induces a state of elevated glucose levels because of the inability of the remaining β-cells to produce a sufficient amount of insulin to overcome the insulin resistance. This mouse model has commonly been referred to as a model for type 2 diabetes. However, most studies have shown that these mice are not hyperinsulinemic but are glucose intolerant (Wang, et al., 2014; Xue, et al., 2010; Lv, et al., 2010; Sakai, et al., 2014; Fu, et al., 2014; Mali, et al., 2014).
The severity of hyperglycemia was significantly different between the type 1 and 2 diabetic mouse models. However, motor and sensory nerve conduction velocity, thermal and mechanical sensitivity and intraepidermal nerve fiber density in the skin were all impacted similarly in DIO and types 1 and 2 diabetic mice. Loss of corneal nerves in the sub-epithelial layer and penetrating the corneal epithelium occurred more rapidly in the DIO mice and type 2 diabetic mice compared to type 1 diabetic mice. This suggests that hyperglycemia is not the only factor contributing to nerve fiber loss in the cornea and that loss of intraepidermal and corneal nerve fibers is mediated by different factors and/or occurs at different rates. Chen, et al. (2013) reported a loss of corneal nerves within 4 weeks of induction of type 1 diabetes, which is much sooner than we reported (Yorek et al., 2014). There are a number of possible reasons for this difference. First, the studies by Chen, et al. (2013) were done using female Swiss Webster mice, whereas our studies were done using male C57Bl/6J mice. Corneal nerve density and loss of corneal nerves due to obesity or diabetes may vary with gender and strains of mice. In unpublished studies we have observed that Balb c mice have about 2 times the density of corneal nerves than C57Bl/6J mice. Chen, et al. (2013) also used a quantification system based on occupancy, whereas we based ours on total length. Different quantification methods could also contribute to the differences in the results between the two studies. However, what is important is that both studies demonstrate that diabetes causes a loss of corneal nerves in mice (Chen, et al., 2013; Yorek, et al., 2014).
It has been previously reported that loss of nerve fibers in the skin and cornea occurs in subjects with impaired glucose tolerance (Divisova, et al., 2012; Smith, et al., 2006; Asghar, et al., 2014). Rodents that develop early markers of peripheral neuropathy may provide a useful pre-clinical model for discovery and evaluating treatments for diabetic neuropathy. However, results from studies using Sprague-Dawley rats and C57Bl/6J mice do not completely agree. In high fat fed rats unlike C57Bl/6J mice there was no decrease in motor nerve conduction velocity (Davidson, et al., 2014). We have shown that changes in motor nerve conduction velocity is sensitive to hyperglycemia and DIO C57Bl/6J mice trend toward having elevated blood glucose unlike DIO Sprague-Dawley rats (Davidson, et al., 2014).
Markers of oxidative stress were elevated in serum and dorsal root ganglion neurons of type 1 and type 2 diabetic mice but not DIO mice. Increased oxidative stress is widely thought to be a contributing factor to the development of peripheral diabetic neuropathy (Yorek, 2003; Obrosova, 2003). In diabetic mice it is likely that oxidative and nitrosative stress contributed to peripheral neuropathy but other factors including circulating levels of insulin and perhaps other neurotrophic support peptides likely have a role. Because of the complex etiology of diabetic neuropathy treatments aimed at preventing/reversing neural complications will likely need to target multiple pathways in order to be successful (Chen, et al., 2013; Kim, et al., 2012; Mahmood, et al., 2009; Calcutt, et al., 2008).
In summary, these studies demonstrate that the high fat fed low dose streptozotocin treated mouse could be a good animal model for preclinical studies for discovery and evaluation of new treatments for diabetic neuropathy especially in relation to changes in nerve structure in the skin, cornea and retina.
Acknowledgments
This material is based upon work supported in part by the Department of Veterans Affairs, Veterans Health Administration, Office of Research and Development, Biomedical Laboratory Research and Development Service (BX001680-01, MAY), Rehabilitation Research and Development Service (RX000889-01, MAY) and Iowa City VA Center of Excellence for the Prevention and Treatment of Visual Loss: C9251-C(RHK)) and by National Institute of Diabetes and Digestive and Kidney Diseases Grant DK081147 (MAY) from NIH.
Footnotes
The content of this manuscript are new and solely the responsibility of the authors and do not necessarily represent the official views of the granting agencies.
References
- Asghar O, Petropoulos I, Alam U, Jones W, Jeziorska M, Marshall A, Ponirakis G, Fadavi H, Boulton A, Tavakoli M, Malik R. Corneal confocal microscopy detects neuropathy in subjects with impaired glucose tolerance. Diabetes Care. 2014 doi: 10.2337/dc14-0279. in press. [DOI] [PMC free article] [PubMed] [Google Scholar]
- Bansal P, Paul P, Mudgal J, Nayak P, Pannakae S, Priyadarsini K, Unnikrishnan M. Antidiabetic, antihyperlipidemic and antioxidant effects of the flavonoid rich fraction of Pilea microphylla (L.) in high fat diet/streptozotocin-induced diabetes in mice. Exp Toxicol Pathol. 2012;64:651–658. doi: 10.1016/j.etp.2010.12.009. [DOI] [PubMed] [Google Scholar]
- Calcutt N, Jolivalt C, Fernyhough P. Growth factors as therapeutics for diabetic neuropathy. Curr Drug Targets. 2008;9:47–59. doi: 10.2174/138945008783431727. [DOI] [PubMed] [Google Scholar]
- Chen D, Frizzi K, Guernsey L, Ladt K, Mizisin A, Calcutt N. Repeated monitoring of corneal nerves by confocal microscopy as an index of peripheral neuropathy in type-1 diabetic rodents and the effects of topical insulin. J Peripher Nerv Syst. 2013;18:306–315. doi: 10.1111/jns5.12044. [DOI] [PMC free article] [PubMed] [Google Scholar]
- Coppey L, Davidson E, Lu B, Gerard C, Yorek M. Vasopeptidase inhibitor ilepatril (AVE7688) prevents obesity- and diabetes-induced neuropathy in C57Bl/6J mice. Neuropharmacology. 2011;60:259–266. doi: 10.1016/j.neuropharm.2010.09.008. [DOI] [PMC free article] [PubMed] [Google Scholar]
- Davidson E, Coppey L, Holmes A, Dake B, Yorek M. Effect of treatment of high fat/low dose streptozotocin-diabetic rats with Ilepatril on vascular and neural complications. Eur J Pharmacol. 2011;668:497–506. doi: 10.1016/j.ejphar.2011.07.016. [DOI] [PMC free article] [PubMed] [Google Scholar]
- Davidson E, Coppey L, Holmes A, Yorek M. Changes in corneal innervation and sensitivity and acetylcholine-mediated vascular relaxation of the posterior ciliary artery in a type 2 diabetic rat. Invest Ophthalmol Vis Sci. 2012;53:1182–1187. doi: 10.1167/iovs.11-8806. [DOI] [PMC free article] [PubMed] [Google Scholar]
- Davidson E, Coppey L, Kardon R, Yorek M. Differences and similarities in development of corneal nerve damage and peripheral neuropathy and in diet-induced obesity and type 2 diabetic rats. Invest Ophthalmol Vis Sci. 2014;55:1222–1230. doi: 10.1167/iovs.13-13794. [DOI] [PMC free article] [PubMed] [Google Scholar]
- Davis J, Cain J, Banz W, Peterson R. Age-related differences in response to high-fat feeding on adipose tissue and metabolic profile in ZDSD rats. ISRN Obes. 2013;2013:584547. doi: 10.1155/2013/584547. [DOI] [PMC free article] [PubMed] [Google Scholar]
- Divisova S, Vickova E, Hnojcikova M, Skorna M, Nemec M, Dubovy P, Dusek L, Larkovsky J, Belobradkova J, Bednarik J. Prediabetes/early diabetes-associated neuropathy predominantly involves sensory small fibers. J Peripher Nerv Syst. 2012;17:341–350. doi: 10.1111/j.1529-8027.2012.00420.x. [DOI] [PubMed] [Google Scholar]
- Fellmann L, Nascimento A, Tibirica E, Bousquet P. Murine models for pharmacological studies of the metabolic syndrome. Pharmacol Ther. 2013;137:331–340. doi: 10.1016/j.pharmthera.2012.11.004. [DOI] [PubMed] [Google Scholar]
- Fu Y, Luo J, Jia Z, Zhen W, Zhou K, Gilbert E, Liu D. Baicalein protects against type 2 diabetes via promoting islet β-cell function in obese diabetic mice. Int J Endocrinol. 2014;2014:846742. doi: 10.1155/2014/846742. [DOI] [PMC free article] [PubMed] [Google Scholar]
- Hoke A. Animal models of peripheral neuropathies. Neurotherapeutics. 2012;9:262–269. doi: 10.1007/s13311-012-0116-y. [DOI] [PMC free article] [PubMed] [Google Scholar]
- Islam M. Animal models of diabetic neuropathy: progress since 1960s. J Diabetes Res. 2013;2013:149452. doi: 10.1155/2013/149452. [DOI] [PMC free article] [PubMed] [Google Scholar]
- Kim H, Kim J, Yoon Y. Emerging therapy for diabetic neuropathy: cell therapy targeting vessels and nerves. Endocr Metab Immune Discord Drug Targets. 2012;12:168–178. doi: 10.2174/187153012800493486. [DOI] [PMC free article] [PubMed] [Google Scholar]
- Lenzen S. The mechanisms of alloxan- and streptozotocin-induced diabetes. Diabetologia. 2008;51:216–226. doi: 10.1007/s00125-007-0886-7. [DOI] [PubMed] [Google Scholar]
- Lin Y, Hu G, Li K, Zhao Y, Wei J, Zhen Y. The protection of Rhein lysinate to liver in diabetic mice induced by high-fat diet and streptozotocin. Arch Pharm Res. 2014 doi: 10.1007/s12272-014-0423-4. [DOI] [PubMed] [Google Scholar]
- Lupachyk S, Watcho P, Shevalye H, Vareniuk I, Obrosov A, Obrosova I, Yorek M. Na+/H+-exchanger-1 inhibition reverses manifestation of peripheral diabetic neuropathy in type 1 diabetic rats. Am J Physiol Endocrinol Metab. 2013;305:E396–E404. doi: 10.1152/ajpendo.00186.2013. [DOI] [PMC free article] [PubMed] [Google Scholar]
- Lv L, Wu S, Wang G, Zhang J, Pang J, Liu Z, Xu W, Wu S, Rao J. Effect of astragaloside IV on hepatic glucose-regulating enzymes in diabetic mice induced by a high-fat diet and streptozotocin. Phytother Res. 2010;24:219–224. doi: 10.1002/ptr.2915. [DOI] [PubMed] [Google Scholar]
- Mahmood D, Singh B, Akhtar M. Diabetic neuropathy: therapies on the horizon. J Pharm Pharmacol. 2009;61:1137–1145. doi: 10.1211/jpp/61.09.0002. [DOI] [PubMed] [Google Scholar]
- Mali V, Ning R, Chen J, Yang X, Xu J, Palaniyandi S. Impairment of aldehyde dehydrogenase-2 by 4-hydroxy-2-nonenal adduct formation and cardiomyocite hypertrophy in mice fed a high-fat diet and injected with low-dose streptozotocin. Exp Biol Med. 2014;239:610–618. doi: 10.1177/1535370213520109. [DOI] [PMC free article] [PubMed] [Google Scholar]
- Obrosova I. Update on the pathogenesis of diabetic neuropathy. Curr Diab Rep. 2003;3:439–445. doi: 10.1007/s11892-003-0005-1. [DOI] [PubMed] [Google Scholar]
- Rees D, Alcolado J. Animal models of diabetes mellitus. Diabet Med. 2005;22:359–370. doi: 10.1111/j.1464-5491.2005.01499.x. [DOI] [PubMed] [Google Scholar]
- Reinwald S, Peterson R, Allen M, Burr D. Skeletal changes associated with the onset of type 2 diabtes in the ZDF and ZDSD rodent models. Am J Physiol Endocrinol Metab. 2009;296:E765–E774. doi: 10.1152/ajpendo.90937.2008. [DOI] [PMC free article] [PubMed] [Google Scholar]
- Sakai T, Kusakabe T, Ebihara K, Aotani D, Yamamoto-Kataoka S, Mingming Z, Gumbilai V, Ebihara C, Aizawa-Abe M, Yamamoto Y, Noguchi M, Fujikura J, Hosoda K, Inagaki N, Nakao K. Leptin restores the insulinotropic effect of exenatide in a mouse model of type 2 diabetes with increased adiposity induced by streptozotocin and high-fat diet. Am J Physiol Endocrinol Metab. 2014 doi: 10.1152/ajpendo.00272.2014. in press. [DOI] [PubMed] [Google Scholar]
- Smith A, Russell J, Feldman E, Goldstein J, Peltier A, Smith S, Hamwi J, Pollari D, Bixby B, Howard J, Singleton J. Lifestyle intervention for pre-diabetic neuropathy. Diabetes Care. 2006;29:1294–1299. doi: 10.2337/dc06-0224. [DOI] [PubMed] [Google Scholar]
- Stables C, Glasser R, Feldman E. Diabetic cardiac autonomic neuropathy: insights from animal models. Auton Neurosci. 2013;177:74–80. doi: 10.1016/j.autneu.2013.03.001. [DOI] [PubMed] [Google Scholar]
- Stavniichuk R, Shevalye H, Lupachyk S, Obrosov A, Groves J, Obrosova I, Yorek M. Peroxynitrite and Protein Nitration in the Pathogenesis of Diabetic Peripheral Neuropathy. Diabetes Metab Res Rev. 2014 doi: 10.1002/dmrr.2549. [DOI] [PMC free article] [PubMed] [Google Scholar]
- Tesch G, Lim A. Recent insights into diabetic renal injury from the db/db mouse model of type 2 diabetic nephropathy. Am J Physiol Renal Physiol. 2011;300:F301–F310. doi: 10.1152/ajprenal.00607.2010. [DOI] [PubMed] [Google Scholar]
- Ullevig S, Zhao Q, Zamora D, Asmis R. Ursolic acid protects diabetic mice against monocyte dysfunction and accelerated atherosclerosis. Atherosclerosis. 2011;219:409–416. doi: 10.1016/j.atherosclerosis.2011.06.013. [DOI] [PMC free article] [PubMed] [Google Scholar]
- Wang Z, Hsu C, Lin H, Chen J. Antidiabetic effects of Carassius autatus complex formula in high fat diet combined streptozotocin-induced diabetic mice. Evid Based Complement Alternat Med. 2014;2014:628473. doi: 10.1155/2014/628473. [DOI] [PMC free article] [PubMed] [Google Scholar]
- Weber D, Kneschke N, Grimm S, Bergheim I, Breusing N, Grune T. Rapid and sensitive determination of protein-nitrotyrosine by ELISA: Application to human plasma. Free Radic Res. 2012;46:276–285. doi: 10.3109/10715762.2011.652627. [DOI] [PubMed] [Google Scholar]
- Xue J, Ding W, Liu Y. Anti-diabetic effects of emodin involved in the activation of PPAR gamma on high-fat diet-fed and low dose streptozotocin-induced diabetic mice. Fitoterapia. 2010;81:173–177. doi: 10.1016/j.fitote.2009.08.020. [DOI] [PubMed] [Google Scholar]
- Yorek M. The role of oxidative stress in diabetic vascular and neural disease. Free Radic Res. 2003;37:471–480. doi: 10.1080/1071576031000083161. [DOI] [PubMed] [Google Scholar]
- Yorek M, Obrosov A, Shevalye H, Lupachyk S, Harper M, Kardon R, Yorek M. Effect of glycemic control on corneal nerves and peripheral neuropathy in streptozotocin-induced diabetic C57Bl/6J mice. J Peripher Nerv Syst. 2014 doi: 10.1111/jns.12086. in press. [DOI] [PMC free article] [PubMed] [Google Scholar]
- Zhu N, Liu B, Luo W, Zhang Y, Li H, Li S, Zhou Y. Vasoconstrictor role of cyclooxygenase-1-mediated prostacyclin synthesis in non-insulin-dependent diabetic mice induced by high-fat diet and streptozotocin. Am J Physiol Heart Circ Physiol. 2014;307:H319–H327. doi: 10.1152/ajpheart.00022.2014. [DOI] [PubMed] [Google Scholar]