

Abstract
Pilomyxoid astrocytomas (PMAs) manifest a more aggressive clinical course than pilocytic astrocytomas (PAs). Development of effective therapies demands a better biological understanding of PMA. We first conducted gene expression microarray analysis of 9 PMA and 13 PA from infra‐ and supratentorial sites. Unsupervised hierarchical clustering analysis demonstrated that tumors are grouped according to anatomic site, not diagnosis. Gene expression profiles were then contrasted between eight PMAs and six PAs, all supratentorial/hypothalamic/chiasmal. Clinical outcome of PMAs varied, with four out of four patients with diencephalic syndrome succumbing to disease, one of whom showed bulky metastatic leptomeningeal spread at autopsy, with bimodal maturation to PA in some areas and de‐differentiation to glioblastoma in others. A surviving child has undergone multiple surgical debulking, with progressive maturation to PA over time. Ontology‐enrichment analysis identified overexpression in PMAs of extracellular matrix and mitosis‐related genes. Genes overexpressed in PMA vs. PA, ranked according to fold‐change, included developmental genes H19, DACT2, extracellular matrix collagens (COL2A1; COL1A1) and IGF2BP3 (IMP3), the latter previously identified as an adverse prognostic factor in PMA and PA.
Keywords: glioblastoma, IMP3, maturation, microarray, pilomyxoid astrocytoma
Introduction
Pilocytic astrocytomas (PAs), World Health Organization (WHO) grade I, are encountered in children and young adults in a variety of anatomical locations, including the cerebellum, hypothalamus, optic chiasm and thalamus. A landmark study in 1999 that described “pediatric astrocytomas with monomorphous pilomyxoid features” 27 allowed recognition that a subset of tumors formerly included in PA series had a more aggressive clinical course. Today, these more aggressive variants, pilomyxoid astrocytomas (PMAs), WHO grade II 24, are recognized to occur in children under the age of 2 years, usually affect the hypothalamic/optic pathway regions, and have shorter progression‐free and overall survival times than PAs in the same anatomical location 15. PMAs also have an increased tendency for cerebrospinal fluid (CSF) dissemination compared to PAs 15. The unfavorable anatomic location of the majority of PMAs, and a subset of PAs, in the hypothalamus and suprasellar areas usually precludes significant surgical debulking of tumor, but this alone is not thought to account for their more aggressive behavior 15. Because of worse overall outcome of PMAs, we previously studied prognostic factors in 70 pediatric pilocytic and 7 pilomyxoid astrocytomas and demonstrated that strong diffuse immunostaining for insulin‐like growth factor 2 mRNA binding protein 3 (IMP3) was associated with a shorter progression‐free survival 2.
However, our initial study was not restricted by anatomical location and it recently has become apparent that in many tumors, including PAs, there are site‐specific genetic differences 17. Lambert et al interrogated gene expression in PAs from cerebellar vs. non‐infratentorial sites and showed that there were differentially methylated genes expressed in different anatomic locations 17. They concluded that “PA from different locations in the brain may arise from region‐specific cells of origin.” Because our original study had not been anatomically site‐restricted, we have now expanded our original studies on PMA 2, 13, 14 and re‐interrogated our database, restricting our study to comparisons between pure PMAs and pure PAs from hypothalamic/chiasmal sites.
In this study, we show that IMP3 is still an important signature gene with high expression level in PMAs, but discover several other genes that were not apparent when site restriction was not utilized. The strengths of the study are the inclusion of one patient in whom initial resection showed pure PMA and subsequent resection materials demonstrated progressive maturation to PA, with three total specimens on the same patient available for microarray analysis; this rare patient specifically showed transition of microarray pattern over time toward PA signature. We also present autopsy documentation of the second reported case of de‐differentiation of a PMA to glioblastoma (GBM) 20; the initial pure PMA sample on microarray clustered tightly with the remainder of the cohort despite dismal and differing outcome. We show that, in all cases, pure PMAs showed significant gene expression differences from pure PAs in the same anatomical locations.
Materials and Methods
Patient cohort
Retrospective review of the Neuro‐oncology database at Children's Hospital Colorado was conducted to select patients who were diagnosed at our institution with hypothalamic/chiasmal PAs or PMAs for whom frozen material of suitable quality for microarray analysis was available. Eligible patients had been initially seen, received neurosurgical resection of tumor or been seen in clinical follow‐up between 1999 and 2014, with closure date of study of 6/1/2014. All studies were conducted in compliance with local and federal research protection guidelines and institutional review board regulations (COMIRB #95‐500 and #08‐0944). Patients with neurofibromatosis type I, were excluded from this analysis since subtle biological differences have been documented between NF‐1 associated and non‐NF‐1 PAs 10. This search yielded 13 patients with PA [6 infratentorial (IF) and 7 supratentorial (ST) (hypothalamic/optic pathway/thalamic)] and 9 patients with PMAs (1 IF and 8 ST), all of which were diagnosed and graded according to WHO tumor classification guidelines 23. Diagnosis had been made initially by a neuropathologist and was re‐reviewed proximate to this study (BKD) to ensure correct diagnosis. Specifically, microscopic slides from all PAs were re‐reviewed to insure that these samples were “pure” PAs or PMAs rather than “intermediate pilomyxoid tumors,” as described in the literature 12.
In one PMA patient (case 1), multiple recurrences had resulted in collection of tissue samples at initial and then two subsequent surgical excisions (three total specimens from same patient). In the other PMA patient (case 2) for whom two tissue samples had been collected (at initial surgical excision and at autopsy), the autopsy specimen had poor fidelity of RNA and could not be assessed. Based on our gene expression microarray analysis findings of potentially confounding anatomic site‐specific variation in our sample cohort, supratentorial site‐restricted samples were chosen for further analysis. This resulted in a final supratentorial site‐restricted set of 10 PMA and 6 PA samples.
Clinical outcome was obtained from the Neuro‐oncology database, supplemented by the medical records. Clinical progression was determined by the neuro‐oncologist on the study, who was also responsible for patient follow‐up and care (NKF), and included evaluation of neuroimaging features. Dates of demise were obtained from the Children's Hospital Colorado Neuro‐oncology database.
Routine histology and immunohistochemistry (IHC)
Tissues were fixed in 10% buffered formalin and cut at 5 μm. Staining/immunostaining was performed on formalin‐fixed, paraffin‐embedded (FFPE) tumor tissue sections. Stains/immunostains that had originally been utilized for diagnostic purposes at the time of original assessment varied from case to case, but in most patients included Masson trichrome, periodic acid Schiff, glial fibrillary acidic protein (GFAP; Dako Corporation, Carpinteria, CA, USA, polyclonal, 1:2500, no antigen retrieval) and MIB‐1 (Dako Corporation, monoclonal, 1:400 dilution, antigen retrieval). Selected examples were further stained for Alcian blue.
Seven of eight PMAs (exception: case 7) were able to be retrospectively immunostained for BRAF VE1 (Ventana, Tucson, AZ, USA, monoclonal, antigen retrieval); these cases were also assessed by Sanger sequencing for BRAF V600E mutation (see below). All immunostained sections were counterstained with hematoxylin. MIB‐1 counts were performed manually on 1000 cells using a scored grid.
IMP3 (IGF2BP3) immunostaining and scoring was performed as described previously (Barton 2013) using Dako monoclonal anti‐IMP3 (code M3626) at 1:100 dilution. Scores from the previous study were combined with those from the present study to give a final cohort of 8 PMA and 35 PA, all restricted to supratentorial locations.
The autopsy specimen on case 2 was more extensively evaluated by vimentin, S100 (both Ventana, monoclonal, pre‐dilute, antigen retrieval), synaptophysin (Ventana, polyclonal, pre‐dilute, antigen retrieval), EGFR (Ventana, monoclonal, 1:400, antigen retrieval), p53 (Dako, monoclonal, 1:200, antigen retrieval) and p16 (Ventana, monoclonal, predilute, antigen retrieval) IHC, as well as BRAF VE1 on multiple sections.
DNA sequencing for BRAF exon 15 mutation
DNA was extracted from the FFPE material using the DNeasy FFPE extraction kit (Qiagen Inc., Valencia, CA, USA) according to the manufacturer's instructions. In all PMAs, the initial resection specimen was assessed. DNA yields were then quantified using a Nanodrop spectrophotometer ND‐1000 (Thermo Fisher Scientific Inc., Waltham, MA, USA).
For direct sequencing, approximately 10 ng of template DNA was polymerase chain reaction (PCR)‐amplified by a hemi‐nested procedure using 10 pmol each of forward (5′TGCTTGCTCTGATAGGAAAAT3′) and reverse (5′AGCATCTCAGGGCCAAAAAT3′ external and 5′TCAGGGCCAAAAATTTAATCA3′ internal) BRAF exon 15 primers and Taq polymerase PCR master mix (Promega Cat. No. M750) in a 25 μL reaction. PCR was performed on an ABI 9700 thermocycler with 20 cycles of touchdown PCR (starting annealing temperature of 65°C, decremented 0.5°C per cycle) and 15 cycles for both first and second amplification rounds at 94°C denaturation, 55°C annealing and 72°C extension. The resultant PCR products were purified with the QIAquick 96 well PCR cleanup kit (Qiagen Inc.). The purified PCR products were sequenced in forward and reverse directions using an ABI 3730 automated sequencer. Each chromatogram was visually inspected for any abnormalities, using NM_004333.4 as a reference sequence, with particular attention directed to BRAF codon 600. Sequences were also evaluated using Mutation Surveyor software (Soft Genetics, State College, PA, USA), using reference sequence NM_004333.4 for comparison. Mutations were determined to be present when peaks reached a threshold value above baseline calculated from background level, combined with visual inspection of the chromatogram.
BRAF : KIAA fusion testing by fluorescence in situ hybridization (FISH)
Testing was performed in the laboratory of Dr. Leila Garcia, University of Colorado on FFPE sections. Most cases had sufficient tissue remaining in the block from the original specimen resection for performance of the testing, with the exception of cases 1 and 9 where either the original blocks no longer existed in the file or had been exhausted with other testing. Cases that had originally been fixed in zinc formalin and proved to be specimen failures because of inability to hybridize samples were noted. Additional attempts to perform BRAF:KIAA fusion on failed zinc formalin‐fixed specimens at Stanford University, Palo Alto, CA, under the direction of Dr. Hannes Vogel were also unsuccessful.
Gene expression microarray analysis
Whole transcriptome analyses utilized Affymetrix U133plus2 GeneChips. Samples were collected at the time of surgery and snap‐frozen in liquid nitrogen. RNA was extracted from each sample using an RNeasy kit (Qiagen Inc.) according to the manufacturer's instructions, and RNA quality was measured using a 2100 BioAnalyser (Agilent, Santa Clara, CA, USA). RNA was processed as previously described 1 and hybridized to HG‐U133 Plus 2.0 GeneChips (Affymetrix, Santa Clara, CA, USA) according to the manufacturer's instructions. Microarray data from the samples were background‐corrected and normalized using the gcRMA algorithm. To reduce error associated with multiple testing and to avoid bias in enrichment statistics from genes containing multiple probe sets, a filtered list containing a single probe set for each gene that possessed the highest gcRMA expression level across all samples used was created. Unsupervised clustering of the top 5% most variably expressed genes was performed using R (http://cran.r‐project.org), using publicly available software packages from Bioconductor (http://www.bioconductor.org). Genes that were significantly (P < 0.05) overexpressed greater than twofold in PMA vs. PA were selected. A corresponding list of genes overexpressed in PA vs. PMA was also selected. Overexpressed genes were ranked by fold‐change to identify the most differentially expressed genes between groups. These differential gene expression analyses, and creation of heat maps, were performed using Microsoft Excel.
Gene ontology enrichment analysis
The computer‐based gene ontology tool DAVID (Database for Annotation, Visualization, and Integrated Discovery, http://david.abcc.ncifcrf.gov) was used to assess PMA and PA overexpressed gene lists for enrichment of genes annotated with specific Gene Ontology Project biological process, cellular component and molecular function terms (GOTERM, www.geneontology.org). Enrichment is defined as more genes than would be expected by chance that are associated with a specific phenotype or variable. Enrichment scores and significance as measured by Student's t‐test and Bonferroni false discovery rate were used by DAVID to evaluate ontologic enrichment.
Statistical analysis
For all tests, a level of P < 0.05 was considered statistically significant.
Results
Patient demographics and clinical outcome
The male : female ratio of the cohort as a whole was 5 males : 9 females, with 4 of 8 PMAs occurring in females. Median age at diagnosis of PMA patients was 8 months (age range: from 2.5 months to 3 years). The median age of PA diagnosis was 7 years (age range: from 5 to 13 years). Details of patient gender, age, dates patients underwent surgical excision and clinical outcome are provided in Table 1. Briefly, four of eight PMA patients have succumbed, all of whom had diencephalic syndrome clinically; one of these four cases additionally underwent brain‐only autopsy (case 2). One PMA patient who survived has had multiple recurrences with progressive maturation over time (case 1) to PA, one PMA recurred as a pure PMA and subsequently succumbed (case 3), and one progressed from pure PMA to intermediate PMA (mixed PA/PMA, with the PA component predominating) but succumbed (case 5). Case 5 additionally developed an episode of acute clinical deterioration and collapse 1 month after her second surgery, requiring airlift to our facility where an acute intratumoral hemorrhage was identified and evacuated. None of the PAs have succumbed, but one recurred at a 7‐year interval; both original and recurrent tumors were pure PAs (see Table 1).
Table 1.
Patient demographics, dates of surgical excisions(s), clinical outcome, BRAF V600E mutational status by Sanger sequencing, BRAF : KIAA fusion status by fluorescence in situ hybridization (FISH).Abbreviation: PFS = progression‐free survival
| Pilomyxoid astrocytomas† | ||||
|---|---|---|---|---|
| Patient age, gender, anatomical location | Date of diagnosis, subsequent surgeries/death | Clinical details | BRAF:KIAA and BRAF V600E mutational status | |
| 1 | 8 months, female, optic pathway tumor, eventually involved left thalamus, posterior fossa |
1999, pure PMA 2001, intermediate PMA ⋙ PA 2001, intermediate PMA ⋙ PA 2003, intermediate PMA ≫ PA 2006, pure PA Patient survives |
No diencephalic syndrome Maturation over subsequent surgeries Metastatic (multiple metastases, all of which currently quiescent |
Specimen failure for BRAF V600E assessment BRAF:KIAA could not be assessed because of scant tissue |
| 2 | 2.5 months, female, hypothalamus |
2012, pure PMA Death: age 13 months 2013, autopsy: bimodal glioblastoma and PA areas |
Diencephalic syndrome Metastatic Patient succumbed Mixed maturation and de‐differentiation at autopsy |
BRAF V600E mutation absent BRAF:KIAA fusion present |
| 3 |
8 month female Hypothalamus |
1999, pure PMA 2001, pure PMA Lost to follow‐up in 2004 Died, date unknown* |
Diencephalic syndrome Severe metastatic disease early on, then more slowly progressive metastatic disease as of 2004 No maturation |
BRAF V600E mutation absent BRAF:KIAA specimen failure |
| 4 | 6 months, male, hypothalamus |
2004, pure PMA Death: age 12 months No autopsy |
Diencephalic syndrome Metastatic |
BRAF V600E mutation absent BRAF:KIAA fusion present |
| 5 | 2 years, 4 months, female, hypothalamus |
2006, pure PMA 2007, intermediate PA ⋙ PMA‡ Death: age 3 years No autopsy |
Diencephalic syndrome Maturation in subsequent surgery |
BRAF V600E mutation absent BRAF:KIAA specimen failure |
| 6 | 5 months, female, optic chiasm |
2007, pure PMA Patient survives |
No diencephalic syndrome Excellent response to chemotherapy Tumor has remained in optic chiasm only |
BRAF V600E mutation absent BRAF:KIAA specimen failure |
| 7 | 3 years, male, hypothalamus |
2012, pure PMA Patient survives |
No diencephalic syndrome Treated with radiation therapy Radiation necrosis developed, was successfully treated with bevacizumab No progression |
BRAF V600E could not be assessed BRAF:KIAA fusion present |
| 8 | 7 months, female, hypothalamus |
2009, pure PMA Patient survives |
No diencephalic syndrome Recurred, did badly and eventually responded to drastic surgery and radiation Tumor has remained in optic chiasm only |
Specimen failure for BRAF V600E assessment BRAF:KIAA specimen failure |
| Control pilocytic astrocytomas † | ||||
| Patient | Date of diagnosis | Location | ||
| 9 | 8 years, female, right thalamus |
2001, pure PA Patient survives |
Recurred 06/01/2009 PFS 90 months Now stable |
BRAF: KIAA not assessable |
| 10 | 8 years, male, hypothalamus |
2011, pure PA Patient survives |
Progressed on chemotherapy 01/10/2012. PFS 4 months Now stable |
BRAF: KIAA fusion present |
| 11 | 6 years, male, hypothalamus |
2012, pure PA Patient survives |
Not progressive | BRAF: KIAA fusion present |
| 12 | 13 years, female, optic nerve |
2012, pure PA Patient survives |
Recurred 05/14 PFS 27 months |
BRAF: KIAA fusion absent |
| 13 | 5 years, female, hypothalamic |
1994 2011, pure PA Patient survives |
Diagnosed in 1994 PFS 144 months until relapse in 2011 Now stable |
BRAF: KIAA fusion present |
| 14 | 5 years, male, optic pathway |
2008, pure PA Patient survives |
Recurred 06/11 PFS 33 months Responded to radiation therapy Now stable |
BRAF:KIAA specimen failure |
*Patient left the United States, and lost to follow‐up but verbal report from physician in that country verified demise, date and year unknown.
†All pilomyxoid astrocytomas (PMAs) and pilocytic astrocytomas (PAs) pure at initial resection, with pathology re‐reviewed for potential intermediate features proximate to study.
‡Patient developed acute deterioration 1 month after second surgery and was found to have intratumoral acute bleed that required emergent evacuation.
Histological features
All PMAs showed monomorphic features, myxoid background and an absence of classic PA features such as biphasic compact and loose areas, Rosenthal fibers or eosinophilic granular bodies (EGBs). Seven of eight PMAs showed classic angiocentric arrangement of tumor cells, at least focally, the most recognizable and “positive” histological finding in PMA (see Supporting Information Figure S1), while the eighth (case 6) showed monomorphic features, absence of Rosenthal fibers, EGBs and abundant mucin (see Supporting Information Figure S1). This case, plus cases 3 and 8, had especially prominent amounts of mucin (see Supporting Information Figure S1). All eight PMA cases were composed of piloid astrocytes with delicate and short/stunted rather than coarse/long piloid fibrillary processes, a diagnostic feature we consider characteristic of PMAs as compared to PAs. The delicate, wispy, thin, “cobweb” 12 nature of the cell processes in PMAs could be seen either on hematoxylin and eosin (H&E) or GFAP immunostaining (see Supporting Information Figure S1). As noted by others 9, 12, MIB‐1 labeling index showed a range in our PMA cohort, but was generally low. Specifically, MIB‐1 labeling indices for the initial resection specimen were as follows: case 1: 4.7%; case 2: 3.8%; case 4: 3.3%; case 5: 6.9%; case 6: 11%; case 7: 5.2%; case 8: 4%. Case 3 had MIB‐1 assessed on the second/recurrent pure PMA specimen, which was 2.8%. Mean MIB‐1 labeling was 5.2% (mean = 4.4%), slightly higher than the mean (3.4%) and median (3.0%) found by Johnson et al 12.
As noted above, case 1 had undergone multiple surgical resections of her tumor and showed changing magnetic resonance features over time from a more homogeneous appearing tumor to a more cystic, classic PA phenotype (Figure 1A–F), as we originally detailed 14. The neuroimaging “maturation” was matched by the progressive histological maturation from PMA to intermediate PMA to PA by the last surgery (Figure 2B–F). In direct contrast, although the original morphology of case 1 (see Supporting Information Figure S1) and case 2 was pure PMA (Figure 3A), in case 2, the child died fairly quickly (see Table 1), and at autopsy, bulky leptomeningeal metastatic disease was found at the base of the brainstem in the interpeduncular cistern (Figure 3B,C), extensively involved brainstem cranial nerves (Figure 3D) and extended within leptomeninges to upper cervical spinal cord (brain‐only autopsy) (Figure 3E). Both relatively hypocellular PA and hypercellular high‐grade glioma could be seen at low power (Figure 3C) and the bimodal population showed significantly different histological features (Figure 4A–I). Specifically, the maturing areas of tumor were completely devoid of PMA features and instead manifested biphasic compact and loose areas (Figure 4A,B), with Rosenthal fibers and coarsening of glial cell processes around blood vessels on H&E (Figure 4B) and GFAP (Figure 4C) and negligible cell cycling labeling (Figure 4D). This contrasted with the high cell density tumor areas with multifocal pseudopalisading necrosis (Figure 4E). Tumor in the high cell density areas was GBM and was composed of small, cytologically atypical cells with hyperchromatic oval to angular nuclei and scant amounts of eosinophilic cytoplasm (Figure 4F). Many cells in the poorly differentiated tumor manifested near absence of cytoplasm (Figure 4G). The GBM showed a paucity of GFAP immunostaining (Figure 4H, top) and very high, with MIB‐1 labeling focally reaching 40% (Figure 4H, bottom). Additionally, there was strong diffuse immunoreactivity for vimentin and S100, with weak, irregularly dispersed synaptophysin immunostaining, albeit with an absence of nuclear features suggestive of neuronal differentiation. No EGFR expression was present. There was no loss of p16 immunoreactivity in GBM areas (Figure 4I) (or PA areas) and nuclear p53 labeling was negligible.
Figure 1.
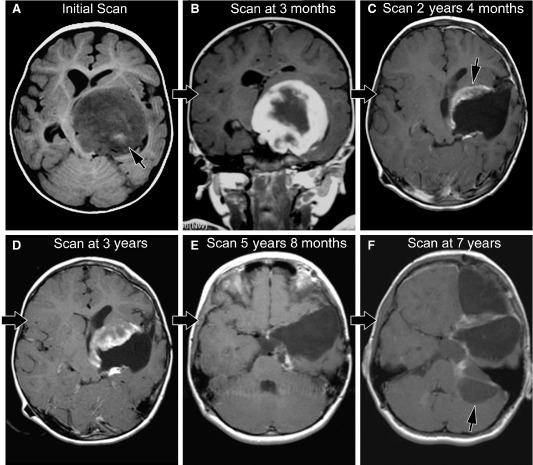
A. Initial scan from case 1 (axial T1‐weighted scan with gadolinium) shows a left thalamic, low T1‐signal mass impinging on the third ventricle; high T1‐signal (arrow) indicates hemorrhage within the mass prior to contrast material. B. The next magnetic resonance imaging (MRI) scan (coronal T1‐weighted with gadolinium) from case 1 demonstrates the extensive solid enhancing component. C. MRI at 2 years, 4 months after diagnosis in case 1 now shows mixed solid/cystic features; biopsy site (arrow) included both solid/cystic components and showed mixed pilocytic astrocytoma/pilomyxoid astrocytoma (PA/PMA) (“intermediate PMA”) features. D. MRI scan at 3 years after diagnosis in case 1 shows mixed solid/cystic features. E. MRI scan at 5 years, 8 months after diagnosis in case 1 shows cystic progression. F. MRI scan at 7 years after diagnosis in case 1 shows extension of the supratentorial tumor around the tentorium, forming a cystic portion in the posterior fossa that was in continuity with the original tumor. Biopsy material was taken from the pure cystic portion (arrow) in the posterior fossa and showed only pure PA features.
Figure 2.
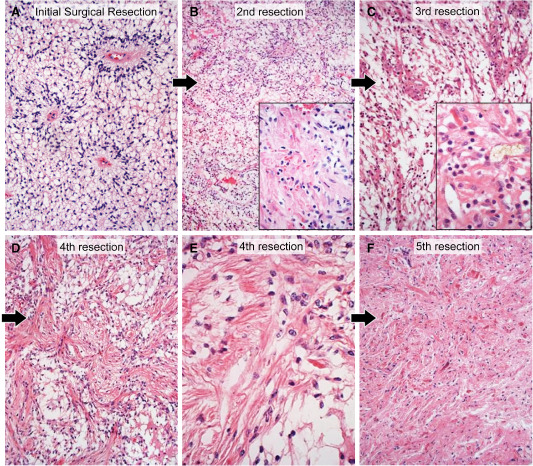
A. The initial resection specimen from case 1, taken from the solid tumor demonstrated classic pure pilomyxoid astrocytoma (PMA) features with abundant myxoid background, prominent angiocentricity of tumor cells, and cells with delicate, thin, wispy cell processes; note the absence of biphasic pattern, Rosenthal fibers or eosinophilic granular bodies in the tumor. Hematoxylin and eosin (H&E), 200×. B. The second resection specimen from case 1, occurring 1 1/2 years after the first surgery, in a biopsy taken from the mixed solid/cystic tumor (see Figure 1), showed mostly PMA, with only very focal coarsening of tumor cells and Rosenthal fiber formation (inset). H&E 100×, 200×. C. The third resection specimen from case 1, occurring 2 years after the first surgery, again showed mostly PMA with focal PA features including Rosenthal fibers (inset). H&E, 200×, 400×. D. The fourth resection specimen from case 1, occurring 4 years, 4 months after the first surgery, in the now mostly cystic tumor (see Figure 1E) was now predominantly composed of PA with emergence of more abundant biphasic tumor. H&E, 200×. E. Higher power view of the fourth resection specimen highlights the coarsening of cell processes and the Rosenthal fibers. H&E, 400×. F. By the fifth resection specimen 7 years after diagnosis, the tumor was completely cystic (see Figure 1F) and a pure PA. H&E 200×.
Figure 3.
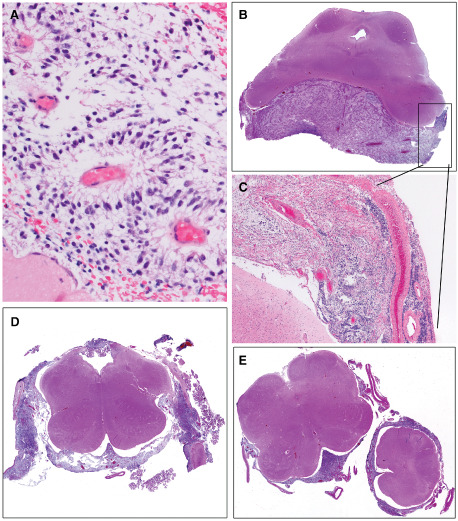
A. The initial biopsy specimen on case 2 was virtually identical to that from case 1 (see Figure 2A), with numerous vessels showing angiocentric arrangement of tumor cells possessing thin, wispy, delicate cell processes. H&E, 400×. B. Case 2 succumbed rapidly and at autopsy limited to the brain, bulky metastatic leptomeningeal tumor was identified in the interpeduncular cistern. H&E, whole mount. C. Leptomeningeal tumor from case 2 demonstrated a bimodal appearance, with hypocellular areas (upper left) which proved to be pilocytic astrocytoma (PA) (see Figure 4) juxtaposed to zones of dedifferentiation to GBM (lower right). H&E, 40×. D. Leptomeningeal tumor from case 2 particularly involved cranial nerves of the medulla. H&E, whole mount. E. Leptomeningeal spread was seen as far caudally as the medulla‐cervical cord junction (brain‐only autopsy precluded spinal cord removal). H&E, whole mount.
Figure 4.
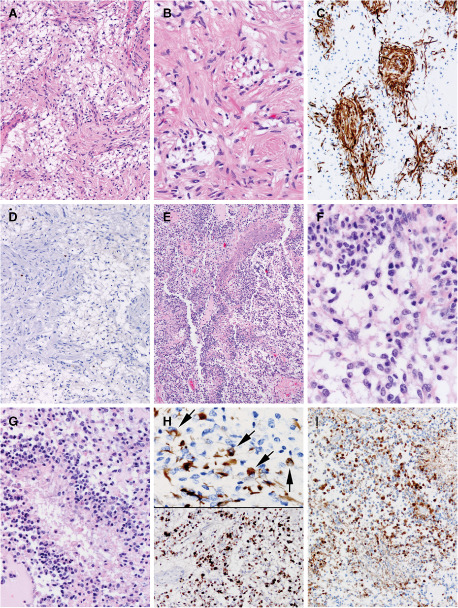
A. In case 2, leptomeningeal metastatic tumor showed a bimodal appearance and hypocellular areas manifested the classic biphasic compact and loose areas of pilocytic astrocytoma (PA); tumor at autopsy was devoid of pilomyxoid astrocytoma (PMA) features. H&E, 200×. B. In case 2, higher power magnification of the PA regions of the leptomeningeal metastatic tumor showed coarsening of piloid glial cell processes around blood vessels (compare with initial PMA appearance of tumor from same patient; Figure 3A). H&E, 400×. C. In case 2, glial fibrillary acidic protein (GFAP) better highlights the coarsening of the piloid glial tumor cells in the PA areas. Immunohistochemistry for GFAP with light hematoxylin counterstain, 200×. D. In case 2, PA areas of the leptomeningeal tumor showed negligible cell cycle labeling immunostaining for MIB‐1, with light hematoxylin counterstain, 200×. E. In case 2, the bimodal leptomeningeal metastatic tumor also contained high cell density tumor areas with multifocal pseudopalisading necrosis characteristic of glioblastoma (GBM). H&E, 100×. F. The GBM regions of the tumor in case 2 manifested oval to angular cell with scant amounts of eosinophilic cytoplasm. H&E 600×. G. GBM tumor cells were very poorly differentiated and, in some regions, were virtually devoid of cytoplasm. H&E, 400×. H. GBM areas showed only focal GFAP immunostaining (top panel) and very high MIB‐1 cell cycle labeling rates, focally reaching 40% (bottom panel). Immunohistochemistry for GFAP, MIB‐1, 600×, 200×. I. GBM areas showed no loss of p16 immunostaining, unlike the case with some reported anaplastic pilocytic astrocytomas. P16 immunohistochemistry with light hematoxylin counterstain, 200×.
BRAF VE1 IHC, BRAF V600E, BRAF : KIAA results for pilomyxoid and pilocytic astrocytomas
Seven of seven immunostained PMAs were negative for BRAF VE1 (case 7 not assessed), and Sanger sequencing was further negative in five of these seven (cases 1 and 8 were specimen failures) (see Table 1). In addition, multiple autopsy sections from case 2 that had been immunostained for BRAF VE1 were negative in both PA and GBM bimodal areas of tumor. BRAF VE1 IHC was not assessed in PA, most of which showed fusion (see below).
BRAF V600E mutation was not identified in any of the PMAs, most of which could be assessed (see Table 1).
In terms of BRAF:KIAA fusion, three of five assessable PAs (cases 10, 11 and 13) and three of three assessable PMAs [case 2 (the metastatic case with transformation to GBM), cases 4 and 7] possessed the fusion; unfortunately, most of the PMA cohort derived from years when zinc formalin had been utilized at our Children's Hospital and thus were specimen failures (cases 3, 5, 6 and 8).
Gene expression microarray characterization of pediatric pilomyxoid astrocytoma and pilocytic astrocytoma
Unsupervised hierarchical clustering was performed on all PMA (n = 11) and PA (n = 13) including three PMA samples, which were initial presentation and recurrences from a single patient and one recurrent PA. This analysis identified two distinct subgroups that matched IF and ST anatomic sites (Figure 5A). PMA and PA did not form separate clustering groups. Based on this result and other reports, there are substantial site‐specific genetic differences between low‐grade gliomas 17. Lambert et al interrogated gene expression in PAs from cerebellar vs. non‐infratentorial sites and showed that there were differentially methylated genes expressed in different anatomic locations 17. They concluded that “PA from different locations in the brain may arise from region‐specific cells of origin.” Because of these potentially confounding anatomically site‐restricted biological differences, we have now expanded our original studies on PMA 2, 13, 14 and re‐interrogated our database, restricting our study to comparisons between pure PMAs and pure PAs from supratentorial, and more specifically hypothalamic/chiasmal, sites.
Figure 5.
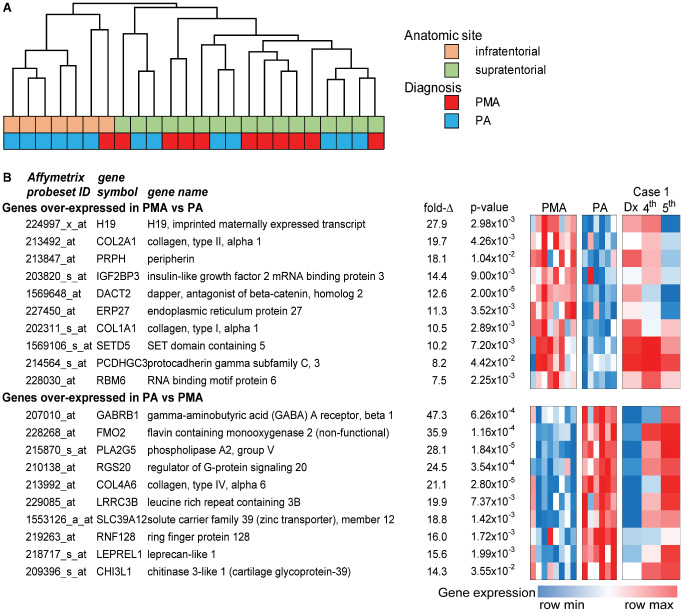
A. Unsupervised hierarchical clustering of pilomyxoid astrocytoma (PMA) and pilocytic astrocytoma (PA) gene expression profiles from infra‐ and supratentorial sites. B. Highest overexpressed genes in PMA compared to PA, expressed as a heat map, with change in gene expression in case 1 on multiple successive samples, from PMA to PA gene expression pattern (at right).
We identified differentially expressed genes (fold‐change > 2; P < 0.05) between PMA (n = 8) and PA (n = 6) restricted to these supratentorial sites. Ontologic analysis identified extracellular matrix and mitosis as predominant roles of genes overexpressed in PMA (Table 2). Extracellular matrix‐associated genes included collagens COL1A1, COL1A2, COL2A1, COL3A1, COL4A1 and COL4A2 and metalloproteases MMP2, MMP15 and MMP17. Notable mitosis‐related genes overexpressed in PMA included CDK1, CCNA2, ASPM and BUB1B and a number of kinesins (KIF14, KIF4A, KIF11). An enrichment of mitosis‐related genes is consistent with reports of elevated MIB‐1 staining and aggressive biology of PMA vs. PA 19. Ontology enrichments in genes overexpressed in PA were comparatively weak compared to PMA, the strongest of these being collagen‐ and plasma membrane‐related, notably COL4A3, COL4A4, COL4A5, COL4A6 and COL8A1. It is intriguing that the strongest ontological enrichments in both PMA and PA are composed of distinct collagens, suggesting a significant role in the pathogenesis of these tumors.
Table 2.
Ontology of genes overexpressed in PMA and PA.Abbreviation: FC = fold‐change; false discovery rate = Bonferroni; PA = pilocytic astrocytoma; PMA = pilomyxoid astrocytoma
| GOTerm ID | Ontology | Fold enrichment | False discovery rate | P value |
|---|---|---|---|---|
| PMA‐associated ontologies [genes overexpressed in PMA vs. PA FC > 2; P < 0.05 (n = 192)] | ||||
| GO:0031012 | Extracellular matrix | 4.76 | 1.99 × 10⁻⁵ | 8.50 × 10⁻⁸ |
| GO:0005819 | Spindle | 7.64 | 2.83 × 10⁻⁵ | 1.21 × 10⁻⁷ |
| GO:0005578 | Proteinaceous extracellular matrix | 4.86 | 3.61 × 10⁻⁵ | 1.54 × 10⁻⁷ |
| GO:0005201 | Extracellular matrix structural constituent | 10.71 | 1.12 × 10⁻⁴ | 3.46 × 10⁻⁷ |
| GO:0000279 | M phase | 4.48 | 0.00318 | 2.67 × 10⁻⁶ |
| GO:0048407 | Platelet‐derived growth factor binding | 41.85 | 0.00131 | 4.03 × 10⁻⁶ |
| GO:0007067 | Mitosis | 5.44 | 0.00547 | 4.60 × 10⁻⁶ |
| GO:0000280 | Nuclear division | 5.44 | 0.00547 | 4.60 × 10⁻⁶ |
| GO:0000087 | M phase of mitotic cell cycle | 5.34 | 0.00658 | 5.53 × 10⁻⁶ |
| GO:0048285 | organelle fission | 5.22 | 0.00823 | 6.94 × 10⁻⁶ |
| PA‐associated ontologies [genes overexpressed in PA vs. PMA FC > 2; P < 0.05 (n = 683)] | ||||
| GO:0031012 | Sheet‐forming collagen | 22.11 | 0.011 | 3.45 × 10⁻⁵ |
| GO:0005819 | Integral to membrane | 1.23 | 0.023 | 6.89 × 10⁻⁵ |
| GO:0005578 | Intrinsic to membrane | 1.21 | 0.036 | 1.10 × 10⁻⁴ |
| GO:0005201 | Plasma membrane part | 1.42 | 0.047 | 1.44 × 10⁻⁴ |
| GO:0000279 | Integral to plasma membrane | 1.59 | 0.093 | 2.91 × 10⁻⁴ |
| GO:0048407 | Intrinsic to plasma membrane | 1.58 | 0.097 | 3.04 × 10⁻⁴ |
| GO:0007067 | Cell adhesion | 1.81 | 0.612 | 4.60 × 10⁻⁴ |
| GO:0000280 | Biological adhesion | 1.81 | 0.613 | 4.61 × 10⁻⁴ |
| GO:0000087 | Collagen type IV | 20.63 | 0.187 | 6.18 × 10⁻⁴ |
| GO:0048285 | Cell–cell signaling | 1.84 | 0.828 | 8.55 × 10⁻⁴ |
The 10 highest overexpressed genes in PMA vs. PA ranked by fold‐change included developmental genes H19 (imprinted maternally expressed transcript/non‐protein coding), IGH2BP3/IMP3 (insulin‐like growth factor 2 mRNA binding protein 3) and DACT2 [dapper, antagonist of beta‐catenin, monolog 2 (Xenopus laevis)]. H19 expression is highly restricted to fetal tissue and may be related to the younger age of these infants and the immature phenotype of the tumor 19 and has also been ascribed a tumorigenic role in many cancers 6. In addition to its developmental role, IMP3 (IGF2BP3) has previously been identified as an adverse prognostic marker in PA and PMA by our group 2. Peripherin (PRPH) and protocadherin gamma subfamily C,3 (PCDHGC3) are expressed by neuronal cells 16, a cell type that has been identified in PMA, although given the tendency for PMAs to be infiltrative more than PAs 8, 14, 22, the possibility of entrapped non‐neoplastic neurons and neuronal cell processes cannot be entirely excluded. Each of these genes was downregulated in the fifth recurrence of case 1 compared to initial pure PMA presentation.
The gene expression signatures of PMA and PA were exhibited as a heat map to illustrate gene expression differences between the tumor types (Figure 5). This figure demonstrates that the progressive shift from a PMA to a PA signature occurred over time in case 1 where multiple samples (initial surgical pure PMA specimen plus two of the recurrences with progressive maturation toward PA) were available on the same patient. Transformation to the PA phenotype was particularly apparent in the fifth tumor presentation.
IMP3 expression is significantly higher in PMA than PA
Immunohistochemical analysis of IMP3 (IGF2BP3) expression was performed to further explore the results of gene expression analysis. Again, samples used for this study were restricted to supratentorial locations. IMP3 scores in PMA were shown to be almost twice that seen in PA (Figure 6). These data, along with our previous finding that IMP3 was independently prognostic in pediatric PA and PMA, strongly support a role for IMP3 in the relatively aggressive biology of PMA.
Figure 6.
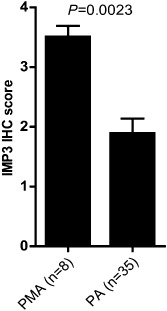
Significantly higher IMP3 expression in pilomyxoid astrocytoma (PMA) compared to PA as demonstrated by immunohistochemistry (IHC) analysis.
Discussion
A fascinating aspect that links PMA with PA is the observation of maturation from PMA to intermediate PMA, or even PA, on subsequent surgeries in occasional reported cases 3, 4, 5, 8, 11 and the existence of intermediate forms 12. In the original description of PMA, no maturation occurred in two of two recurrent tumors 27, but in the study by Johnson et al of intermediate PMAs, there were nine examples of recurrences and tendency to maturation was quite variable 12. Specifically, two PMAs showed no maturation and manifested the same PMA histology at recurrences 6 months and 6 years after original surgery, whereas three PMAs became intermediate PMAs at recurrences 9 months, 3 years and 7 years following original surgery 12. Full maturation of one PMA into PA developed on recurrence interval of 3 years, compared to three intermediate PMAs that did not change at 4 months, 4 months, and 3 years following initial resection 12. In the study by Jeon et al that included six pure PMAs and five intermediate (mixed) forms, one patient with pure PMA initially on recurrence 3 years later showed intermediate phenotype 11. Fernandez et al reported that 10 of their 20 PMAs had two or more surgical excisions of tumor, and of these, 1 showed maturation to PA and 4 more developed acquisition of features typical of classic PAs such as Rosenthal fibers or a biphasic pattern (although this study antedated descriptions of intermediate PMA) 8. Bhargava et al reported one patient with PMA that changed to PA and one PMA that developed mixed PA/PMA features on recurrence 3. Chika et al noted two patients with PMA that recurred as PAs 4. Finally, Ceppa et al detailed a one child with a PMA that showed maturation to PA on four successive surgeries over a 5‐year time period 5 and is most similar to our case 1 who survived and has had multiple recurrences with progressive maturation over time from PMA to PA. On the contrary, in our series, maturation was the exception not the rule as another patient with pure PMA recurred as a pure PMA and subsequently died (case 3), and one tumor progressed from pure PMA to intermediate PMA (mixed PA/PMA) and the patient still succumbed (case 5). Cumulatively, there is little doubt that these two tumors represent the same entity, existing within a spectrum, but the tendency for maturation is clearly quite varied, and unfortunately, most PMAs—for reasons unknown—fail to show maturation over time, despite similar intervening therapies.
Despite the fact that PMA and PA exist in a spectrum, demographic differences certainly exist between PMAs and PAs, and even between pure PMAs and intermediate PMAs 12. In our series, median age of PMAs (8 months) was considerably younger than PAs (7 years) in the same anatomical location, similar to the findings of Komotar et al who noted mean ages at diagnosis for PMA and PA groups of 18 months (range, 2–84 months) and 58 months (range, 4–189 months), respectively (P < 0.01) 15. Despite the similar anatomical location of our PMAs and PAs, we also noted that patients with PMAs fared worse than those with similarly located PAs 15 (see Table 1), especially if the patient with PMA had diencephalic syndrome. Four of four PMA patients in our series with diencephalic syndrome succumbed. Although we did not specifically review the extent of surgical resection in our cohort, Komotar et al, in their larger series of 42 PAs and 21 PMAs restricted to hypothalamic/chiasm, felt that “the extent of resection was comparable in the PMA and PA groups and did not affect the observed differences in PFS and OFS” 15. The greater extent of invasion of adjacent tissues in PMAs vs. PAs may however lead to greater ability to achieve gross total resection (GTR) in other anatomical sites such as cerebellum 18, where GTR could be achieved in 90.9% of cerebellar PAs vs. 13.6% of PMAs 8. Two PMA patients in our series had CSF dissemination (cases 2 and 4, one with autopsy documentation; see Table 1), which is generally, but not invariably 26, unresponsive to therapies. Both patients succumbed quickly in our series after development of metastatic disease.
In contrast, while several PAs have recurred, all PA patients survive and are currently stable. Komotar et al identified mean overall survival (OS) times for PMAs and PAs of 63 and 213 months, respectively (P < 0.001) 15. Also, similar to the series by Komotar et al is the fact that a few of their [5 of 21 (24%)] and our (4 of 8) PMA patients survived (see Table 1).
The tendency toward maturation in our case 1 manifested on microarray as progressive downregulation of overexpressed genes typical of PMA in samples tested from subsequent surgeries. Indeed, by the last surgical specimen with the greatest percentage of PA histologically, the gene expression array matched that of the PA cohort (see Figure 5). To our knowledge, this is the first study to demonstrate this “proof of principle” that PMA to PA transition is matched by change in gene expression.
Unfortunately, case 2 had quite the opposite outcome with rapid progression and demise 10 months after the initial diagnosis. Although the sample from the autopsy contained degraded RNA and we were not able to directly compare it with the initial resection specimen RNA in this patient, the extensive workup at autopsy clearly showed a bimodal‐appearing tumor, with areas with PA differentiation juxtaposed with zones of de‐differentiation to GBM. This was matched by very high MIB‐1 rate in the GBM vs. PA areas [see Figure 4D,H (bottom)], but no loss of p16 (Figure 4I). P16 loss and BRAF V600E mutation have been seen in an adult with a cerebellar anaplastic PA 28 and 20% of anaplastic PAs in another study showed P16 homozygous deletion 23, but neither played a factor in our case with transformation to GBM. In fact, none of our seven assessable PMA cases showed either BRAF VE1 immunohistochemical expression or BRAF V600E mutation on Sanger sequencing, including the case with transformation to GBM. Eigenbrod et al similarly reported an intramedullary PMA with an intracerebral recurrence and neither the initial or recurrent specimens showed BRAF V600E mutation 7. In the previously reported case of PMA in a child that showed rapid progression to GBM, neither P16 nor BRAF mutation had been assessed 18.
A second reason we tested our cohort for BRAF V600E mutation was the potential for targeted therapy in our PMA patients. While a PMA patient with mutation has recently been reported who did respond to vemurafenib 25, no mutations were detected in our cohort and this therapy was not an option for case 2. BRAF:KIAA fusion testing was hampered by the fact that many of our older specimens had been fixed in zinc formalin and were specimen failures. However, the metastatic PMA (case 2) as well as PMA cases 4 and 7 showed the fusion, while three of four assessable PA cases had the fusion. While the numbers are too small to draw firm conclusions, there were no striking differences in BRAF status between the two cohorts.
Microarray analysis of PMA identified overexpression of developmental, mitotic and extracellular matrix genes compared to PA. These gene roles are consistent with the histological and pathological hallmarks of PMA. Ontology‐enrichment analysis identified overexpression in PMAs of extracellular matrix and mitosis‐related genes. It is notable that mitosis‐related genes were overexpressed in PMAs vs. PAs despite the known overlap between the rates in these two entities 23. The MIB‐1 rates for pure PMAs in our study were not out of range of previously reported levels 8, 12, and thus our study cohort was not skewed by cases that were exceptionally proliferative, although such cases have been reported 21. Possibly the microarray better detects modest differences in cell cycling between PMAs and PAs than does manual MIB‐1 counts. The finding of increased gene expression related to extracellular matrix parallels nicely the finding of abundant mucoid matrix in PMAs compared to PAs (see Supporting Information Figure S1).
In a second analysis, genes overexpressed in PMA vs. PA were ranked according to fold‐change; genes identified by this approach included developmental genes H19, DACT2, extracellular matrix collagens (COL2A1; COL1A1) and IGF2BP3 (IMP3), the latter gene previously identified as an adverse prognostic factor in PMA and PA 2. By site‐restricting this study in comparison with our previous study 2, several of these new genes also emerged as significant. More study will be necessary to determine if there is any potential diagnostic or therapeutic utility to this gene expression discovery pattern. Finally, and equally interesting, is the fact that within the small cohort of eight pure PMAs, while they all had similar initial microarray profiles, they nevertheless demonstrated diverse clinical outcomes and biological tendency toward maturation. Microarray did not provide clues as to what influences potential for maturation.
Supporting information
Figure S1. A–I. Representative images of all PMAs in study (see Figure 3A, for case 2), with angiocentricity in 7 of 8 cases (exception: case 6) and abundant mucin in cases 3, 6, and 8. H&E, a, b, c, h, i; periodic acid‐Schiff e, f; Alcian blue g, immunohistochemistry for GFAP d. Magnifications a–h = 200×, i = 100×.
Acknowledgments
The authors would like to thank The Morgan Adams Foundation and the Molecular Pathology Shared Resource of the University of Colorado's NIH/NCI Cancer Center Grant P30CA046934 for the financial support of this project, Mrs Diane Hutchinson for expert manuscript preparation, Ms Liza Litzenberger for photographic expertise and Dr Dara Aisner who performed the assessment of BRAF mutation in the Colorado Molecular Correlates Laboratory.
Presented in abstract format at the 90th annual meeting of the American Association of Neuropathologists, Portland, Oregon, June 2014.
References
- 1. Ashburner M, Ball CA, Blake JA, Botstein D, Butler H, Cherry JM et al (2000) Gene ontology: tool for the unification of biology. The Gene Ontology Consortium. Nat Genet 25:25–29. [DOI] [PMC free article] [PubMed] [Google Scholar]
- 2. Barton VN, Donson AM, Birks DK, Kleinschmidt‐DeMasters BK, Handler MH, Foreman NK, Rush SZ (2013) Insulin‐like growth factor 2 mRNA binding protein 3 expression is an independent prognostic factor in pediatric pilocytic and pilomyxoid astrocytoma. J Neuropathol Exp Neurol 72:442–449. [DOI] [PMC free article] [PubMed] [Google Scholar]
- 3. Bhargava D, Sinha P, Chumas P, Al‐Tamimi Y, Shivane A, Chakrabarty A et al (2013) Occurrence and distribution of pilomyxoid astrocytoma. Br J Neurosurg 27:413–418. [DOI] [PubMed] [Google Scholar]
- 4. Ceppa EP, Bouffet E, Griebel R, Robinson C, Tihan T (2007) The pilomyxoid astrocytoma and its relationship to pilocytic astrocytoma: report of a case and a critical review of the entity. J Neurooncol 81:191–196. [DOI] [PubMed] [Google Scholar]
- 5. Chikai K, Ohnishi A, Kato T, Ikeda J, Sawamura Y, Iwasaki Y et al (2004) Clinico‐pathological features of pilomyxoid astrocytoma of the optic pathway. Acta Neuropathol 108:109–114. [DOI] [PubMed] [Google Scholar]
- 6. Douc‐Rasy S, Coll J, Barrois M, Joubel A, Prost S, Dozier C et al (1993) Expression of the human fetal BAC/H19 gene in invasive cancers. Int J Oncol 2:753–758. [DOI] [PubMed] [Google Scholar]
- 7. Eigenbrod S, Thon N, Jansen N, Janssen H, Mielke J, Ruiter M et al (2012) Intramedullary pilomyxoid astrocytoma with intracerebral metastasis exhibiting oligodendroglioma‐like features. Rare Tumors 4:e30. [DOI] [PMC free article] [PubMed] [Google Scholar]
- 8. El Beltagy MA, Atteya MM, El‐Haddad A, Awad M, Taha H, Kamal M, El Naga SA (2014) Surgical and clinical aspects of cerebellar pilomyxoid‐spectrum astrocytomas in children. Childs Nerv Syst 30:1045–1053. [DOI] [PubMed] [Google Scholar]
- 9. Fernandez C, Figarella‐Branger D, Girard N, Bouvier‐Labit C, Gouvernet J, Paz Paredes A, Lena G (2003) Pilocytic astrocytomas in children: prognostic factors—a retrospective study of 80 cases. Neurosurgery 53:544–553. discussion 554–5. [DOI] [PubMed] [Google Scholar]
- 10. Ho CY, Bar E, Giannini C, Marchionni L, Karajannis MA, Zagzag D et al (2013) MicroRNA profiling in pediatric pilocytic astrocytoma reveals biologically relevant targets, including PBX3, NFIB, and METAP2. Neuro‐Oncol 15:69–82. [DOI] [PMC free article] [PubMed] [Google Scholar]
- 11. Jeon YK, Cheon JE, Kim SK, Wang KC, Cho BK, Park SH (2008) Clinicopathological features and global genomic copy number alterations of pilomyxoid astrocytoma in the hypothalamus/optic pathway: comparative analysis with pilocytic astrocytoma using array‐based comparative genomic hybridization. Mod Pathol 21:1345–1356. [DOI] [PubMed] [Google Scholar]
- 12. Johnson MW, Eberhart CG, Perry A, Tihan T, Cohen KJ, Rosenblum MK et al (2010) Spectrum of pilomyxoid astrocytomas: intermediate pilomyxoid tumors. Am J Surg Pathol 34:1783–1791. [DOI] [PubMed] [Google Scholar]
- 13. Kleinschmidt‐DeMasters BK, Foreman N, Handler M (2008) Pilomyxoid tumors with a chronic relapsing course may become more cystic and mature to pilocytic histology: abstract from the International Symposium on Pediatric Neuro‐oncology. J Neurooncol 10:460–461. [Google Scholar]
- 14. Komakula ST, Fenton LZ, Kleinschmidt‐DeMasters BK, Foreman NK (2007) Pilomyxoid astrocytoma: neuroimaging with clinicopathologic correlates in 4 cases followed over time. J Pediatr Hematol Oncol 29:465–470. [DOI] [PubMed] [Google Scholar]
- 15. Komotar RJ, Burger PC, Carson BS, Brem H, Olivi A, Goldthwaite PT, Tihan T (2004) Pilocytic and pilomyxoid hypothalamic/chiasmatic astrocytomas. Neurosurgery 54:72–79. discussion 79–80. [DOI] [PubMed] [Google Scholar]
- 16. Konishi H, Namikawa K, Shikata K, Kobatake Y, Tachibana T, Kiyama H (2007) Identification of peripherin as a Akt substrate in neurons. J Biol Chem 282:23491–23499. [DOI] [PubMed] [Google Scholar]
- 17. Lambert SR, Witt H, Hovestadt V, Zucknick M, Kool M, Pearson DM et al (2013) Differential expression and methylation of brain developmental genes define location‐specific subsets of pilocytic astrocytoma. Acta Neuropathol 126:291–301. [DOI] [PubMed] [Google Scholar]
- 18. Okano A, Oya S, Fujisawa N, Tsuchiya T, Indo M, Nakamura T et al (2013) Significance of radical resection for pilomyxoid astrocytoma of the cerebellum: a case report and review of the literature. Childs Nerv Syst 29:1375–1379. [DOI] [PubMed] [Google Scholar]
- 19. Pachnis V, Brannan CI, Tilghman SM (1988) The structure and expression of a novel gene activated in early mouse embryogenesis. EMBO J 7:673–681. [DOI] [PMC free article] [PubMed] [Google Scholar]
- 20. Paraskevopoulos D, Patsalas I, Karkavelas G, Foroglou N, Magras I, Selviaridis P (2011) Pilomyxoid astrocytoma of the cervical spinal cord in a child with rapid progression into glioblastoma: case report and literature review. Childs Nerv Syst 27:313–321. [DOI] [PubMed] [Google Scholar]
- 21. Pruthi SK, Chakraborti S, Naik R, Ballal CK (2013) Pilomyxoid astrocytoma with high proliferation index. J Pediatr Neurosci 8:243–246. [DOI] [PMC free article] [PubMed] [Google Scholar]
- 22. Reiss K1, Maretzky T, Haas IG, Schulte M, Ludwig A, Frank M, Saftig P (2006) Regulated ADAM10‐dependent ectodomain shedding of gamma‐protocadherin C3 modulates cell‐cell adhesion. J Biol Chem 281:21735–21744. [DOI] [PubMed] [Google Scholar]
- 23. Rodriguez EF, Scheithauer BW, Giannini C, Rynearson A, Cen L, Hoesley B et al (2011) PI3K/AKT pathway alterations are associated with clinically aggressive and histologically anaplastic subsets of pilocytic astrocytoma. Acta Neuropathol 121:407–420. [DOI] [PMC free article] [PubMed] [Google Scholar]
- 24. Scheithauer BW, Hawkins C, Tihan T, VandenBerg SR, Burger PC (2007) Pilocytic astrocytoma. Chapter 1. In: WHO Classification of Tumours of the Central Nervous System. Louis DN, Ohgaki H, Wiestler OD, Cavenee WK (eds), pp. 14–21. IARC: Lyon. [Google Scholar]
- 25. Skrypek M, Foreman N, Guillaume D, Moertel C (2014) Pilomyxoid astrocytoma treated successfully with vemurafenib. Pediatr Blood Cancer 61:2099–2100. [DOI] [PubMed] [Google Scholar]
- 26. Terasaki M, Bouffet E, Maeda M, Sugita Y, Sawamura Y, Morioka M (2012) Successful treatment of leptomeningeal gliomatosis of pilomyxoid astrocytoma after failed frontline chemotherapy. Neurologist 18:32–35. [DOI] [PubMed] [Google Scholar]
- 27. Tihan T, Fisher PG, Kepner JL, Godfraind C, McComb RD, Goldthwaite PT, Burger PC (1999) Pediatric astrocytomas with monomorphous pilomyxoid features and a less favorable outcome. J Neuropathol Exp Neurol 58:1061–1068. [DOI] [PubMed] [Google Scholar]
- 28. Yeo YH, Byrne NP, Counelis GJ, Perry A (2013) Adult with cerebellar anaplastic pilocytic astrocytoma associated with BRAF V600E mutation and p16 loss. Clin Neuropathol 32:159–164. [DOI] [PubMed] [Google Scholar]
Associated Data
This section collects any data citations, data availability statements, or supplementary materials included in this article.
Supplementary Materials
Figure S1. A–I. Representative images of all PMAs in study (see Figure 3A, for case 2), with angiocentricity in 7 of 8 cases (exception: case 6) and abundant mucin in cases 3, 6, and 8. H&E, a, b, c, h, i; periodic acid‐Schiff e, f; Alcian blue g, immunohistochemistry for GFAP d. Magnifications a–h = 200×, i = 100×.