

Abstract
Keratan sulfate (KS) is a storage material in mucopolysaccharidosis IV (MPS IV). However, no detailed analysis has been reported on subclasses of KS: mono-sulfated KS and di-sulfated KS. We established a novel method to distinguish and quantify mono- and di-sulfated KS using liquid chromatography–tandem mass spectrometry and measured both KS levels in various specimens.
Di-sulfated KS was dominant in shark cartilage and rat serum, while mono-sulfated KS was dominant in bovine cornea and human serum. Levels of both mono- and di-sulfated KS varied with age in the blood and urine from control subjects and patients with MPS II and IVA. The mean levels of both forms of KS in the plasma/serum from patients with MPS II, IVA, and IVB were elevated compared with that in age-matched controls. Di-sulfated KS provided more significant difference between MPS IVA and the age-matched controls than mono-sulfated KS. The ratio of di-sulfated KS to total KS in plasma/serum increased with age in control subjects and patients with MPS II but was age independent in MPS IVA patients. Consequently, this ratio can discriminate younger MPS IVA patients from controls. Levels of mono- and di-sulfated KS in urine of MPS IVA and IVB patients were all higher than age-matched controls for all ages studied.
In conclusion, the level of di-sulfated KS and its ratio to total KS can distinguish control subjects from patients with MPS II, IVA, and IVB, indicating that di-sulfated KS may be a novel biomarker for these disorders.
Introduction
Keratan sulfate (KS), a linear polymer glycosaminoglycan (GAG), is composed of alternating d-galactose (Gal) and N-acetyl-d-glucosamine (GlcNAc) residues linked to β1 → 4 and β1 → 3, respectively. KS attaches to core proteins including aggrecan, luminican, keratocan, mimecan, and fibromodulin with fucose and sialic acid and is distributed in the articular cartilage, cornea, brain, and various endothelial cells (Funderburgh 2000). KS is almost always sulfated on C (6) of GlcNAc, while C (6) of Gal is sulfated to a variable extent, depending on the tissue and age (Bhavanandan and Meyer 1968). KS chains of fibromodulin in articular cartilage are highly sulfated compared to that in the cornea (Lauder et al. 1997; Nieduszynski et al. 1990), and the levels of sulfation in cornea and cartilage increase during normal aging (Liles et al. 2010; Brown et al. 1998).
Mucopolysaccharidosis IV includes two subtypes, mucopolysaccharidosis IVA and IVB (MPS IVA, Morquio A syndrome; MPS IVB, Morquio B syndrome), caused by the deficiency of N-acetylgalactosamine-6-sulfate sulfatase (GALNS) and β-galactosidase (β-gal), respectively. Either enzyme deficiency results in accumulation of undegraded KS especially in cells and extracellular matrix (ECM) of cartilage and cornea. Patients with a classic (severe) form of MPS IVA have a unique systemic skeletal dysplasia including short-trunk dwarfism, kyphoscoliosis, coxa valga, odontoid hypoplasia, abnormal gait, joint mobility problems, restriction of chest wall movement, and a life span of 20–30 years if an appropriate orthopedic intervention is unavailable. Patients with an attenuated form have a milder skeletal involvement, and most have normal life span (Dũng et al. 2013; Yasuda et al. 2013; Tomatsu et al. 2011, 2012a, 2013a, b; Northover et al. 1996; Montaño et al. 2007, 2008; Suzuki et al. 2001; Hendriksz et al. 2013; Möllmann et al. 2013; Harmatz et al. 2013). Patients with MPS IVB show a milder phenotype of skeletal dysplasia than patients with the severe form of MPS IVA. Consequently, clinical features of MPS IVB are similar to those in patients with an attenuated form of MPS IVA.
We have established a reproducible, sensitive, and specific assay technique to measure KS in blood, urine, and dried blood spot (DBS) specimens using liquid chromatography–tandem mass spectrometry (LC-MS/MS) (Tomatsu et al. 2010a, b, 2013a; Oguma et al. 2007a, b; Hintze et al. 2011). Similar methods have been validated in another laboratory (Martell et al. 2011). KS levels in blood and urine in patients with MPS IVA are associated with age and clinical severity (Tomatsu et al. 2010c) and are decreased with enzyme replacement therapy (ERT) on mouse model and bone marrow transplantation (BMT) in a patient with MPS IVA (Tomatsu et al. 2008; Chinen et al. 2014). Thus, KS levels in the blood and/or urine should be a suitable biomarker for early diagnosis, screening, clinical severity, and therapeutic efficacy in MPS IVA (Tomatsu et al. 2008, 2010c, 2013a). However, there is significant overlap of KS levels between age-matched controls and patients with MPS IVA, especially in patients older than 10 years of age, suggesting that better biomarkers or methodology for MPS IVA are needed (Tomatsu et al. 2010c). Blood KS level was also elevated in patients with MPS II and MPS IVB, resulting in difficulty to separate MPS IVA from MPS II and MPS IVB or other types of MPS by total KS (Tomatsu et al. 2005, 2010c). Patients with MPS IVA and IVB have a deficiency of the enzyme that directly involves KS metabolism, N-acetylgalactosamine-6-sulfate sulfatase (GALNS) and β-galactosidase, respectively. Therefore, elevation of KS in the blood and urine of these types of MPS is natural; however, it is unexpected that patients with other types of MPS, in which responsible enzymes do not directly involve the catabolic pathway of KS, have the elevation of KS in the blood and urine as well.
GALNS removes the sulfate at C(6) in Gal of the di-sulfated KS, Gal(6S)β1 → 4GlcNAc(6S), producing mono-sulfated KS, Galβ1 → 4GlcNAc(6S). Our previous results showed that the proportion of di-sulfated KS in total KS in the patients with MPS IVA is higher than that in the control subjects (Tomatsu et al. 2010c); but the low sensitivity and specificity of the assay to detect di-sulfated KS limited further studies. Improvement of the assay method to separate di-sulfated KS and mono-sulfated KS was needed to distinguish MPS IVA, control subjects, and other types of MPS precisely.
In this study, we have determined di-sulfated KS levels and the proportion of di-sulfated KS in total KS in the blood and urine of control subjects and patients with MPS II, IVA, and IVB by using a novel LC-MS/MS method. We have compared its feasibility of di-sulfated KS with mono-sulfated KS as a biomarker for MPS.
Materials and Methods
Materials
Polymer KS
Two purified polymer KS samples were supplied by Seikagaku Co. (Tokyo, Japan). One originated from bovine cornea (KS-I), and the other, from shark cartilage (KSP). The ratio of sulfation in these two polymer KS samples was investigated in comparison with human dried blood spot (DBS), serum and urine, and rat serum.
Subjects
Blood specimens (plasma/serum) were collected from 58 patients with MPS II (phenotype: severe, 47; attenuated, 11), 35 patients with MPS IVA (phenotype: severe, 32; undefined, 3), and five patients with MPS IVB (all attenuated) with informed consent. Urine specimens were collected from 14 patients with MPS IVA (all severe) and five patients with MPS IVB (all attenuated) with informed consent. Information of age and clinical phenotype of each patient was obtained. Plasma/serum and urine samples were similarly obtained from 144 and 44 healthy controls, respectively. The diagnosis of MPS II, MPS IVA, and MPS IVB was made on the basis of enzyme activity (iduronate-2-sulfatase, GALNS, and β-gal, respectively) being less than 5% of levels found in normal plasma, leukocytes, or fibroblasts. Clinical severity for patients with MPS IVA was classified based on patient age and height, as described previously (Montaño et al. 2008; Tomatsu et al. 2012b). The phenotype of patients with MPS IVB was determined using the same classification. Clinical severity for patients with MPS II was classified based according to CNS involvement (Rozdzynska et al. 2011). In previous experiments by LC-MS/MS, we confirmed that there is no difference of GAG value in specificity and sensitivity between plasma and serum (Oguma et al. 2007a, b; Tomatsu et al. 2010b, c).
Enzymes and Standard
Keratanase II from Seikagaku Co. was used to digest “polymer” KS to disaccharides. Keratanase II can digest polymers that contain either mono-sulfated KS, Galβ1 → 4GlcNAc(6S), or di-sulfated KS, Gal(6S)β1 → 4GlcNAc(6S). Gel permeation chromatography (GPC)-HPLC study showed that 60 % of KS-I was digested with keratanase II (Tomatsu et al. 2013a, 2014). Di-sulfated KS (L4; 20 μg/ml), polymer KS (20 μg/ml), and chondrosine for internal standard (IS) (1 mg/ml) supplied by Seikagaku Co. were prepared separately in ddH2O. Standard working solutions of KS-I (0.1, 0.2, 1.0, 2.0, and 10.0 μg/ml) and IS solution (5 μg/ml) were prepared.
Keratanase II produced in Seikagaku Co. will be available upon request.
Methods
Sample Preparation
Plasma/serum, urine specimens, and standards were prepared as follows: Ten micro liter of each plasma/serum and urine sample and 90 μl of 50 mM Tris–hydrochloric acid buffer (pH 7.0) were placed in wells of AcroPrep™ Advance 96-Well Filter Plates that have Ultrafiltration Omega 10 K membrane filters (PALL Corporation, NY, USA). The filter plates were placed on the receiver and centrifuged at 2,000 g for 15 min to remove free disaccharides. The membrane plates were transferred to a fresh receiver plate. Standards were added to unused wells of the filter plate. Ten micro liter of IS solution (5 μg/ml), 80 μl of 50 mM Tris–hydrochloric acid buffer (pH 7.0), and 10 μl of keratanase II (2 mU per sample) were added to each filter well. The plate was incubated in a water bath at 37°C for 15 h and centrifuged at 2,000 g for 15 min. The receiver plate containing disaccharides was stored at −20°C until injection to LC-MS/MS.
Apparatus
The chromatographic system consisted of 1260 Infinity Degasser, binary pump, auto-injector, thermostatted column compartment, and 1290 Infinity Thermostat (Agilent Technologies, Palo Alto, CA, USA) and a Hypercarb column (2.0 mm i.d. 50 mm, 5 μm, Thermo Electron, USA). The column temperature was kept at 60°C. The mobile phase was a gradient elution from 0.025% ammonia to 90% acetonitrile in 0.025% ammonia. The gradient condition was programmed as follows: The initial composition of 0% acetonitrile was kept for 0.1 min, linearly modified to 30% over 1.8 min, maintained at 30% for 0.3 min, returned to 0% over 0.01 min, and finally maintained at 0% for 2.5 min. The flow rate was 0.6 ml/min. The 6460 Triple Quad mass spectrometer (Agilent Technologies) was operated in the negative ion detection mode with thermal gradient focusing electrospray ionization (Agilent Jet Stream technology, AJS). The parameters of Jet Stream technology were as follows: drying gas temperature, 350°C; drying gas flow, 11 l/min; nebulizer pressure, 35 psi; sheath gas temperature, 400°C; sheath gas flow, 11 l/min; capillary voltage, 4,000 V; and nozzle voltage, 2,000 V. A m/z 462 precursor ion and m/z 97 product ion were used to detect and quantify the mono-sulfated KS, and a m/z 542 precursor ion and m/z 462 product ion were used to detect and quantify the di-sulfated KS (Zhang et al. 2005). A m/z 354.29 precursor ion and m/z 193.1 product ion were used to detect the IS. Peak areas for all components were integrated automatically using QQQ Quantitative Analysis software (Agilent Technologies), and peak area ratios (area of analytes/area of IS) were plotted against concentration by weighted linear regression. Raw data of LC-MS/MS were automatically preserved. The concentration of each disaccharide was calculated using QQQ Quantitative Analysis software. The data of urine samples were corrected by creatinine (Cre) levels with Creatinine (urinary) Colorimetric Assay Kit (Cayman Chem. MI, USA).
Method Validation
The recoveries of analytes were determined by adding di-sulfated KS to control serum, comparing the control serum without standard di-sulfated KS. Intraday precision evaluated as coefficient of variation (CV) was determined by replicate analyses (n = 5) of three different control specimens (serum, plasma, and urine). Interday precision was determined by replicate analyses (n = 5) of three different serum specimens (serum, plasma, and urine) on three separate days.
The selectivity of the assay was investigated by processing and analyzing five independent samples by the procedure described above without enzymatic digestion. Calibration curves were constructed by plotting the peak area ratio of the analytes to IS against the concentration of the analytes. Each calibration curve consisted of seven calibration points.
Statistical Analysis
Patients were grouped by age as follows: 0 to <3years (years), 3 to <5 years, 5 to <10 years, 10 to <15 years, 15 to <20 years, and 20 years and above. Mono-sulfated and di-sulfated KS value (μg/ml) as well as proportion of di-sulfated KS in serum/plasma and urine was summarized by age groups and patient groups (control, MPS II, MPS IVA, and MPS IVB). Data were summarized using mean and standard deviation (SD). Age-adjusted standardized values of mono-sulfated and di-sulfated KS were calculated for MPS IVA patients. Corresponding concentration of control subjects was used as a reference for standardization. Specifically, for the age-matched group, standardized mono-sulfated KS of MPS IVA patients = (mono-sulfated KS for patients in the age-matched group of MPS IVA – mean mono-sulfated KS for control subjects in the age-matched group)/(SD of mono-sulfated KS for control subjects in the age-matched group). The mean age-adjusted standardized mono- and di-sulfated KS of MPS IVA patients was compared using t-test. In addition, numbers and percentages of MPS IVA patients with mono- and di-sulfated KS levels in serum/plasma and urine more than 2 and 3 SD above the mean of age-matched controls were estimated. Chi-square test and logistic regression analysis were performed to compare the proportion of MPS IVA patients with mono- and di-sulfated KS more than 2 and 3 SD above the mean of age-matched controls. The odds ratio (OR) and p value are presented. Test and model assumptions were checked before statistical analyses. All tests were two-tailed at the level of significance of 0.05. Analysis was performed using SPSS for Windows (version 22.0, IBM, Chicago, IL, USA).
Results
Sulfation Pattern of KS
The peak of di-sulfated KS eluted at 3.22 min and was clearly detected by MRM conditions of m/z 542 of the precursor ion and m/z 462 of product ion (Fig. 1a). It was also detected by multiple reaction monitoring (MRM) conditions of m/z 462 of the precursor ion and m/z 97 of product ion, presumably due to loss of sulfate in the fragmentor. After digestion of KS-I (bovine cornea) by keratanase II, a major peak of mono-sulfated KS (m/z 462 precursor, m/z 97 product) eluted at 3.06 min, and a minor peak of di-sulfated KS eluted at 3.22 min (Fig. 1b). After digestion of KPS (shark cartilage), only the di-sulfated KS peak was observed (Fig. 1c). These sulfation patterns of KS-I and KSP were confirmed by using GPC-HPLC. GPC analysis also showed that the proportion of di-sulfated KS vs. mono-sulfated KS in KS-I was 42% vs. 58 , while KPS contained nearly 100% of di-sulfated KS (data not shown). Thus, the results by LC-MS/MS were consistent with those by GPC-HPLC.
Fig. 1.
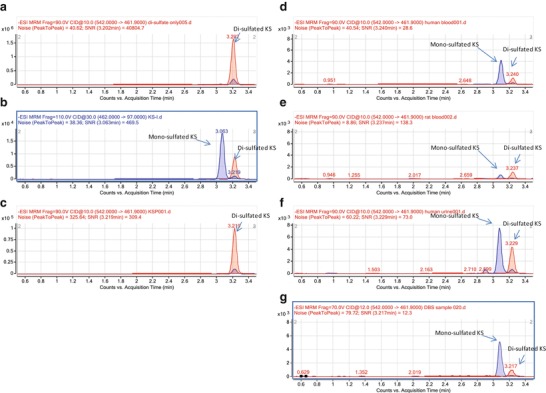
Chromatogram for KS after digestion of keratanase II. (a) Di-sulfated KS standard. (b) KS-I: bovine cornea. (c) KSP: shark cartilage. (d) Human serum. (e) Rat serum. (f) Human urine. (g) Human dried blood spot (DBS). Blue line showed the MRM condition as m/z 462 precursor ion and m/z 97 product ion, which detected both mono- and di-sulfated KS. Red line showed the MRM condition as m/z 542 precursor ion and m/z 462 product ion, which detected di-sulfated KS only
In human serum specimens from normal control subjects digested by keratanase II, two peaks corresponding to mono- and di-sulfated KS were observed (Fig. 1d). The ratio of forms of sulfated KS was similar to that in bovine cornea. Serum sample from control rat showed a different pattern compared to human serum sample. Total level of KS in rat serum was much lower than that in human serum and the major form was di-sulfated KS (Fig. 1e). A human urine sample also showed the presence of mono- and di-sulfated KS with a higher proportion of di-sulfated KS than seen in human serum (Fig. 1f). In human DBS, two peaks corresponding to mono- and di-sulfated KS were detected, and the ratio of forms of sulfated KS was similar to that in human serum (Fig. 1g). These findings suggest that the sulfation pattern of KS depends on the tissue, species, and specimen analyzed.
Calibration Curves
Calibration curves for both of mono- and di-sulfated KS obtained on five separate days were linear over the concentration ranges of 0.1–10 μg/ml. The correlation coefficients (r) were not less than 0.99.
Precision and Accuracy
The mean recoveries of di-sulfated KS in control serum were 91.2% and 101.5% at concentration of 5.0 and 2.5 μg/ml, respectively. Mean recoveries of mono-sulfated KS in control serum are more than 87% at concentrations of 5.0 and 2.5 μg/ml (Oguma et al. 2007a, b). Results of intra- and inter-assay precision for mono- and di-sulfated KS in control serum are as follows: The intra-assay precision values/coefficient of variation (CV) determined from the analysis of mono- and di-sulfated KS are less than 6.8 and 14.6% in serum, 5.1 and 9.4% in plasma, and 14.1 and 12.9% in urine, respectively. The inter-assay precision values/CVs for these disaccharides are less than 6.5 and 14.3% in serum, 6.7 and 8.2% in plasma, and 12.3 and 15.8% in urine, respectively. These results demonstrate the reproducibility and accuracy of the method.
Analysis of Mono- and Di-sulfated KS
Blood Mono-sulfated KS: Galβ1 → 4GlcNAc(6S)
The mono-sulfated KS values for the plasma/serum samples from 58 MPS II patients (average age 11.5, range 2–35 years), 35 MPS IVA patients (average age 15.9 years, range 3.4–56 years), 5 MPS IVB patients (average age 15.8 years, range 12.7–18.3 years), and 144 control subjects (average age 5.1 years, range 0–80 years) are described in Table 1 and Fig. 2a. In the control subjects, levels of mono-sulfated KS were relatively constant (approx. 3.0 μg/ml) up to the age of 10 years, after which they steadily declined before stabilizing in late teenage years to less than 1.5 μg/ml (Table 1). By contrast, levels of mono-sulfated KS in the blood of patients with MPS IVA were higher than those in age-matched control subjects (Table 1, Fig. 2a). There was not a clear separation of mono-sulfated KS levels between control subjects and patients with MPS IVA (Fig. 2a).
Table 1.
Levels of blood mono- and di-sulfated KS, and proportion of blood di-sulfated KS in total KS of patients with MPS and control subjects
| Age | Control | MPS II | MPS IV A | MPS IVB |
|---|---|---|---|---|
| Mano-sulfated KS (μg/ml) | ||||
| 0–2.9 | 3.80 ± 0.82 (n = 83) | 5.5 (n = 1) | ||
| 3–4.9 | 3.91 ± 0.92 (n = 19) | 6.34 ± 1.42 (n = 6)*** | 4.17 ± 1.39 (n = 2) | |
| 5–9.9 | 3.55 ± 0.59 (n = 22) | 7.11 ± 2.38 (n = 23)*** | 4.93 ± 0.83 (n = 10)*** | |
| 10–14.9 | 2.22 ± 0.53 (n = 12) | 5.79 ± 2.1 (n = 13)*** | 4.16 ± 1.22 (n = 9)*** | 3.82 ± 0.20 (n = 2) |
| 15–19.9 | 1.80 ± 0.64 (n = 4) | 4.32 ± 1.46 (n = 7)* | 3.93 ± 1.07 (n = 8)** | 2.98 ± 1.67 (n = 3) |
| 20- | 1.26 ± 0.23 (n = 4) | 3.47 ± 1.69 (n = 8)* | 2.04 ± 0.63 (n = 3)* | |
| Di-sulfated (μg/ml) | ||||
| 0–2.9 | 1.33 ± 0.34 (n = 83) | 2.69 (n = 1) | ||
| 3–4.9 | 1.56 ± (– = 19) | 2.85 ± 1.08 (n = 6)*** | 2.46 ± 1.30 (n = 2) | |
| 5–9.9 | 1.57 ± 0.29 (n = 22) | 4.05 ± 1.66 (n = 23)*** | 3.08 ± 0.70 (n = 10)*** | |
| 10–14.9 | 1.20 ± 0.32 (n = 12) | 3.47 ± 1.19 (n = 13)*** | 2.99 ± 0.90 (n = 9)*** | 2.32 ± 0.48 (n = 2) |
| 15–19.9 | 1.01 ± 0.31 (n = 4) | 2.71 ± 0.81 (n = 7)** | 2.30 ± 0.50 (n = 8)*** | 1.66 ± 1.22 (n = 3) |
| Proportion of blood di-sulfated KS in total KS (%) | ||||
| 0–2.9 | 25.9 ± 2.7 (n = 83) | 32.8 (n = 1) | ||
| 3–4.9 | 28.6 ± 3.3 (n = 19) | 30.4 ± 4.1 (n = 6) | 36.2 ± 5.0 (n = 2) | |
| 5–9.9 | 30.6 ± 2.3 (n = 22) | 35.8 ± 3.0 (n = 23)*** | 38.3 ± 4.2 (n = 10)*** | 37.6 ± 3.7 (n = 2) |
| 10–14.9 | 35.2 ± 4.5 (n = 12) | 37.6 ± 3.6 (n = 13) | 39.1 ± 2.8 (n = 9)* | 37.6 ± 3.7 (n = 2) |
| 15–19.9 | 36.1 ± 2.6 (n = 4) | 39.0 ± 2.5 (n = 7) | 37.1 ± 4.1 (n = 8) | 34.4 ± 5.3 (n = 3) |
| 20– | 42.0 ± 1.1 (n = 4) | 41.0 ± 3.6 (n = 8) | 41.6 ± 8.1 (n = 3) | |
Proportion is calculated as di-sulfated KS/total KS × 100 (%)
Data represent the mean ± SD values
*, ** and ***; significantly different from the control at p < 0.05, 0.01, and 0.001, respectively
Fig. 2.
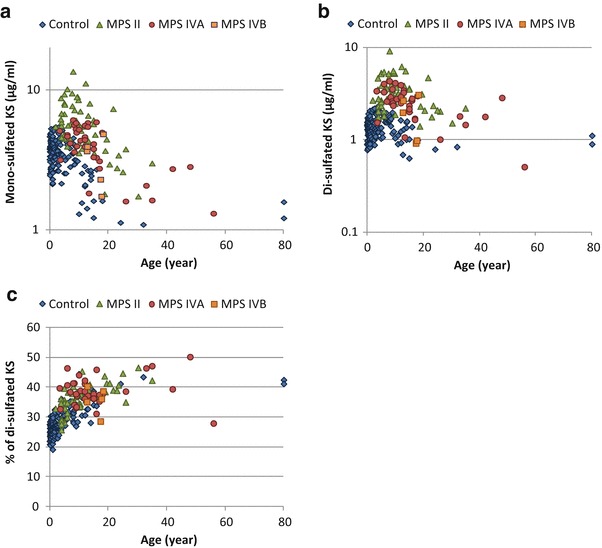
Levels of blood mono- and di-sulfated KS and proportion of blood di-sulfated KS in total KS of patients with MPS and control subjects. (a) Mono-sulfated KS, (b) Di-sulfated KS, and (c) Proportion of blood di-sulfated KS in total KS. Results of all specimens from patients and control subjects were plotted on a semilogarithmic scale (a, b) and regular scale (c) with respect to age
The levels of mono-sulfated KS were also compared between patients with MPS II and IVB and age-matched controls (Table 1, Fig. 2a). In the patients with MPS II, no differences were seen between attenuated and severe phenotypes in mono-sulfated KS. Fifty-four out of 58 (93%) and 43 out of 58 (74%) patients with MPS II had plasma/serum mono-sulfated KS levels more than 2 SD and 3 SD above the mean of age-matched controls, respectively (Table 1). Three out of five (60%) patients with MPS IVB had plasma/serum mono-sulfated KS levels more than 2 SD above the mean of age-matched controls (Table 1).
Blood Di-sulfated KS: Galβ1(6S) → 4GlcNAc(6S)
Plasma/serum di-sulfated KS values in patients with MPS II, IVA, and IVB and the control subjects are shown in Table 1 and Fig. 2b. Levels of di-sulfated KS in the blood from control subjects were also age dependent, similar to that seen for mono-sulfated KS. Di-sulfated KS concentration stayed relatively constant until 15 years of age (approx. 1.5 μg/ml) and then gradually decreased to 0.9 μg/ml in adults (Table 1). The levels of di-sulfated KS in the blood of patients with MPS IVA were significantly higher than those in age-matched control subjects (Table 1, Fig. 2b). Twenty-four out of 35 (69%) and 31 out of 35 (89%) patients with MPS IVA had mono- and di-sulfated KS levels in the blood more than 2 SD above the mean of age-matched controls, respectively. The proportion for di-sulfated KS is significantly higher than for mono-sulfated KS (p = 0.041). The likelihood of having di-sulfated KS levels more than 2SD above the mean of age-matched controls is significantly higher than that of having mono-sulfated KS levels in MPS IVA patients, OR = 3.63, p = 0.048. Eighteen out of 35 (51%) and 28 out of 35 (80%) patients had mono- and di-sulfated KS levels in the blood more than 3 SD above the mean of age-matched controls. Similarly, the proportion of MPS IVA patients with di-sulfated KS levels more than 3 SD above the mean age-matched control was significantly higher than that with mono-sulfated KS levels, OR = 3.78, p = 0.01. These findings indicate that di-sulfated KS is a better indicator than mono-sulfated KS to distinguish between MPS IVA patients and age-matched controls (cutoff 2 SD, p = 0.0002; 3 SD, p = 0.0003 by chi-square test). Nevertheless, two MPS IVA patients who had not received any therapy had blood levels of di-sulfated KS that were indistinguishable from controls (Fig. 2b).
Patients with MPS IVB had higher levels of plasma/serum di-sulfated KS than age-matched controls, but differences were not significant for this small set of patients (Table 1, Fig 2b). Fifty-four out of 58 MPS II patients (93%) had di-sulfated KS levels that were more than 2SD above the mean of age-matched controls (Table 1). The enzyme defect in MPS II causes accumulation of heparin sulfate and dermatan sulfate, and consequently elevation of di-sulfated KS must be an indirect effect.
Correlation Between Mono-sulfated KS and Di-sulfated KS Levels in the Blood
A strong correlation between levels of mono- and di-sulfated KS was observed (r2 = 0.7733) for both patients and controls. We found that the contribution of di-sulfated KS to total KS increased with age in the controls but was age independent in MPS IVA patients (Table 1, Fig. 2c). Thus, the proportion of di-sulfated KS in total KS was more discriminating in patients up to 15 years of age. The two patients aged 3.6 and 13.4 who had low levels of di-sulfated KS also had low levels of mono-sulfated KS, so they could be distinguished from controls by the ratio of di-sulfated KS to total KS (Fig. 2c). The fraction of di-sulfated KS in total KS in the patients with MPS II aged 5–10 years significantly increased compared to age-matched controls, but there was considerable overlap in individual values (Table 1, Fig. 2c). Ratio differences between patients with MPS IVB and controls were not significant.
Urine Mono-sulfated KS
The mono-sulfated KS values for the urine samples from 14 MPS IVA patients (average age 16.6 years, range 3.6–56 years), 5 MPS IVB patients (average age 15.8 years, range 12.7–18.3 years), and 44 control subjects (average age 5.1 years, range 0–54 years) are shown in Table 2 and Fig. 3a. Levels of mono-sulfated KS in the urine were also age dependent (Fig. 3a). The level was highest in newborns (40 μg/mg Cre) and decreased until 15 years of age and reached a plateau in twenties and older (1.0 μg/mg Cre, Table 2). The levels of mono-sulfated KS in the urine of patients with MPS IVA were significantly higher than those in age-matched control subjects (Table 2, Fig. 3a). All patients with MPS IVA had levels of mono-sulfated KS that were higher than 3 SD above the mean of the age-matched controls. In contrast to blood samples, levels of urine mono-sulfated KS in patients with MPS IVB significantly increased as well, and all of them were more than 3 SD above the mean of age-matched controls (Table 1, Fig. 3a).
Table 2.
Levels of urine mono- and di-sulfated KS, and proportion of urine di-sulfated KS in total KS of patients with MPS and control subjects
| Age | Control | MPS IVA | MPS IVB |
|---|---|---|---|
| Mono-sulfated KS (μg/mg Cre) | |||
| 0–29.9 | 40.36 ± 27.29 (n = 20) | ||
| 3–9.9 | 21.56 ± 8.81 (n = 8) | 97.24 ± 59.45 (n = 7)** | |
| 10–19.9 | 5.71 ± 1.68 (n = 13) | 45.18 ± 26.80 (n = 5)*** | 25.41 ± 16.33 (n = 5)** |
| 20– | 1.07 ± 0.33 (n = 6) | 14.74 ± 2.84 (n = 2) | |
| Di-sulfated KS (μg/mg Cre) | |||
| 0–2.9 | 31.35 ± 14.66 (n = 20) | ||
| 3–9.9 | 31.01 ± 18.89 (n = 8) | 253.06 ± 147.91 (n = 7)** | |
| 10–19.9 | 10.45 ± 2.32 (n = 13) | 102.18 ± 58.81 (n = 5)*** | 21.02 ± 11.76 (n = 5)* |
| 20– | 3.59 ± 1.21 (n = 6) | 27.93 ± 8.45 (n = 2) | |
| Proportion of urine di-sulfated KS in total KS % | |||
| 0–2.9 | 45.38 ± 8.52 (n = 20) | ||
| 3–9.9 | 57.20 ± 11.07 (n = 8) | 71.99 ± 3.45 (n = 7)** | |
| 10–19.9 | 64.92 ± 4.74 (n = 13) | 69-48 ± 6.16 (n = 5) | 46.31 ± 2.86 (n = 5)*** |
| 20– | 76.77 ± 1.88 (n = 6) | 65.12 ± 2.58 (n = 2) | |
Proportion is calculated as di-sulfated KS/total KS × 100 (%)
Data represent the mean ± SD values
*, ** and ***; significantly different from the control at p < 0.05, 0.01, and 0.001, respectively
Fig. 3.
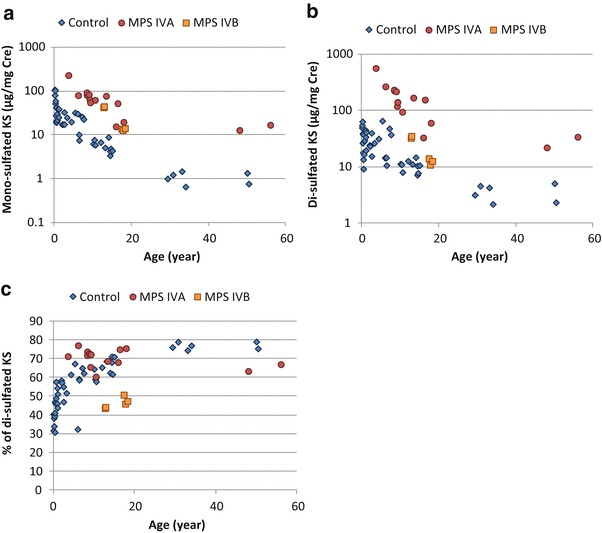
Levels of urine mono- and di-sulfated KS and proportion of blood di-sulfated KS in total KS of patients with MPS and control subjects. (a) Mono-sulfated KS, (b) Di-sulfated KS, and (c) Proportion of urine di-sulfated KS in total KS. Results of all specimens from patients and control subjects were plotted on a semilogarithmic scale (a, b) and regular scale (c) with respect to age
Urine Di-sulfated KS
In the control subjects, levels of urine di-sulfated KS were relatively constant (approx. 30 μg/mg Cre) up to 10 years of age and, thereafter, steadily declined to less than 5.0 μg/mg Cre in late teenage years (Table 2). The levels of urine di-sulfated KS in patients with MPS IVA were significantly higher than those in age-matched control subjects (Table 2, Fig. 3b). All patients with MPS IVA had urine levels of di-sulfated KS that were more than 3 SD above the mean of the age-matched controls. Levels of urine di-sulfated KS in patients with MPS IVB significantly increased, and two out of five patients with MPS IVB were more than 3 SD above the mean of age-matched controls (Table 2, Fig. 3b).
Correlation Between Mono-sulfated KS and Di-sulfated KS Levels in the Urine
There was a strong correlation between mono- and di-sulfated KS for both patients and controls (r2 = 0.7556). We found that the contribution of di-sulfated KS to total KS in the urine was higher than that in the blood and also increased with age in the controls and was age independent in MPS IVA patients (Fig. 3c, Table 2). The proportion of di-sulfated KS in total KS in the patients with MPS IVB was significantly lower than that in patients with MPS IVA (p < 0.001) and age-matched control subjects (p < 0.001) (Fig. 3C, Table 2).
Discussion
In this study, we have demonstrated (1) that the peak of di-sulfated KS is separated from the mono-sulfated KS as a pure single peak by the LC column using the m/z 542 di-sulfated precursor ion and m/z 462 product ion, (2) that the levels of blood and urine mono-sulfated and di-sulfated KS in control subjects are age dependent and decline with age, (3) that blood and urine mono- and di-sulfated KS levels in patients with MPS IVA are significantly higher than those in age-matched control subjects, (4) that the level of blood and urine di-sulfated KS distinguishes control subjects and patients with MPS IVA more clearly than that of mono-sulfated KS, (5) that the ratio of blood di-sulfated KS to total KS increases with age and was significantly elevated in patients with MPS IVA under 15 years of age compared to control subjects, (6) that levels of mono- and di-sulfated KS in the urine provide a clear difference between patients with MPS IVA and MPS IVB and age-matched controls, and (7) that blood mono- and di-sulfated KS levels are significantly higher in patients with MPS II than those in age-matched control subjects. In addition, total KS and levels of sulfation depend on species and tissues examined.
KS is comprised of repeating sulfated disaccharide units of Gal and GlcNAc (Galβ1-4GlcNAcβ1-3). The process of KS biosynthesis consists of (1) N-acetylglucosaminylation, (2) 6-sulfation of a GlcNAc residue, and (3) galactosylation. KS polymers are extended by the action of glycosyltransferases that alternately attach Gal and GlcNAc residues. KS is generally sulfated on C (6) of GlcNAc, while the C (6) of Gal is sulfated to a variable extent, depending on the tissue and age (Bhavanandan and Meyer 1968).
In previous studies, we identified mono- and di-sulfated KS using the same MRM condition of m/z 462 precursor ion and m/z 97 product ion using LC-MS/MS, but the two forms were not separately quantified completely (Oguma et al. 2007a, b; Hintze et al. 2011), resulting in an overlap of the values between mono- and di-sulfated KS. In this study we detected and quantified the di-sulfated KS using the m/z 542 precursor ion and m/z 462 product ion which is specific to di-sulfated KS and confirmed that the peak of di-sulfated KS is separated from the mono-sulfated KS as a pure single peak by the LC column. Thus, we have established more appropriate conditions for detecting mono- and di-sulfated KS separately compared to the previous method (Oguma et al. 2007a). We clearly show that KS in shark cartilage is mostly di-sulfated, while in bovine cornea mono-sulfated KS is dominant. This finding is consistent with the fact that KS chains of fibromodulin in cartilage are highly sulfated compared to that in the cornea (Lauder et al. 1997; Nieduszynski et al. 1990). Our data also show that the level of both mono- and di-sulfated KS in the blood of control subjects decline with age, while the degree of sulfation (i.e., proportion of di-sulfated KS in total KS) increases with age. Both mono- and di-sulfated forms of KS are found in the growth plates, articular cartilage, ECM, cornea, and brain. This age-dependent alteration of KS level in the plasma/serum can be explained by decreased KS synthesis after the growth plate is closed.
An increase of sulfation in blood and urine KS is compatible with that observed in the cartilage and cornea during normal aging (Liles et al. 2010; Brown et al. 1998). Gal sulfation levels increase during adolescence and early adulthood and then remain fairly constant in human articular cartilage (Brown et al. 1998).
KS is involved in specific biological functions including tissue hydration, cellular recognition of protein ligands, axonal guidance, cell motility, and embryo implantation (Chakravarti et al. 1998; Weyers et al. 2013; Imagama et al. 2011; Funderburgh et al. 1997; Graham et al. 1994). KS has been implicated in physiological and pathological status: (1) cushion in joints, (2) glial scar formation in spinal cord injury, (3) transparency in the cornea, and (4) skeletal dysplasia in patients with MPS IV. However, the physiological roles and distributions of the individual sulfated KS and its increased sulfation with age are not fully understood due to lack of accurate quantitative method to measure mono- and di-sulfated KS. The current method will shed light on the implication of physiological roles and distributions of the individual sulfated KS.
Total KS level in the plasma/serum can be used as a biomarker for MPS IVA (Tomatsu et al. 2008, 2010c, 2012b, 2013a; Hintze et al. 2011; Martell et al. 2011); however, there are substantial overlaps of KS values between control subjects and MPS IVA patients, especially for patients older than 15 years of age, and consequently total KS alone is not a good biomarker for MPS IVA patients of all ages. GALNS, an enzyme involved in the first step of degradation of polymer KS, hydrolyzes the C (6) sulfate of Gal from di-sulfated KS, Gal(6S)β1 → 4GlcNAc(6S), to produce mono-sulfated KS, Galβ1 → 4GlcNAc(6S). Therefore, as GALNS is deficient in patients with MPS IVA, di-sulfated KS would be expected to increase in the plasma/serum more clearly than mono-sulfated KS, as confirmed in this study. In this study, di-sulfated KS was found to improve discrimination between MPS IVA patients and controls compared to total KS and mono-sulfated KS and consequently may be a better biomarker for early diagnosis, screening, assessment of disease severity, and monitoring therapeutic efficacy for MPS IVA.
Levels of di-sulfated KS do not distinguish all MPS IVA patients from controls and may be affected by disease status. Most KS is synthesized in cartilage, and consequently blood KS reflects the amount of KS derived from cartilage. If cartilage turnover is reduced by prior loss, reduced activity, or other means, total blood KS could be lower in MPS IVA patients than in controls. Reduced total turnover of KS can be controlled in part by measuring the ratio of di-sulfated KS in total KS. This ratio allowed us to distinguish the two MPS IVA patients under 20 years of age who had low levels of di-sulfated KS from controls. Overall, this study has shown that the level of di-sulfated KS distinguishes patients with MPS IVA and control subjects better than that of mono-sulfated KS alone.
It is noteworthy that levels of KS are elevated in the blood from not only MPS IVA patients but around 90% of MPS II and other types of MPS patients (Tomatsu et al. 2005; Rowan et al. 2013; current study). The level of KS in the blood from MPS II patients was as high as that seen in MPS IVA patients. MPS II is caused by deficiency of iduronate-2-sulfatase, an enzyme that is not directly involved in the degradation of polymer KS, and consequently the mechanism of elevation of KS in these patients must differ from that seen in MPS IVA patients. In contrast to results from the blood, only 35% of levels of KS in the urine from MPS II patients were more than 2SD above the mean of age-matched controls. Several mechanisms have been proposed to account for a secondary elevation of blood KS in patients with MPS II and other types of MPS (Tomatsu et al. 2005): (1) Synthesis of KS could be induced by inflammation caused by storage of other GAGs. (2) GALNS activity could be inhibited by the increased concentrations of heparan sulfate in patients with MPS II (and some other MPS types) (Rowan et al. 2013). (3) KS secretion into the circulation could be due to damage of cartilage and its ECM caused by accumulation of other GAGs and its subsequent inflammation. It is well known that the degradation of proteoglycans occurs early in joint damage and that fragments are released into the synovial fluid and subsequently the serum (Dingle et al. 1975; Ratcliffe et al. 1988). Blood KS levels have been associated with severity of skeletal dysplasia in mouse models of MPS I, III, IVA, and VII (Rowan et al. 2013). (4) Polymer KS could be co-deposited with the other accumulated GAGs, hindering the interaction between KS and its catabolizing enzymes. (5) Alterations in the extent and distribution of fucosylation, sialylation, and sulfation on KS could make KS resistant to degradation (Tai et al. 1994). One or a combination of these mechanisms could contribute to a secondary elevation of KS. Regardless of the mechanism, our data show that KS levels in the blood is a good biomarker for MPS II and is better at distinguishing MPS II patients from controls than KS levels in the urine. A larger study including more patients with MPS II and other types of MPS will be required to establish age-dependent changes of KS in these disorders.
We did not see a significant elevation of either sulfated form of KS in the plasma/serum of patients with MPS IVB. Patients with MPS IVB have a milder phenotype compared with those in MPS IVA, so lower levels of secretion of KS would be expected. The proportion of di-sulfated KS in patients with MPS IVB is not as high as that seen in MPS IVA. There were only 5 MPS IVB patients in this study, and none have severe disease and none were younger than 12 years of age. Further studies including younger and severe-type patients with MPS IVB are required to determine the significance of sulfation levels of KS for this disorder.
Urine mono- and di-sulfated KS showed an age-dependent decline, similar to that seen for sulfated KS in the plasma/serum. Elevation of total urine KS in patients with MPS IVA has been reported (Tomatsu et al. 2010c; Martell et al. 2011). KS in the urine more clearly distinguishes patients with MPS IVA and MPS IVB from age-matched controls than levels in the plasma/serum, even for older patients. All urine samples from the five MPS IVB patients had a ratio of di-sulfated KS to total KS that is lower than that in age-matched controls. While deficiency of GALNS in MPS IVA would be expected to increase the proportion of di-sulfated KS, deficiency of β-gal in MPS IVB would not be expected to have any direct effect on sulfation levels. A larger study with more control subjects and patients is required to establish di-sulfated KS in the urine as a biomarker for MPS IVA and MPS IVB and to determine the mechanism by which sulfation levels are affected differentially in the plasma/serum and urine of MPS IVA and IVB patients.
Nevertheless, the proportion of di-sulfated KS in total KS in urine appears to be a useful biomarker to distinguish patients with MPS IVA and MPS IVB. Although not tested in this study, the measurement of mono- and di-sulfated KS could be potentially useful for monitoring the outcome of ERT and other therapies for MPS IVA.
Conclusions
In conclusion, we have developed a method to evaluate mono- and di-sulfated KS levels in a variety of specimens by LC-MS/MS systems, leading to understanding of species-specific and/or tissue-specific KS level and its sulfation level, and the age-dependent alteration of KS and its sulfation level. Significant difference in sulfation levels of KS between control subjects and patients with MPS IVA demonstrates that the di-sulfated KS is a potential biomarker for this disease.
Acknowledgment
This work was supported by grants from the Austrian MPS Society and International Morquio Organization (Carol Ann Foundation). This work was also supported by Japanese MPS Family Society. R.W.M. and S.T. were supported by an Institutional Development Award (IDeA) from the National Institute of General Medical Sciences of NIH under grant number P20GM103464. S.T. and A.M were supported by National Institutes of Health grant 1R01HD065767-02. The content of the article has not been influenced by the sponsors. F.K. was supported by Conselho Nacional de Desenvolvimento Científico e Tecnológico from Brazil (CNPq). Editorial assistance to the manuscript was provided by Michelle Stofa at Nemours/Alfred I. duPont Hospital for Children.
Abbreviations
- Cre
Creatinine
- DBS
Dried blood spot
- ECM
Extracellular matrix
- GAG
Glycosaminoglycans
- Gal
d-galactose
- GALNS
N-acetylgalactosamine-6-sulfate sulfatase
- GlcNAc
N-acetyl-d-glucosamine
- KS
Keratan sulfate
- LC-MS/MS
High-performance liquid chromatography– tandem mass spectrometry
- MPS
Mucopolysaccharidoses
- NBS
Newborn screening
- β-Gal
β-galactosidase
Compliance With Ethical Guidelines
Conflict of Interest
All the authors have contributed to this “Original Article” and have no conflict of interest with any other party.
Tsutomu Shimada, Eriko Yasuda, Robert W. Mason, Jobayer Hossain, William G. Mackenzie, Yuniko Shibata, Seiji Yamaguchi, Yasuyuki Suzuki, Kenji E. Orii, Toshiyuki Fukao, Tadao Orii, Adriana M. Montaño, Francyne Kubaski, Roberto Giugliani, and Shunji Tomatsu declare that they have no conflict of interests.
Informed Consent
The samples were obtained with the informed consent according to IRB approval at each institute.
Animal Rights
Not applicable.
Contributions to the Project
Tsutomu Shimada: He has contributed to the concept of the project, planning, performance of experiments (LC-MS/MS), data analysis, and reporting of the work described in the article.
Shunji Tomatsu: He is a Principal Investigator and is responsible for the entire project. He has contributed to the concept of the project, planning, analysis of data, and reporting of the work described in the article. He organized and communicated the entire team for this project
Robert W. Mason: He has contributed to the planning, performance of LC-MS/MS, data analysis, and reporting of the work described in the article.
Eriko Yasuda: She has contributed to collecting samples, data analysis, and reporting of the work described in the article.
Jobayer Hossain: He contributed to data analysis and statistics and reporting of the work described in the article.
William G. Mackenzie: He has contributed to collecting samples, data analysis, and reporting of the work described in the article.
Yuniko Shibata: She has contributed to data analysis and reporting of the work described in the article.
Adriana M. Montaño: She has contributed to data analysis and reporting of the work described in the article.
Francyne Kubaski: She has contributed to collecting samples, data analysis, and reporting of the work described in the article.
Roberto Giugliani: He has contributed to collecting samples, data analysis, and reporting of the work described in the article.
Seiji Yamaguchi: He has contributed to collecting samples, data analysis, and reporting of the work described in the article. He and his team at Shimane University worked with Dr. Tomatsu.
Yasuyuki Suzuki: He has contributed to collecting samples, data analysis, and reporting of the work described in the article.
Kenji E. Orii: He has contributed to collecting samples, data analysis, and reporting of the work described in the article.
Toshiyuki Fukao: He has contributed to collecting samples, data analysis, and reporting of the work described in the article. He and his team at Gifu University worked with Dr. Tomatsu.
Tadao Orii: He has contributed to collecting samples, data analysis, and reporting of the work described in the article.
Highlights
Sulfation level of KS varies with age and species.
Importance of level of di-sulfated KS and ratio of KS sulfation.
Di-sulfated KS can be used as a biomarker for several types of MPS.
Level of blood KS is age dependent and species dependent.
The reader will understand the importance of a new biomarker for MPS II, IVA, and IVB.
Footnotes
Competing interests: None declared
The authors wish it to be known that, in their opinion, the first two authors should be regarded as joint First Authors.
Contributor Information
Shunji Tomatsu, Email: stomatsu@nemours.org.
Collaborators: Johannes Zschocke
References
- Bhavanandan VP, Meyer K. Studies on keratosulfates. Methylation, desulfation, and acid hydrolysis studies on old human rib cartilage keratosulfate. J Biol Chem. 1968;243:1052–1059. [PubMed] [Google Scholar]
- Brown GM, Huckerby TN, Bayliss MT, Nieduszynski IA. Human aggrecan keratan sulfate undergoes structural changes during adolescent development. J Biol Chem. 1998;273:26408–26414. doi: 10.1074/jbc.273.41.26408. [DOI] [PubMed] [Google Scholar]
- Chakravarti S, Magnuson T, Lass JH, Jepsen KJ, LaMantia C, Carroll H. Lumican regulates collagen fibril assembly: skin fragility and corneal opacity in the absence of lumican. J Cell Biol. 1998;141:1277–1286. doi: 10.1083/jcb.141.5.1277. [DOI] [PMC free article] [PubMed] [Google Scholar]
- Chinen Y, Higa T, Tomatsu S, Suzuki Y, Orii T, Hyakuna N. Long-term therapeutic efficacy of allogenic bone marrow transplantation in a patient with mucopolysaccharidosis IVA. Mol Genet Metab Rep. 2014;1:31–41. doi: 10.1016/j.ymgmr.2013.11.002. [DOI] [PMC free article] [PubMed] [Google Scholar]
- Dingle JT, Horsfield P, Fell HB, Barratt ME. Breakdown of proteoglycan and collagen induced in pig articular cartilage in organ culture. Ann Rheum Dis. 1975;34:303–311. doi: 10.1136/ard.34.4.303. [DOI] [PMC free article] [PubMed] [Google Scholar]
- Dũng VC, Tomatsu S, Montaño AM, et al. Mucopolysaccharidosis IVA: correlation between genotype, phenotype and keratan sulfate levels. Mol Genet Metab. 2013;110:129–138. doi: 10.1016/j.ymgme.2013.06.008. [DOI] [PMC free article] [PubMed] [Google Scholar]
- Funderburgh JL. Keratan sulfate: structure, biosynthesis, and function. Glycobiology. 2000;10:951–958. doi: 10.1093/glycob/10.10.951. [DOI] [PubMed] [Google Scholar]
- Funderburgh JL, Mitschler RR, Funderburgh ML, Roth MR, Chapes SK, Conrad GW. Macrophage receptors for lumican. A corneal keratan sulfate proteoglycan. Invest Ophthalmol Vis Sci. 1997;38:1159–1167. [PubMed] [Google Scholar]
- Graham RA, Li TC, Cooke ID, Aplin JD. Keratan sulphate as a secretory product of human endometrium: cyclic expression in normal women. Hum Reprod. 1994;9:926–930. doi: 10.1093/oxfordjournals.humrep.a138618. [DOI] [PubMed] [Google Scholar]
- Harmatz P, Mengel KE, Giugliani R, et al. The Morquio A Clinical Assessment Program: baseline results illustrating progressive, multisystemic clinical impairments in Morquio A subjects. Mol Genet Metab. 2013;109:54–61. doi: 10.1016/j.ymgme.2013.01.021. [DOI] [PubMed] [Google Scholar]
- Hendriksz CJ, Harmatz P, Beck M, et al. Review of clinical presentation and diagnosis of mucopolysaccharidosis IVA. Mol Genet Metab. 2013;110:54–64. doi: 10.1016/j.ymgme.2013.04.002. [DOI] [PMC free article] [PubMed] [Google Scholar]
- Hintze JP, Tomatsu S, Fujii T, et al. Comparison of liquid chromatography-tandem mass spectrometry and sandwich ELISA for determination of keratan sulfate in plasma and urine. Biomark Insights. 2011;6:69–78. doi: 10.4137/BMI.S7451. [DOI] [PMC free article] [PubMed] [Google Scholar]
- Imagama S, Sakamoto K, Tauchi R, et al. Keratan sulfate restricts neural plasticity after spinal cord injury. J Neurosci. 2011;31:17091–17102. doi: 10.1523/JNEUROSCI.5120-10.2011. [DOI] [PMC free article] [PubMed] [Google Scholar]
- Lauder RM, Huckerby TN, Nieduszynski IA. The structure of the keratan sulphate chains attached to fibromodulin from human articular cartilage. Glycoconj J. 1997;14:651–660. doi: 10.1023/A:1018552913584. [DOI] [PubMed] [Google Scholar]
- Liles M, Palka BP, Harris A, et al. Differential relative sulfation of Keratan sulfate glycosaminoglycan in the chick cornea during embryonic development. Invest Ophthalmol Vis Sci. 2010;51:1365–1372. doi: 10.1167/iovs.09-4004. [DOI] [PubMed] [Google Scholar]
- Martell LA, Cunico RL, Ohh J, Fulkerson W, Furneaux R, Foehr ED. Validation of an LC-MS/MS assay for detecting relevant disaccharides from keratan sulfate as a biomarker for Morquio A syndrome. Bioanalysis. 2011;3:1855–1866. doi: 10.4155/bio.11.172. [DOI] [PubMed] [Google Scholar]
- Möllmann C, Lampe CG, Müller-Forell W, et al. Development of a Scoring System to Evaluate the Severity of Craniocervical Spinal Cord Compression in Patients with Mucopolysaccharidosis IVA (Morquio A Syndrome) JIMD Rep. 2013;11:65–72. doi: 10.1007/8904_2013_223. [DOI] [PMC free article] [PubMed] [Google Scholar]
- Montaño AM, Tomatsu S, Gottesman GS, Smith M, Orii T. International Morquio A Registry: clinical manifestation and natural course of Morquio A disease. J Inherit Metab Dis. 2007;30:165–174. doi: 10.1007/s10545-007-0529-7. [DOI] [PubMed] [Google Scholar]
- Montaño AM, Tomatsu S, Brusius A, Smith M, Orii T. Growth charts for patients affected with Morquio A disease. A J Med Genet A. 2008;146A:1286–1295. doi: 10.1002/ajmg.a.32281. [DOI] [PubMed] [Google Scholar]
- Nieduszynski IA, Huckerby TN, Dickenson JM, et al. There are two major types of skeletal keratan sulphates. Biochem J. 1990;271:243–245. doi: 10.1042/bj2710243. [DOI] [PMC free article] [PubMed] [Google Scholar]
- Northover H, Cowie RA, Wraith JE. Mucopolysaccharidosis type IVA (Morquio syndrome): a clinical review. J Inherit Metab Dis. 1996;19:357–365. doi: 10.1007/BF01799267. [DOI] [PubMed] [Google Scholar]
- Oguma T, Tomatsu S, Montano AM, Okazaki O. Analytical method for the determination of disaccharides derived from keratan, heparan, and dermatan sulfates in human serum and plasma by high-performance liquid chromatography/turbo ionspray ionization tandem mass spectrometry. Anal Biochem. 2007;368:79–86. doi: 10.1016/j.ab.2007.05.016. [DOI] [PubMed] [Google Scholar]
- Oguma T, Tomatsu S, Okazaki O. Analytical method for determination of disaccharides derived from keratan sulfates in human serum and plasma by high-performance liquid chromatography/turbo-ionspray ionization tandem mass spectrometry. Biomed Chromatogr. 2007;21:356–362. doi: 10.1002/bmc.760. [DOI] [PubMed] [Google Scholar]
- Ratcliffe A, Doherty M, Maini RN, Hardingham TE. Increased concentrations of proteoglycan components in the synovial fluids of patients with acute but not chronic joint disease. Ann Rheum Dis. 1988;47:826–832. doi: 10.1136/ard.47.10.826. [DOI] [PMC free article] [PubMed] [Google Scholar]
- Rowan DJ, Tomatsu S, Grubb JH, Montaño AM, Sly WS. Assessment of bone dysplasia by micro-CT and glycosaminoglycan levels in mouse models for mucopolysaccharidosis type I, IIIA, IVA, and VII. J Inherit Metab Dis. 2013;36:235–246. doi: 10.1007/s10545-012-9522-x. [DOI] [PMC free article] [PubMed] [Google Scholar]
- Rozdzynska A, Tylki-Szymanska A, Jurecka A, Cieslik J. Growth pattern and growth prediction of body height in children with mucopolysaccharidosis type II. Acta Paediatr. 2011;100:456–460. doi: 10.1111/j.1651-2227.2010.02060.x. [DOI] [PubMed] [Google Scholar]
- Suzuki Y, Oshima A, Namba E. β-Galactosidase deficiency (β-galactosidosis) GM1 gangliosidosis and Morquio B disease. In: Scriver CR, Beaudet AL, Sly WS, Valle D, editors. The metabolic and molecular bases of inherited disease. New York: McGraw-Hill; 2001. pp. 3775–3809. [Google Scholar]
- Tai GH, Huckerby TN, Nieduszynski IA. 600 MHz 1H NMR study of a fucose-containing heptasaccharide derived from a keratanase digestion of bovine articular cartilage keratan sulphate. Carbohydr Res. 1994;255:303–309. doi: 10.1016/S0008-6215(00)90987-X. [DOI] [PubMed] [Google Scholar]
- Tomatsu S, Okamura K, Maeda H, et al. Keratan sulphate levels in mucopolysaccharidoses and mucolipidoses. J Inherit Metab Dis. 2005;28:187–202. doi: 10.1007/s10545-005-5673-3. [DOI] [PubMed] [Google Scholar]
- Tomatsu S, Montaño AM, Ohashi A, et al. Enzyme replacement therapy in a murine model of Morquio A syndrome. Hum Mol Genet. 2008;17:815–824. doi: 10.1093/hmg/ddm353. [DOI] [PubMed] [Google Scholar]
- Tomatsu S, Montaño AM, Oguma T, et al. Validation of disaccharide compositions derived from dermatan sulfate and heparan sulfate in mucopolysaccharidoses and mucolipidoses II and III by tandem mass spectrometry. Mol Genet Metab. 2010;99:124–131. doi: 10.1016/j.ymgme.2009.10.001. [DOI] [PubMed] [Google Scholar]
- Tomatsu S, Montaño AM, Oguma T, et al. Dermatan sulfate and heparan sulfate as a biomarker for mucopolysaccharidosis I. J Inherit Metab Dis. 2010;33:141–150. doi: 10.1007/s10545-009-9036-3. [DOI] [PubMed] [Google Scholar]
- Tomatsu S, Montaño AM, Oguma T, et al. Validation of keratan sulfate level in mucopolysaccharidosis type IVA by liquid chromatography-tandem mass spectrometry. J Inherit Metab Dis. 2010;33:S35–S42. doi: 10.1007/s10545-009-9013-x. [DOI] [PubMed] [Google Scholar]
- Tomatsu S, Montaño AM, Oikawa H, et al. Mucopolysaccharidosis type IVA (Morquio A disease): clinical review and current treatment. Curr Pharm Biotechnol. 2011;12:931–945. doi: 10.2174/138920111795542615. [DOI] [PubMed] [Google Scholar]
- Tomatsu S, Mackenzie WG, Theroux MC, et al. Current and emerging treatments and surgical interventions for Morquio A Syndrome: A review. Res Rep End Dis. 2012;2:65–77. doi: 10.2147/RRED.S37278. [DOI] [PMC free article] [PubMed] [Google Scholar]
- Tomatsu S, Montaño AM, Oikawa H et al (2012b) Impairment of Body Growth in Mucopolysaccharidoses, in: V.R. Preedy (Ed.), Handbook of Growth and growth monitoring in health and disease© Springer science + Businessmedia, LLC, 2091–2116.
- Tomatsu S, Fujii T, Fukushi M, et al. Newborn screening and diagnosis of mucopolysaccharidoses. Mol Genet Metab. 2013;110:42–53. doi: 10.1016/j.ymgme.2013.06.007. [DOI] [PMC free article] [PubMed] [Google Scholar]
- Tomatsu S, Alméciga-Díaz CJ, Barbosa H, et al. Therapies of Mucopolysaccharidosis IVA (Morquio A Syndrome) Expert Opin Orphan Drugs. 2013;1:805–818. doi: 10.1517/21678707.2013.846853. [DOI] [PMC free article] [PubMed] [Google Scholar]
- Tomatsu S, Shimada T, Mason RW et al (2014) Assay for glycosaminoglycans by tandem mass spectrometry and its applications. J Anal Bioanal Tech S2:006. doi:10.4172/2155-9872.S2-006 [DOI] [PMC free article] [PubMed]
- Weyers A, Yang B, Solakyildirim K, et al. Isolation of bovine corneal keratan sulfate and its growth factor and morphogen binding. FEBS J. 2013;280:2285–2293. doi: 10.1111/febs.12165. [DOI] [PMC free article] [PubMed] [Google Scholar]
- Yasuda E, Fushimi K, Suzuki Y, et al. Pathogenesis of Morquio A syndrome: an autopsied case reveals systemic storage disorder. Mol Genet Metab. 2013;109:301–311. doi: 10.1016/j.ymgme.2013.04.009. [DOI] [PubMed] [Google Scholar]
- Zhang Y, Kariya Y, Conrad AH, Tasheva ES, Conrad GW. Analysis of keratan sulfate oligosaccharides by electrospray ionization tandem mass spectrometry. Anal Chem. 2005;77:902–910. doi: 10.1021/ac040074j. [DOI] [PubMed] [Google Scholar]