Abstract
Apurinic/apyrimidinic endonuclease-1/redox effector factor-1 (APE-1) is a critical component of base excision repair that excises abasic lesions created enzymatically by the action of DNA glycosylases on modified bases and non-enzymatically by hydrolytic depurination/depyrimidination of nucleobases. Many anticancer drugs generate DNA adducts that are processed by base excision repair, and tumor resistance is frequently associated with enhanced APE-1 expression. Accordingly, APE-1 is a potential therapeutic target to treat cancer. Using computational approaches and the high resolution structure of APE-1, we developed a 5-point pharmacophore model for APE-1 small molecule inhibitors. One of the nM APE-1 inhibitors (AJAY-4) that was identified based on this model exhibited an overall median growth inhibition (GI50) of 4.19 μM in the NCI-60 cell line panel. The mechanism of action is shown to be related to the buildup of abasic sites that cause PARP activation and PARP cleavage, and the activation of caspase-3 and caspase-7, which is consistent with cell death by apoptosis. In a drug combination growth inhibition screen conducted in 10 randomly selected NCI-60 cell lines and with 20 clinically used non-genotoxic anticancer drugs, a synergy was flagged in the SK-MEL-5 melanoma cell line exposed to combinations of vemurafenib, which targets melanoma cells with V600E mutated BRAF, and AJAY-4, our most potent APE-1 inhibitor. The synergy between AJAY-4 and vemurafenib was not observed in cell lines expressing wild-type B-Raf protein. This synergistic combination may provide a solution to the resistance that develops in tumors treated with B-Raf-targeting drugs.
Electronic supplementary material
The online version of this article (doi:10.1007/s12154-015-0131-7) contains supplementary material, which is available to authorized users.
Keywords: AP endonuclease, Abasic sites, DNA repair, Drug synergy, Toxicity
Introduction
Apurinic/apyrimidinic endonuclease-1/redox effector factor-1 (APE-1; aka, APE1/Ref-1) is the mammalian enzyme that is involved in the repair of abasic sites generated spontaneously by depurination/depyrimidination and by DNA glycosylase excision of some alkylated, oxidized, and deaminated DNA bases [1–5]. It is estimated that more than 4 × 10⁴ abasic sites form per cell per day via these enzymatic and non-enzymatic reactions [6, 7]. Accordingly, the deletion of this enzyme is not compatible with life in mammals or mammalian cells [8–10]. The exposure of cells to many of the DNA alkylating drugs used in cancer chemotherapy causes a significant increase in abasic sites. Moreover, increased expression of APE-1 is observed in a significant number of drug-resistant tumors [5, 11–17]. Therefore, the development of APE-1 inhibitors that could act in combination with anticancer drugs that directly, or indirectly, produce DNA damage is a potential approach to address the problem of drug resistance [18–29].
Based on molecular modeling and using a molecular beacon screen, we previously reported the identification and characterization of APE-1 inhibitors with Ki of <150 nM in an in vitro enzymatic assay. The compounds that were potent inhibitors of APE-1 activity showed growth inhibition (GI)50 of <1 μM in T98G human glioma cells [26].
In the current work, we have expanded our understanding on the required interactions of small molecule inhibitors with APE-1 using molecular dynamics (MD) simulations and have developed a 5-point pharmacophore model. In addition, we have analyzed the activity of the most active APE-1 inhibitor in the NCI-60 cell lines as a single agent, and in a drug combination pilot screen of 20 randomly selected FDA-approved anticancer agents conducted in a subset of 10 of the NCI-60 cell lines. The mechanism of cell death due to APE-1 inhibition is shown to involve caspase-mediated apoptosis that correlates with the buildup of abasic sites. Of note is that a novel synergistic effect on cell death was observed in cell lines harboring a V600E BRAF mutation when the APE-1 inhibitor was combined with vemurafenib, a selective inhibitor of BRAFV600E kinase activity [30].
Results and discussion
Molecular modeling of interactions between APE-1 and DNA and generation of a 5-point pharmacophore model
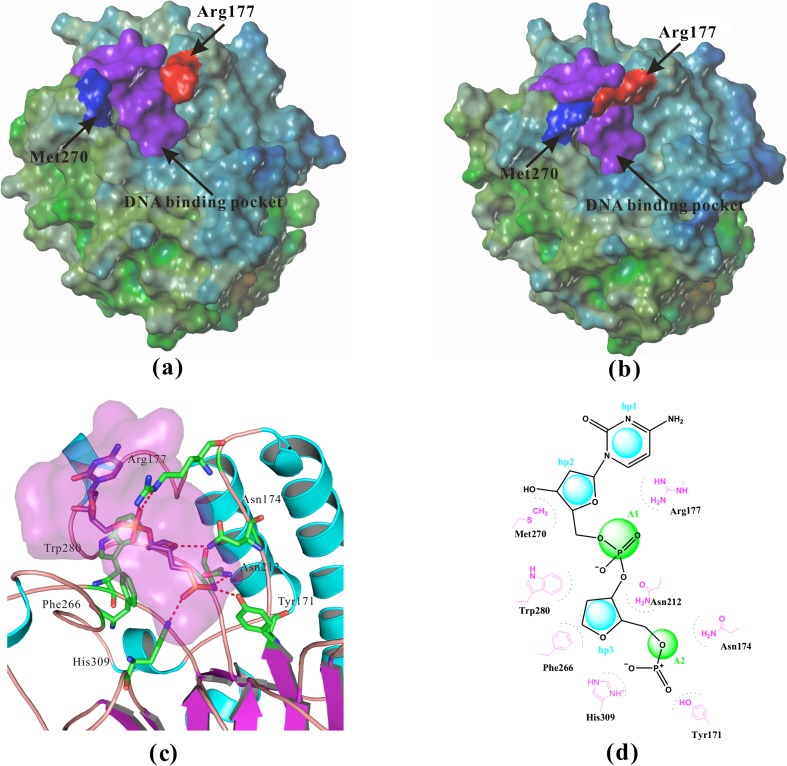
APE-1 uses a well-defined positively charged surface to selectively recognize the DNA region with the flipped-out abasic residue that interacts with a pocket near the bottom of the DNA binding region of APE-1. These interactions are shown in Fig. 1a, b, including the surface of apo-APE-1 (PDB/1BIX) [31] and the surface of APE-1 bound with DNA (PDB/1DEW) [32]. Figure 1c, d show the interactions between APE-1 and a tetrahydrofuran (THF) abasic site fragment. Several important residues including Asn174, Asn212, and His309 form ionic or H-bonding interactions with the negatively charged 5'-phosphate adjacent to the abasic site [23]. A hydrophobic pocket surrounded by residues Phe266, Trp280, and Leu282 (not show in Fig. 1c) selectively recognizes and binds to the abasic deoxyribose sugar moiety. Moreover, Met270 and Met271 (not shown) form hydrophobic interactions with the deoxyribose sugar moiety that is connected to the 3'-phosphate. A critical interaction of Arg177 can be observed with its insertion into the major groove in the void created by the displaced abasic site and its interaction with the negatively charged 3'-phosphate of the abasic fragment (Fig. 1d). Finally, Arg177 also forms hydrophobic interactions with the flanking cytosine (PDB/1DEW) or guanine (PDB/1DE9) residues (Fig. 1d) [32].
Fig. 1.
Structural details of APE-1. a The surface of crystal structure of apo-APE-1 (PDB/1BIX) [31], Arg177 was far away from Met270, so the potential binding pocket was open. b The surface of crystal structure of APE-1 bound with DNA (PDB/1DEW) [32], Arg177 and Met270 covered the potential binding pocket. c The interactions between APE-1 and abasic site fragment in the crystal structure of APE-1 bound with DNA (PDB/1DEW), several important residues including Tyr171, Asn174, Asn212, and His309 form strong ionic or H-bonding interactions with the negatively charged 5'-phosphate, a hydrophobic pocket surrounded by residues Phe266, Met270, Trp280, and Leu282. d Two-dimensional pharmacophore model hp3A2 with three hydrophobic or hydrophobic aromatic centers (hp) and two H-bond acceptors (A) was generated to represent APE-1 interactions with abasic DNA (PDB/1DEW). Distance restrictions of this pharmacophore model were listed in Table 1
Given the importance and uniqueness of these interactions for APE-1 recognition and incision of abasic DNA sites, we designed a 3D-pharmacophore model using the abasic fragment with a 3’-flanking cytosine as the template (Fig. 1d). In the model, we defined three hydrophobic/aromatic centers (hp) and two H-bond acceptors (A). The distance restrictions in the pharmacophore model are shown in Table 1. For filtering the database, we required at least a 4-point pharmacophore match allowing omission of either hp1 or hp2 interactions, i.e., A1-A2-hp3-hp1, A1-A2-hp3-hp2, or A1-A2-hp3-hp1-hp2. This model was then used to identify novel molecules bearing the desired chemical moieties that mimic abasic DNA binding to APE-1. After pharmacophoric filtering, an original set of 210,000 NCI compounds was narrowed down to 10,159.
Table 1.
Distance restrictions of pharmacophore model presented in our work
| H1-H2 Distance 1a |
H2-H3 Distance 2 |
H3-A2 Distance 3 |
A2-A1 Distance 4 |
A1-H1 Distance 5 |
|---|---|---|---|---|
| 4.195 | 6.762 | 5.639 | 6.764 | 3.168 |
A hydrogen bond acceptor, H hydrophobic or hydrophobic aromatic center
aThe distances were depicted in angstrom with an error range of ±1 Å
A virtual docking screen was carried out on the optimized 3D chemical compound library of 10,159 compounds. From the screen, 30 compounds were identified: 10 compounds (AJAY 1-7, -15, -19, and -20, Table 1S) were selected based on the quality of their virtual docking, and the remaining 20 compounds were selected as negative controls because they did not meet our pharmacophore model requirements. These 30 compounds were then screened for their in vitro inhibition of APE-1 activity [26]. Sixteen of the 20 compounds that did not agree with our pharmacophore model were inactive with IC50 > 30 μM in the APE-1 endonuclease assay. The remaining four that were predicted to be inactive showed IC50 values ranging from 7 to 37 μM. In contrast, of the compounds selected from the virtual docking screen using our pharmacophore model, six displayed IC50 values <0.7 μM, three had IC50 < 20 μM, and one (AJAY-8) was inactive (IC50 > 100 μM). Table 2 lists the Ki information for the four best inhibitor compounds identified from the in silico screen. The APE-1 endonuclease activities of these compounds ranged from 0.12 to 0.22 μM, and all of the active molecules contained a core 2-methyl-4-amino-6,7-dioxoloquinoline structure. The compound with the best total Hammerhead score was chosen for further biochemical and cellular studies described below [26].
Table 2.
Novel APE-1 inhibitors identified from in silico screen and their Ki
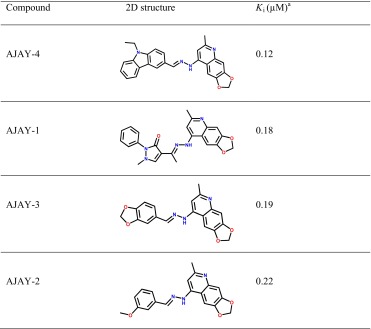
aEndonuclease activity
Docking studies of APE-1 inhibitors
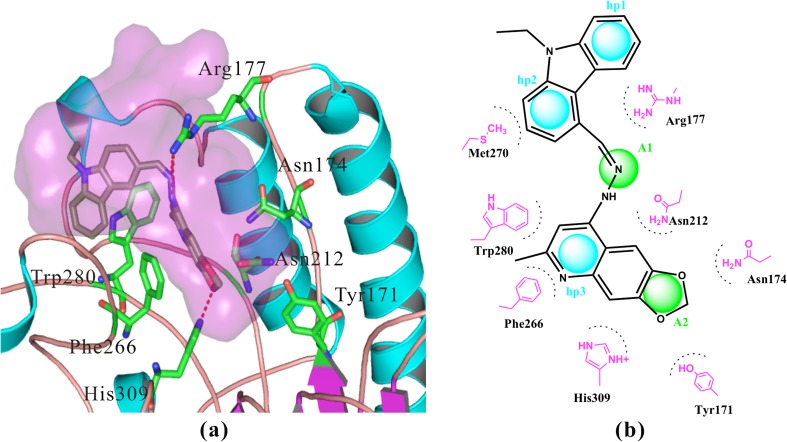
We docked the four most active APE-1 inhibitors (AJAY 1–4, Table 2) with APE-1, and found that the compounds shared similar interactions as illustrated for AJAY-4 shown in Fig. 2 and Fig. 2S. All four compounds formed an H-bond with His309: the H-bond distance was 1.97, 1.89, 2.19, and 3.44 Å, respectively. His309 acts as the general base and abstracts a proton from a water molecule to generate the active site nucleophile required for the base excision reaction [33]. Our analysis showed that AJAY-1 also can form a weak H-bond with Asn174 (4.10 Å). All four APE-1 inhibitors are capable of forming strong π-π interactions with Phe266 (Fig. 2 and 2S). They also provided strong hydrophobic interactions with Trp280 and Leu282 (not show in Fig. 2). The distances of π-π interaction between AJAY 1–4 and Phe266 are 3.32, 2.93, 2.91, and 3.29 Å, respectively. The compounds also adopted strong hydrophobic interactions with Trp280 and Leu282 (not show in Fig. 2). The distances of hydrophobic interaction with Trp280 were all less than 2.88 Å. The docking results also showed that the four inhibitors can form strong H-bonds with Arg177: the distances for AJAY 1–4 were 2.12, 3.01, 2.25, and 2.41 Å, respectively.
Fig. 2.
a Detailed interactions between APE-1 and AJAY-4, IC50 0.12 μM. b The pharmacophore model of AJAY-4. His309 and Arg177 formed strong hydrogen bonds with all our four compounds. Tyr171, Asn174, and Asn212 formed weak hydrophilic interactions with these compounds. Phe266 formed strong π-π interaction with all compounds. Trp280 mainly formed hydrophobic interactions with our inhibitors. Detailed interactions of our other compounds can be found in Fig. 2S
In comparison to previously reported inhibitors [22, 23, 34, 35], the four compounds shared similar interactions with APE-1: one hydrophobic core and two charged or negative features. The main difference is that our inhibitors formed very strong π-π interaction with Phe266, which is buried deep in the cleft that receives the abasic site. In addition, we found that two of our compounds, AJAY-3 and AJAY-1, formed strong hydrophobic interactions (within 2.8 Å) with Arg177. Finally, AJAY-2 and AJAY-4 formed strong hydrophobic interactions with Met270 and Trp280, respectively. Our compounds, which are derived from a 5-point pharmacophore model and are more potent (lower IC50 values), introduce more hydrophobic (π-π) interactions with residues of APE-1 (i.e., Phe266, Arg177, Met270, and Trp280) than previously reported inhibitors.
In contrast, none of the inactive compounds formed H-bonds with His309; the nearest distances between atoms of the inactive compounds and His309 were large (>6.7 Å). We suggest that the inactive compounds may not produce hydrophobic interactions with His309, which corresponds to lacking the hydrophilic acceptor 2 (A2) feature in the pharmacophore model. Therefore, we propose that the hydrophilic acceptor 2 (A2) is an essential feature for inhibition, and MD simulations were performed to validate this hypothesis (see below).
Recognition role of Arg177 for APE-1 inhibition
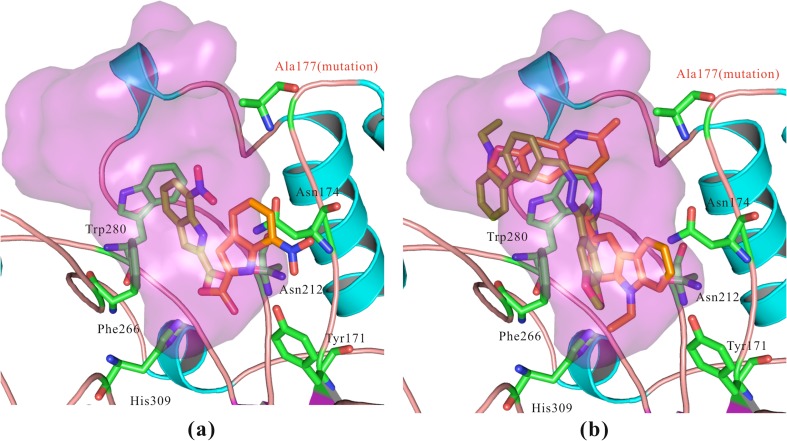
Arg177 penetrates into the major groove of DNA where there is a void created by the flipping of the AP site into the core of APE-1. This Arg makes an electrostatic contact with the phosphate that is 3’ of the AP site [32, 36–38]. As a result, this interaction slows APE-1 dissociation from the cleaved DNA intermediate after the catalytic step. Accordingly, an Arg177Ala substitution enhances AP endonuclease activity [32]. In the present in silico experiments, we generated the Arg177Ala mutation using PyMol software. We then docked active compounds into the mutated APE-1 with SYBYL software, including compounds 6-hydroxy-DL-DOPA [22] and AJAY-4 (Fig. 3). The two inhibitors were docked with the Arg177Ala mutation (orange) and compared to the pose in the WT protein (pale-green). All of the inhibitors underwent large conformational changes when interacting with Arg177Ala-mutated APE-1. Alternatively, these compounds interacted with the polar groups of either Tyr171, Asn174, or Ala230 (not show in Fig. 3). In the Arg177Ala-mutated APE-1, the “bridge” (Fig. 1b) formed by Arg177 and Met270, which act as the “gate” of the binding pocket, no longer exists. Arg177 has been reported to play a role in moderating the catalytic activity of APE-133 and based on our docking results, we suggest that Arg177 may also play an important role in the recognition of inhibitors.
Fig. 3.
Docking studies between APE-1 and active compounds with Arg177Ala mutation. a Compound 6-hydroxy-DL-DOPA, IC50 0.11 μM [22]. b AJAY-4, IC50 0.12 µM. Both the previously reported inhibitor and our inhibitor induced large conformational changes when interacting with Arg177Ala mutated. We suggest that Arg177 plays an important role for the recognition of the inhibitors. The conformations of compounds highlighted in pale-green were after Arg177Ala mutation, while the conformations highlighted in orange were before mutation
MD simulations for active and inactive compounds
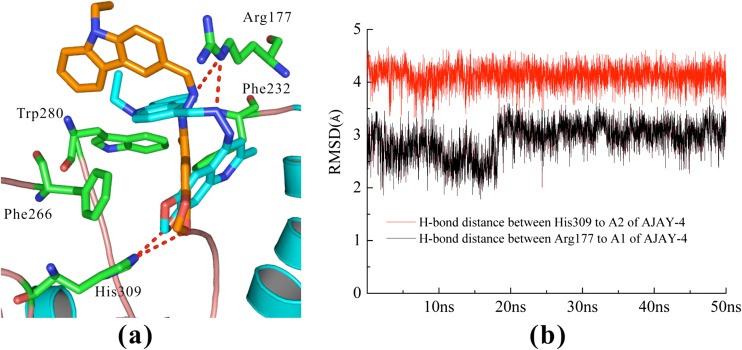
In order to validate the predictions of the involvement of the proposed residues on inhibitor-protein interactions, we performed 50 ns MD simulations for APE-1 with both active (AJAY-4) and inactive (AJAY-15) compounds (Figs. 4 and 3S, respectively). The deviations of AJAY-4 (active) and AJAY-15 (inactive) were large (5.2 and 6.3 Å, respectively). We believe that the binding pocket of APE-1 is sufficiently large to allow the compounds to move within the pocket. However, the binding pose of AJAY-4 was more stable. The root mean square deviation (RMSD) of APE-1 bound with AJAY-4 or AJAY-15 were 2.41 or 1.88 Å, respectively, during the MD simulations. However, the important interactions between the active AJAY-4 and APE-1 (see Fig. 4) behaved very differently from that of the inactive AJAY-15 (see Fig. 3S). The H-bond distance between the hydrazone N (A1) of AJAY-4 and Arg177 of APE-1 remained within 3 Å. The distance between the oxygen of the methylenedioxy group (A2) and His309 remained within 4.3 Å during 50 ns MD simulation (Fig. 4b). The hydrophobic interactions between AJAY-4 and the hydrophobic region (Phe266, Trp280, and Leu282) were also stable during the simulation: ~4 Å. Interestingly, our MD simulation results show that another residue (Phe232) in APE-1 is capable of strong π-π interaction with AJAY-4 (Fig. 4) after the MD simulation. This interaction with the protein is not observed in the crystal structure with the natural abasic site (PDB/1DEW) [32].
Fig. 4.
MD simulations results for AJAY-4. a The alignments of AJAY-4 between before MD (orange) and after MD (blue). b The distances between AJAY-4 and APE-1, the H-bond distances between active compound AJAY-4 and Arg177/His309 remained stable. We also performed the MD simulations for inhibitor AJAY-15, as shown in Fig. 3S. However, the distances between inactive compound AJAY-15 and Arg177/His309 fluctuated greatly. More detail can be found in Fig. 3S. We suggest that Arg177 and His309 play key roles in the recognitions of inhibitors
In contrast, our modeling results demonstrated that the interactions between the inactive compound AJAY-15 and APE-1 were not stable and the distances became larger during the MD simulation, gradually extending to 20 Å (Fig. 3S). Moreover, the distance between AJAY-15 and His309 was >10 Å (Fig. 3S), while the original distance between AJAY-15 and His309 was 6.7 Å. Also, the hydrophobic interactions between AJAY-15 and the hydrophobic region of APE-1 (Phe266, Trp280, and Leu282) were unstable, with distances >5.2 Å. The results of our MD simulation further validate our docking results and our proposed model of the critical binding interactions for APE-1 inhibition.
Growth inhibition studies in the NCI-60 cell lines
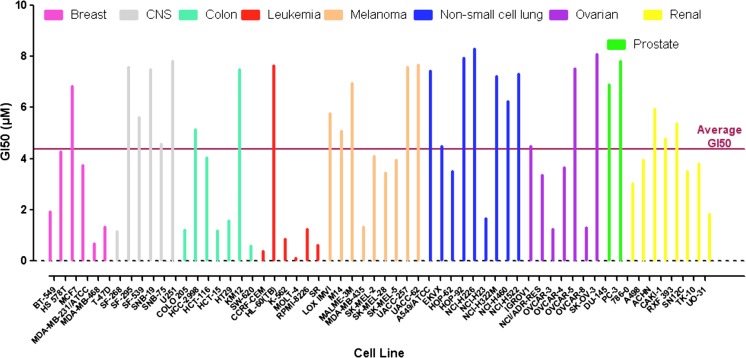
We have previously evaluated the growth inhibition activities of some of our APE-1 inhibitors in the T98G glioma cell line [26]. There is a good correlation between APE-1 endonuclease inhibition and in vitro cytotoxicity: AJAY-4 has a median growth inhibition (GI50) of 190 nM in a clonogenic assay, and it has a Ki of 120 nM for APE-1 endonuclease activity. To determine whether AJAY-4 exhibited any selectivity for specific tumor cell types, we analyzed the GI induced in the NCI panel of 60 cell lines [39] (Fig. 5). The average GI50 in all 60 lines was 4.4 ± 2.6 μM. In four of the six leukemia cell lines included in the panel, the GI50 were in the nanomolar range with an overall average of 1.8 ± 2.9 μM. However, if the HL-60 line is omitted, the GI50 drops to 640 ± 400 nM, with the MOLT-4 line having a GI50 of 133 nM. In only two of the remaining 54 non-leukemia NCI 60 cell lines was the GI50 < 1 μM. The origin of this selectivity for leukemia cells is unclear; the level of APE-1 expression in the different cells is unknown, and the genetic mutations present in the sensitive and insensitive lines do not provide any insight [40, 41].
Fig. 5.
Growth inhibition by the APE-1 inhibitor AJAY-4 in the NCI 60 cell lines. Cells from each of the NCI 60 cell lines were harvested, counted, and seeded into the wells of T0 and T72 384-well assay plates at seeding densities that allowed for continuous proliferation throughout 96 h of incubation at 37 °C, 5 % CO2, and 95 % humidity. After 24 h in culture, Cell Titer Glo detection reagent was added to the wells of the T0 assay plate and the cellular ATP-dependent luminescent signal was captured on an M5e micotiter plate reader. Also, after 24 h, ALAY-4 that had been serially diluted in tissue culture medium to provide a 5-point 10-fold dilution series starting at maximum concentration of 10 μM (final in well) was transferred into the wells of the T72 assay plate that was then returned to the incubator. After an additional 72 h of incubation, Cell Titer Glo detection reagent was added to the wells; the T72 assay plate and the cellular ATP-dependent luminescent signal was captured on an M5e micotiter plate reader. The percent of growth in the compound-treated wells was normalized relative to the growth observed in the corresponding T0 and T72 assay plate control wells, and the data was fit to curves using the Sigmoidal dose response variable slope equation Y = Bottom + [Top − Bottom]/[1 + 10(LogEC50 − X) × HillSlope] of the GraphPad Prism 5 software. The AJAY-4 concentration that inhibited the growth of each of the 60 cells lines by 50 % (GI50) is presented
Mechanism of cell death due to APE-1 inhibition
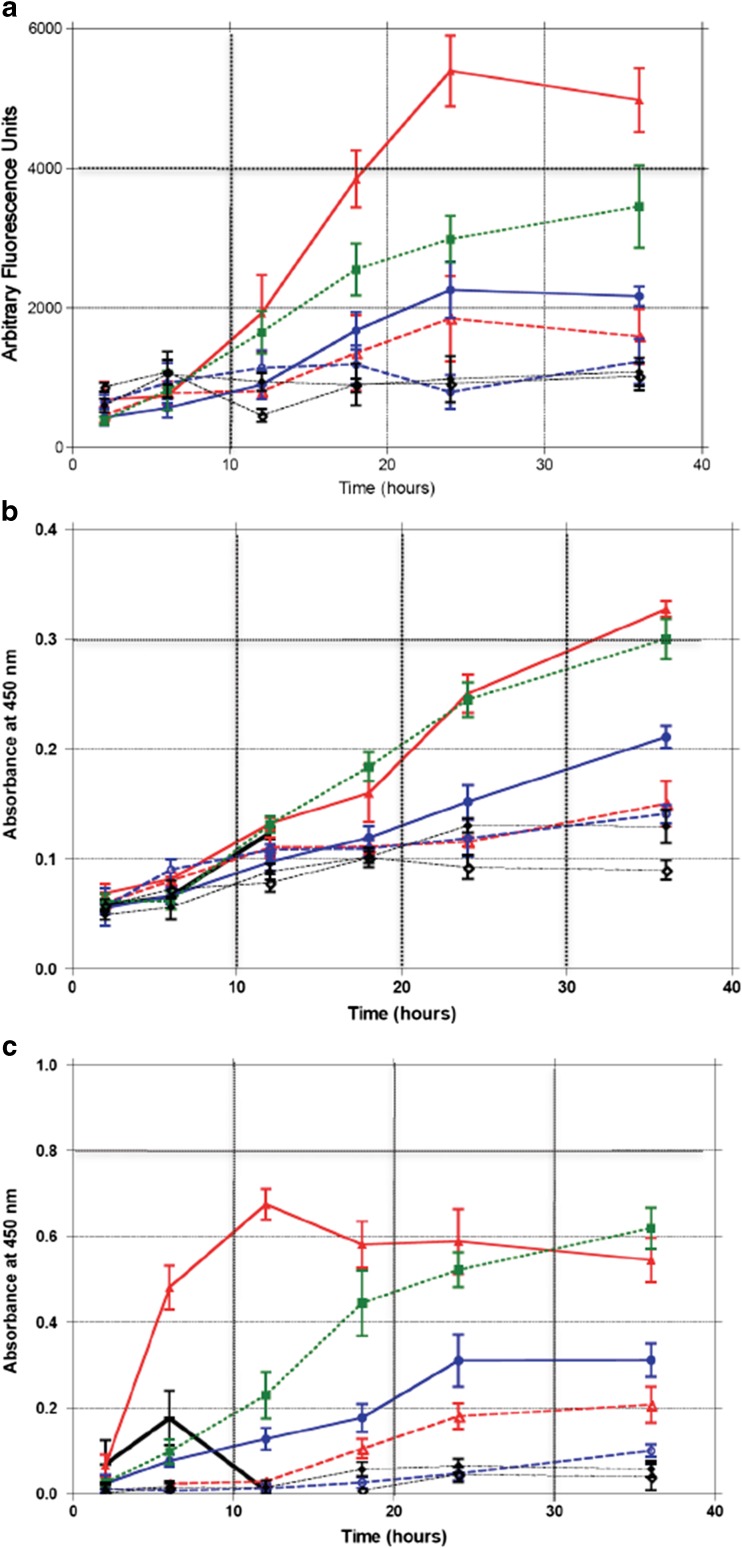
The mechanism of the cytotoxicity due to APE-1 inhibition was evaluated by measuring the induction of caspase-3 and caspase-7 as a function of time after exposure to GI10 (250 nM) and GI50 (960 nM) concentrations of AJAY-4 in the absence or presence of MeLex, a DNA methylating agent that selectively generates N3-methyladenine (3-mA) [42, 43]. The 3-mA lesions are rapidly converted into abasic sites by alkyladenine-DNA glycosylase (AAG). Caspase activation increases throughout the 36 h exposure to 960 nM AJAY-4 (Fig. 6a) indicating that cell death occurs by classical apoptosis in the absence of an exogenous DNA damaging agent. MeLex also induces caspase activation. Of note is that the combination of the GI10 concentrations of MeLex and AJAY-4, which as single agents have little to no effect on caspase activity, produce a robust response that is clearly more than additive. This is consistent with MeLex-producing abasic sites that cannot be repaired due to APE-1 inhibition.
Fig. 6.
Mechanism of cytotoxicity associated with inhibition of APE-1 in T98G cells exposed to various combinations of AJAY-4 and MeLex for 2, 6, 12, 18, 24, and 26 h and assayed for a caspase-3 and caspase-7 activation; b PARP activation; c PARP cleavage: white diamond, untreated; black diamond, 0.2 % DMSO; green square, 80 μM MeLex + 0.25 μM AJAY-4; blue circle, 0.96 μM AJAY-4 (GI50); open circle, 0.25 μM AJAY-4 (LD10); red solid triangle, 250 μM MeLex (LD50); red open triangle, 80 μM MeLex (LD10); black vertical bar, 20 µM etoposide (used in PARP activation and PARP cleavage experiments
Over the same time course, there was a similar response to AJAY-4 without or with MeLex in terms of PARP activity (Fig. 6b) suggesting active DNA damage repair in cells not treated with a DNA methylating agent and that the combination of MeLex and an APE-1 inhibitor act in a synergistic fashion. This is interesting in that PARP activation at single-strand breaks is thought to follow APE-1 excision and backbone cleavage. PARP cleavage also followed the same time course (Fig. 6c), which is consistent with caspase activation and cell death by apoptosis.
Synergy between APE-1 inhibition and approved anticancer drugs
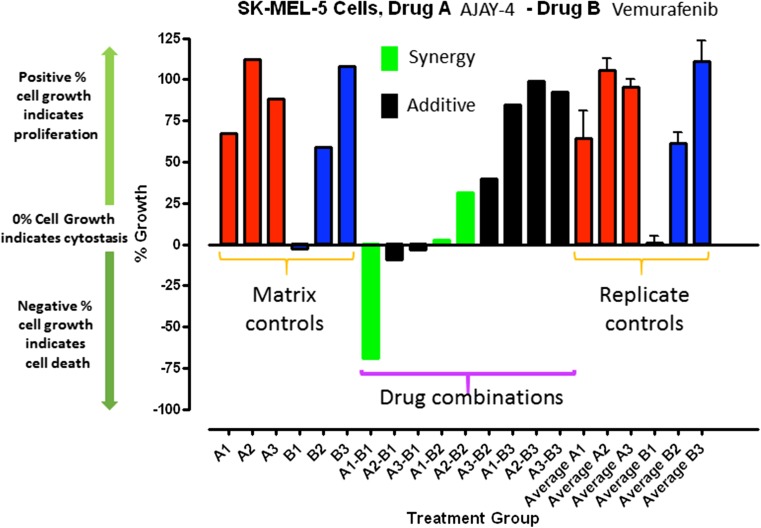
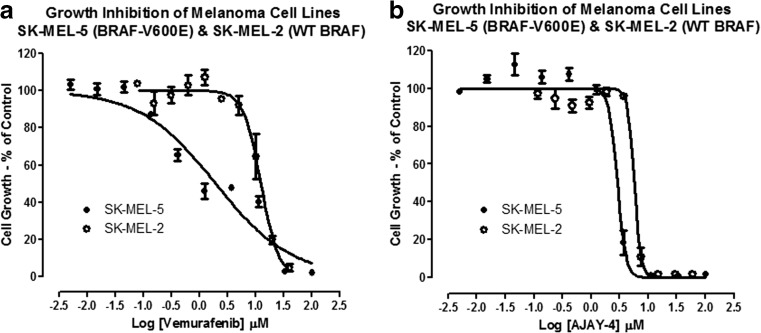
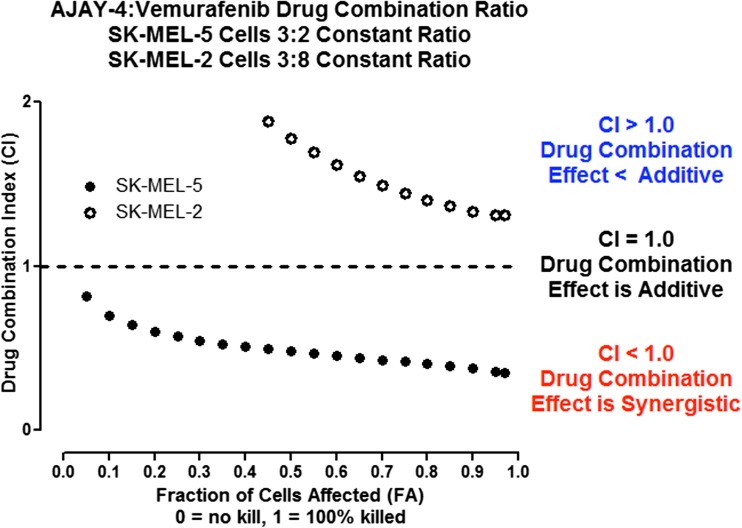
Because resistance to drugs is a critical problem in cancer chemotherapy, the APE-1 inhibitor AJAY-4 was screened in ten randomly selected NCI 60 cell lines in combination with 20 recently approved non-genotoxic anticancer drugs whose mechanisms of action are not associated with direct DNA damage. A synergistic effect on growth inhibition (Fig. 7) was observed with vemurafenib (VMFB), a first-in-class kinase inhibitor selective for BRAF with a V600E mutation in SK-MEL-5 cells, which carry the mutation [30]. In our pilot screen, the combination of AJAY-4 and VMFB was flagged as potentially synergistic in the COLO-205 colon cancer cell line that also carries the V600E mutant B-Raf. Given the initial positive clinical outcome for VMFB in mutant BRAF V600E melanoma patients, we sought to confirm the observed synergism with AJAY-4 flagged in our pilot screen. We also sought to determine whether the BRAF V600E mutation would be required for the apparent synergy of these two molecules. To confirm synergism, we utilized the Chou-Talalay method where the ratio of drug A to drug B is set by their respective growth inhibition 50 concentrations (GI50) values [44]. In agreement with published reports, the GI50 for VMFB in the V600E B-Raf bearing SK-MEL-5 (2.04 ± 0.3 μM) cell line was significantly (>5-fold) lower than in the WT B-Raf SK-MEL-2 (12.44 ± 2.7 μM) cell line (Fig. 8a). The GI50s for AJAY-4 in SK-MEL-5 (2.73 ± 0.82 μM) and SK-MEL-2 (5.64 ± 1.26) were <2-fold different (not significant) from each other (Fig 8b), and were consistent with the GI50 observed in the NCI 60 cell line panel (Fig. 5). In SK-MEL-5 cells bearing the V600E B-Raf mutation, the 3:2 drug combination ratio of AJAY-4/VMFB (selected on the basis of the ratio of their respective individual GI50 values), the corresponding CI values were <1 for all drug combination concentrations tested. This result indicates that the two drugs had a synergistic killing effect in these cells (Fig. 9). In contrast, the 3:8 combination of AJAY-4/VMFB (the closest drug combination ratio in the matrix to the ratio of their respective individual GI50) in SK-MEL-2 cells that are WT for B-Raf, the corresponding CI values for all drug combination concentrations tested were >1. This indicates that the two drugs had an antagonistic (<additive) effect in killing these cells. We have confirmed the apparent synergy between AJAY-4 and VMFB for killing cells bearing the V600E B-Raf mutation in the MALME3M and SK-MEL-28 melanoma cell lines (data not shown) We have also confirmed the lack of synergy between AJAY-4 and VMFB for killing cells in the MCF-7 and MDA-MB-468 breast cancer cell lines that are wild type for B-Raf (data not shown). There is no structural similarity between AJAY-4 and VMFB, and the origin of the synergy in V600E B-Raf-bearing tumor cell lines is obscure, although there are reports that non-genotoxic anticancer compounds such as VMFB can produce DNA damage via the generation of reactive oxygen species (ROS) [45, 46]. The formation of oxidized DNA adducts would result in an increased formation of abasic sites and this is under investigation.
Fig. 7.
Pilot screen-flagged synergy for cytotoxicity of the APE-1 inhibitor in combination with vemurafenib in SK-MEL-5 melanoma cells carrying a V600E mutation in BRAF. In a drug combination matrix screening assay using 10 randomly selected cell lines from the NCI 60 panel, we assayed the effect of APE1 inhibitor AJAY-4 on the growth inhibition responses of 20 recently approved non-genotoxic anticancer drugs. In this pilot screen, an apparent synergistic (>additive) growth inhibition response was identified in the SK-MEL-5 melanoma line for the combination of AJAY-4 with vemurafenib (VMFB). Individual compound controls run in singlet were included in each drug combination matrix and compared to replicate (n = 10) controls for VMFB and AJAY-4. The combination of the two compounds at different concentrations are shown: green (synergistic) means that the combination of compounds enhanced toxicity by at least three standard deviations from the combined mean of the individual compounds1. A1, A2, and A3 = 2, 0.2, and 0.02 μM AJAY-4 and B1, B2, and B3 = 5, 0.5, and 0.05 μM VMFB, respectively. The percent of growth in the compound-treated wells was normalized relative to the growth observed in the corresponding T0 and T72 assay plate control wells that was determined using the Cell Titer Glo cellular ATP detection reagent as described above
Fig. 8.
Individual GI50 determinations for a vemurafenib and b AJAY-4 in the SK-MEL-5 (BRAF-V600E) and SK-MEL-2 (WT BRAF) melanoma cell lines. SK-MEL-5 and SK-MEL-2 cells were exposed to the indicated concentrations of AJAY-4 or VMFB for 72 h and the corresponding Cell Titer Glo (ATP content) signals relative to those of DMSO controls were used to determine their respective GI50s. The percent of growth in the compound-treated wells was normalized relative to the growth observed in the T72 assay plate DMSO control wells and the data was fit to curves using the Sigmoidal dose response variable slope equation Y = Bottom + [Top − Bottom]/[1 + 10(LogEC50 − X) × HillSlope] of the GraphPad Prism 5 software. The mean ± sd (n = 3) growth inhibition data from triplicate wells for each concentration of AJAY-4 are presented as the percent of the DMSO plate controls; SK-MEL-5 (black circle) and SK-MEL-2 (white circle). Representative experimental data from one of three independent experiments are shown
Fig. 9.
Drug combination index analysis for selected vemurafenib and AJAY-4 ratios in the SK-MEL-5 (BRAF-V600E) and SK-MEL-2 (WT BRAF) melanoma cell lines. For drug combination testing, SK-MEL-5 and SK-MEL-2 cells were exposed to the indicated drug combination ratios of AJAY-4 plus VMFB for 72 h, and the corresponding Cell Titer Glo signals relative to those of cells exposed to the individual drugs at the same concentrations were used to determine the fraction of cells affected/killed (Fa) and to calculate a combination index (CI) using the Compusyn software; SK-MEL-5 (black circle) and SK-MEL-2 (white circle). Fa = 1/(1 + (Dm/D)m) where D = dose, D m = median-effect dose, and m = slope, hill-type coefficient, and CI = (D comb)1/(D alone)1 + (D comb)2/(D alone)2; CI = 1 indicates summation, CI > 1 indicates antagonism, and CI < 1 indicates synergism. Representative experimental data from one of three independent experiments are shown
In summary, we have developed a useful pharmacophore model to develop additional APE-1 inhibitors. The potent APE-1 inhibitor compounds have their own biological activity but may be used to potentiate existing anticancer drugs, including drugs that are generally not thought to be genotoxic.
Methods
Prepared proteins
The crystal structures of human apurinic/apyrimidinic endonuclease-1 (APE-1) in the presence of or absence of DNA were used in the present work, including the apo-APE-1 (PDB entry/1BIX, resolution 2.20 Å) [31], APE-1-DNA-Mn2+ complex (PDB entry/1DE9, resolution 3.00 Å) [32], and APE-1 bound to abasic DNA (PDB entry/1DEW, resolution 2.65 Å) [32]. These structures were retrieved from the Protein Data Bank (http://www.pdb.org/pdb/), and then were prepared using SYBYL software (CERTARA, St. Louis, MO) (including residues repair and energy minimization).
Data set
The National Cancer Institute (NCI) database was first filtered in order to eliminate metals, isotopes or mixtures, and molecules with unsuitable molecular weights (lower than 250 or higher than 600). More than 210,000 compounds were used in our study. Special caution was given to the protonation state of ionizable groups (amines, amidines, and carboylic acids) in the ligands that were assumed to be ionized at a physiological pH of 7.4.
Generation of pharmacophore model and pharmacophore filtering
Structural details from observed abasic site fragment-APE-1 complexes are useful to derive pharmacophoric filters. In the present work, we applied the GALAHAD program in the SYBYL software to construct a pharmacophore model, including two H-bond acceptors (A) and three hydrophobic or hydrophobic aromatic centers (hp), to filter the NCI database with compounds that satisfied specific geometric and/or physicochemical constraints.
The following parameters were used for the pharmacophore generation: population size was set to 20, maximum generations was set to 90, keep best N models was set to 10, and the random seed was set to 12,345.
Once the pharmacophore model was constructed, we used it to filter the NCI database by submitting a UNITY search in SYBYL. The following parameters were used for the UNITY search. Search query was set to our pharmacophore model. Search type was set to 3D Search. Search data-source was set to prepared NCI database. Search Options was set to default values.
Molecular docking and molecular dynamics simulation
The docking program Surflex-Dock GeomX (SFXC) in SYBYL-X 1.3 [13] was applied to construct receptor-ligand complexes, in which the total score was expressed as log10(Kd) [47]. The detailed protocols or parameters of docking can be found in our recent publications [48, 49]. The following default docking parameters were used: the additional starting conformation per molecule was set to 0, angstroms to expand search grid was set to 6, max conformation per fragment was set to 20 and max number of rotatable bonds per molecule was set to 100. The following flags were turned on: pre-dock minimization, post-dock minimization, molecule fragmentation, soft grid treatment, and activate spin alignment method with density of search was set to 3.0 and number of spins per alignment was set to 12.
After molecular docking, we selected some represented complexes of APE-1 and our inhibitors and inactive compounds to perform the molecular dynamics simulations (MD).
The His309 residue was the only one whose ionization could vary within the physiological pH range (~7.40). To determine the protonation states for His and other residues, we used VEGA ZZ 2.4.0 [50], PROPKA 3.1 [51], and H++ 3.0 [52] to predict the pKa values of residues. For APE-1, the calculated pKa value of His309 was higher than 8.0 while others were lower than 6.0, so that only His309 was protonated. Side chains of Asp, Glu, Arg, and Lys were charged (Asp−, Glu−, Arg+, and Lys+) in all simulations. The entire system (APE-1 + active AJAY-4 or APE-1 + inactive AJAY-15) contained APE-1 and its ligands, ~6208/~6212 water molecules, 0/0 sodium ions, and 4/4 chloride ions for a total of ~23071/~23079 atoms per periodic cell. The box sizes (Fig. 1S) were 62 × 62 × 62 Å3/62 × 62 × 62 Å3. The systems were first minimized for 50,000 steps with the APE-1 protein fixed: in the PDB file, the values of B-column of the protein were set to “1”, so the protein would be fixed during the minimization for the water molecules. Then, the APE-1 protein was released (the B-column was set to “0”) and another 50,000 steps minimization were performed.
Starting from the last frame of the second minimization, we performed 50 ns MD simulations. The MD simulations were performed using the following parameters: (i) NAMD package [53] (version 2.9b1) with the CHARMM27 [54, 55] force field was used to carry out the MD simulations; (ii) the Particle Mesh Ewald [56] (PME) method was used to calculate the electrostatics, with a 12-Å non-bonded cutoff and a grid spacing of 1 Å per grid point in each dimension; (iii) a smooth cutoff (switching radius 10 Å, cutoff radius 12 Å) was used to calculate the van der Waals energies; and (iv) a Langevin thermostat (a constant temperature of 310 °K) and Langevin barostat (a constant pressure of 1 atm) were used to keep the temperature and pressure constant, respectively. The time step of MD simulations was set to 1 fs. The data was saved every 10 ps for later analysis. Trajectory analyses were carried out with VMD [57].
Mechanism of APE-1 toxicity
Human glioblastoma (T98G) cells were obtained from American Type Culture Collection (Manassas, VA). HT Colorimetric PARP Apoptosis Assay Kit was purchased from Trevigen (Gaithersburg, MD) and used as described in manufacturer’s instructions. Pierce Cleaved PARP Colorimetric in-cell ELISA kit was purchased from Thermo Scientific (Rockford, IL) and used as described in manufacturer’s instructions. Cell culture components and Enzcheck® Caspase-3 Assay kit were purchased from Invitrogen (Carlsbad, CA) and used as described in manufacturer’s instructions. Chemicals and solvents were purchased from Sigma Aldrich Chemicals (St. Louis, MO). Molecular biology grade buffers, as well as plastic- and glassware were obtained from Fisher Scientific (Pittsburgh, PA). MeLex was synthesized as previously described [43].
Markers of apoptosis and necrosis
Human glioblastoma cells (T98G) were maintained in growth medium, i.e., Eagle’s Minimum Essential Medium (EMEM) with 10 % fetal bovine serum (FBS), 50 g L−1 gentamycin, 1× MEM non-essential amino acid, and 1 mM sodium pyruvate. For each assay, T98G cells were harvested by Trypsin-EDTA treatment, resuspended in fresh growth medium, and seeded into 96- or 6-well plates as per the assay requirements: to measure PARP activity, 2 × 10⁴ cells were seeded into the wells of a 96 well plate; to measure PARP cleavage, 104 cells were seeded into the wells of a 96-well plate; and to measure caspase (-3 and -7) activities, 106 cells were seeded into the wells of a 6-well plate. Cells were allowed to grow for 24 h, and subject to the following treatments: (a) 80 μM MeLex (LD10 value), (b) 250 μM MeLex (LD50 value), (c) 0.25 μM APE-inhibitor 4 (LD10 value), (d) 0.96 μM AJAY-4 (LD50 value), (e) 80 μM MeLex (LD10 value) + 0.25 μM AJAY-4 (LD10 value), and (f) 0.2 % dimethyl sulfoxide (DMSO) (vehicle control), for 2, 6, 12, 18, 24, and 36 h. Cells treated with 20 μM etoposide for 2, 6, and 12 h per manufacturer’s instruction were used as a reference control, and untreated cells (media only) were used as negative controls at all time points. At the end of each treatment, adherent cells were harvested by trypsin-EDTA treatment. Additionally, cells in supernatant were harvested by centrifugation (100×g, 5 min). Harvested adherent cells were pooled with harvested cells in supernatant. Intracellular PARP activity was determined using the HT Colorimetric PARP Apoptosis Assay Kit as per manufacturer’s instructions—this kit measures the deposition of PAR on immobilized histones, due to action of intracellular PARP, using anti-PAR and horseradish peroxidase (HRP)-conjugated secondary antibody. PARP cleavage was measured using the Pierce Cleaved PARP Colorimetric in-cell ELISA kit—this ELISA employed anti-cleaved PARP and HRP-conjugated secondary antibody. Intracellular caspase (-3 and -7) activities were measured using the Enzcheck® Caspase-3 Assay kit—this kit employs Z-DEVD-AMC (benzyloxycarbonyl-Asp-Glu-Val-Asp-7amino-4methyl-coumarin), a synthetic fluorogenic substrate of cysteine proteases such as Caspase-3 and -7.
NCI 60 cell line growth inhibition 50 % (GI50) determinations
Cells from each of the NCI 60 cell lines were harvested, counted, and seeded into the wells of T0 and T72 384-well assay plates at seeding densities that allowed for continuous proliferation throughout 96 h of incubation at 37 °C, 5 % CO2, and 95 % humidity. After 24 h in culture, Cell Titer Glo detection reagent (Promega, Madison, WI, USA) was added to the wells of the T0 assay plate and the cellular ATP-dependent luminescent signal was captured on an M5e micotiter plate reader. Also, after 24 h, compounds that had been serially diluted in tissue culture medium to provide a 5-point 10-fold dilution series were transferred into the wells of the T72 assay plate that was then returned to the incubator. After an additional 72 h of incubation, Cell Titer Glo detection reagent was added to the wells of the T72 assay plate and the cellular ATP-dependent luminescent signal was captured on an M5e micotiter plate reader. The percent of growth in the compound-treated wells was normalized relative to the growth observed in the corresponding T0 and T72 assay plate control wells and the data was fit to curves and calculate a growth inhibition 50 concentration (GI50) using the Sigmoidal dose response variable slope equation Y = Bottom + [Top − Bottom]/[1 + 10(LogEC50 − X) × HillSlope] of the GraphPad Prism 5 software. The percent growth (PG) was calculated according to the definition from the NCI 60 web site:
where Ti is the test value of the time 72 h, Tz is the average of the test values from the T0 plate at the time zero, and C is the average of the test values at the DMSO control wells from the T72 plate, and the growth inhibition (GI50) is the concentration at which cell growth was inhibited by 50 %, total growth inhibition (TGI) is the concentration at which cell growth was fully inhibited, and lethal concentration (LC50) is the concentration at which 50 % of the cells were killed.
NCI 60 drug combination synergy screening
In a pilot drug combination matrix screening assay using 10 randomly selected cell lines from the NCI 60 panel, we assayed the effect of APE1 inhibitor AJAY-4 on the growth inhibition responses of 20 recently approved non-genotoxic anticancer drugs. Each drug combination matrix included the 3 × 3 drug combinations together with the corresponding individual drug concentrations and a DMSO control well. DMSO controls were also included on each assay plate (columns 1, 2, 23, and 24) for QC review purposes. Cells from each of the 10 NCI 60 cell lines were harvested, counted, and seeded into the wells of T0 and T72 384-well assay plates at seeding densities that allowed for continuous proliferation throughout 96 h of incubation at 37 °C, 5 % CO2, and 95 % humidity. After 24 h in culture, Cell Titer Glo detection reagent was added to the wells of the T0 assay plate and the cellular ATP-dependent luminescent signal was captured on an M5e micotiter plate reader. Also, after 24 h, drug combination matrices that had been diluted in tissue culture medium were transferred into the wells of the T72 assay plate that was then returned to the incubator. After an additional 72 h of incubation, Cell Titer Glo detection reagent was added to the wells of the T72 assay plate and the cellular ATP-dependent luminescent signal was captured on an M5e micotiter plate reader. Individual compound controls run in singlet were included in each drug combination matrix and compared to replicate (n = 10) controls for each compound. The percent of growth in the compound-treated wells was normalized relative to the growth observed in the corresponding T0 and T72 assay plate control wells. The percent growth (PG) was calculated according to the definition from the NCI 60 web site as described above.
Synergy experiments
The SK-MEL-5 and SK-MEL-2 melanoma cell lines were cultured at 37 °C in 5 % CO2 and 95 % humidity in RPMI supplemented with 10 % FBS, 1 % L-glutamine, penicillin, and streptomycin. On day 1, each cell line was harvested, counted, and seeded at 1000 and 625 cells per well (respectively) into 384-well assay plates. After 24 h in culture, 5 μL of compounds diluted in SFM were transferred into test wells and assay plates were cultured for an additional 72 h. Control wells received DMSO alone. On day 5, 25 μL of Cell Titer Glo (Promega Corporation, Madison WI) detection reagent was added to assay plates and the luminescence was captured on the M5e microtiter plate reader (Molecular Devices LLC, Sunnyvale, CA).
Design of synergism matrix
The matrix was designed in a 10 × 10 format with single drugs AJAY-4 and vemurafenib at maximum starting concentration of 60 and 40 μM (respectively) in a 3-fold dilution series bordering the matrix exterior, and the drugs in combination within the matrix itself. In addition to the central drug ratio of 3:2, the design included other drug ratios within the matrix. Cell lines were seeded in 384 well plates and treated after 24 h of growth and cultured for an additional 72 h, and cell growth was analyzed as described above.
Analysis of synergism
The Cell Titer Glo reagent measures cellular ATP as an indicator of viability, and the fraction of cells affected (FA) was calculated for each treatment both single drug and combination. The COMPUSYN freeware program was utilized to evaluate drug combination synergy and produced combination index (CI) plots of the FA and calculated CI values based on the fit of the experimental data to the Chou-Talalay median effects model.
Electronic supplementary material
Synthetic Information and Structure Characterization of AJAY-4 (DOCX 848 kb)
Structural of compounds identified from in silico screen and Ki vs. APE-1 endonuclease activity. (DOCX 448 kb)
The water-box for molecular dynamics (MD) simulations. The sizes were 62 × 62 × 62 Å3. The whole system (APE-1 and active compound AJAY-4,) contained ~6208 water molecules, 0 sodium ions and 4 chloride ions for a total of ~23071 atoms per periodic cell. MD simulations for 50 ns were performed. (DOCX 3038 kb)
Inhibitors. (a) AJAY-1, IC50: 0.18uM, (b) AJAY-2, IC50: 0.22uM and (c) AJAY-3, IC50: 0.19 μM. His309 and Arg177 formed strong hydrogen bonds with all our four compounds. Tyr171, Asn174 and Asn212 formed weak hydrophilic interactions with these compounds. Phe266 formed strong π-π interaction with all compounds. Trp280 mainly formed hydrophobic interactions with our inhibitors. (DOCX 946 kb)
MD simulations results for inactive compound AJAY-15: (a) the alignments of AJAY-15 between before MD (orange) and after MD (blue), (b) the distances between AJAY-15 and APE-1. Although this compound matched with our five-point pharmacophore model, it showed no active for APE-1. Based our results, we found that inactive compound AJAY-15 did not form H-bonds with His309, and the distances between inactive compound AJAY-15, and Arg177 and His309 fluctuated significantly during the MS simulations. We suggest that Arg177 and His309 play key roles in the recognitions of inhibitors. (DOCX 439 kb)
Acknowledgements
Authors would like to acknowledge the funding support for the laboratory and Center at the University of Pittsburgh from NIH P30DA035778 (XIE), and the receipt of a Development Research Project award (Johnston and Gold) from the University of Pittsburgh Melanoma and Skin Cancer SPORE.
Conflict of interest
The authors declare that they have no conflict of interest.
Abbreviations
- AAG
Alkyladenine-DNA glycosylase (aka, MPG)
- APE-1
Human apurinic endonuclease-1/redox effector factor-1
- BER
Base excision repair
- MD
Molecular dynamics
- DMSO
Dimethyl sulfoxide
- MeLex
Methyl 3-(1-methyl-5-(1-methyl-5-(propylcarbamoyl)-1H-pyrrol-3-ylcarbamoyl)-1H-pyrrol-3-ylamino)-3-oxopropane-1-sulfonate
- RMSD
Root mean square deviation
Contributor Information
Xiang-Qun Xie, Phone: 412-383-5276, Email: xix15@pitt.edu.
Paul A. Johnston, Email: paj18@pitt.edu
Barry Gold, Phone: 412-383-9593, Email: goldbi@pitt.edu.
References
- 1.Demple B, Herman T, Chen DS. Cloning and expression of APE, the cDNA encoding the major human apurinic endonuclease: definition of a family of DNA repair enzymes. Proc Natl Acad Sci U S A. 1991;88:11450–11454. doi: 10.1073/pnas.88.24.11450. [DOI] [PMC free article] [PubMed] [Google Scholar]
- 2.Lindahl T. Repair of intrinsic DNA lesions. Mutat Res. 1990;238:305–311. doi: 10.1016/0165-1110(90)90022-4. [DOI] [PubMed] [Google Scholar]
- 3.Hegde ML, Hazra TK, Mitra S. Early steps in the DNA base excision/single-strand interruption repair pathway in mammalian cells. Cell Res. 2008;18:27–47. doi: 10.1038/cr.2008.8. [DOI] [PMC free article] [PubMed] [Google Scholar]
- 4.Demple B, Sung JS. Molecular and biological roles of Ape1 protein in mammalian base excision repair. DNA Repair. 2005;4:1442–1449. doi: 10.1016/j.dnarep.2005.09.004. [DOI] [PubMed] [Google Scholar]
- 5.Fritz G, Grösch S, Tomicic M, Kaina B. APE/Ref-1 and the mammalian response to genotoxic stress. Toxicology. 2003;193:67–78. doi: 10.1016/S0300-483X(03)00290-7. [DOI] [PubMed] [Google Scholar]
- 6.Lindahl T, Nyberg B. Rate of depurination of native deoxyribonucleic acid. Biochemistry. 1972;11:3610–3618. doi: 10.1021/bi00769a018. [DOI] [PubMed] [Google Scholar]
- 7.Loeb LA, Preston BD. Mutagenesis by apurinic/apyrimidinic sites. Annu Rev Genet. 1998;20:201–230. doi: 10.1146/annurev.ge.20.120186.001221. [DOI] [PubMed] [Google Scholar]
- 8.Wilson DM, III, Thompson LH. Life without DNA repair. Proc Natl Acad Sci U S A. 1997;94:2754–12757. doi: 10.1073/pnas.94.24.12754. [DOI] [PMC free article] [PubMed] [Google Scholar]
- 9.Xanthoudakis S, Smeyne RJ, Wallace JD, Curran T. The redox/DNA repair protein, Ref-1, is essential for early embryonic development in mice. Proc Natl Acad Sci U S A. 1996;93:8919–8923. doi: 10.1073/pnas.93.17.8919. [DOI] [PMC free article] [PubMed] [Google Scholar]
- 10.Mitra S, Izumi T, Boldogh I, Bhakat KK, Chattopadhyay R, Szczesny B. Intracellular trafficking and regulation of mammalian AP-endonuclease 1 (APE1), an essential DNA repair protein. DNA Repair. 2007;6:461–469. doi: 10.1016/j.dnarep.2006.10.010. [DOI] [PubMed] [Google Scholar]
- 11.Kakolyris S, Kaklamanis L, Engels K, Fox SB, Taylor M, Hickson ID, Gatter KC, Harris AL. Human AP endonuclease 1(HAP1) protein expression in breast cancer correlates with lymph node status and angiogenesis. Br J Cancer. 1998;77:1169–1173. doi: 10.1038/bjc.1998.194. [DOI] [PMC free article] [PubMed] [Google Scholar]
- 12.Herring CJ, West CM, Wilks DP, Davidson SE, Hunter RD, Berry P, Forster G, MacKinnon J, Rafferty JA, Elder RH, Hendry JH, Margison GP. Levels of the DNA repair enzyme human apurinic/apyrimidinic endonuclease (APE1, APEX, Ref-1) are associated with the intrinsic radiosensitivity of cervical cancers. Br J Cancer. 1998;78:1128–1133. doi: 10.1038/bjc.1998.641. [DOI] [PMC free article] [PubMed] [Google Scholar]
- 13.Xu Y, Moore DH, Broshears J, Liu L, Wilson TM, Kelley MR. The apurinic/apyrimidinic endonuclease (APE/ref-1) DNA repair enzyme is elevated in premalignant and malignant cervical cancer. Anticancer Res. 1997;17:3713–3719. [PubMed] [Google Scholar]
- 14.Moore DH, Michael H, Tritt R, Parsons SH, Kelley MR. Alterations in the expression of the DNA repair/redox enzyme APE/ref-1 in epithelial ovarian cancers. Clin Cancer Res. 2000;6:602–609. [PubMed] [Google Scholar]
- 15.Thomson B, Tritt R, Davis KMR. Histologyspecific expression of a DNA repair protein in pediatric rhabdomyosarcomas. J Pediatr Hematol Oncol. 2001;23:234–239. doi: 10.1097/00043426-200105000-00011. [DOI] [PubMed] [Google Scholar]
- 16.Bobola MS, Blank A, Berger MS, Stevens BA, Silber JR. Apurinic/apyrimidinic endonuclease activity is elevated in human adult gliomas. Clin Cancer Res. 2001;7:3510–3518. [PubMed] [Google Scholar]
- 17.Koukourakis MI, Giatromanolaki A, Kakolyris S, Sivridis E, Georgoulias V, Funtzilas G, Hickson ID, Gatter KC, Harris AL. Nuclear expression of human apurinic/apyrimidinic endonuclease (HAP1/Ref-1) in head-and-neck cancer is associated with resistance to chemoradiotherapy and poor outcome. Int J Radiat Oncol Biol Phys. 2001;50:27–36. doi: 10.1016/S0360-3016(00)01561-3. [DOI] [PubMed] [Google Scholar]
- 18.Luo M, Kelley MR. Inhibition of the human apurinic/apyrimidinic endonuclease (APE1) repair activity and sensitization of breast cancer cells to DNA alkylating agents with lucanthone. Anticancer Res. 2004;24:2127–2134. [PubMed] [Google Scholar]
- 19.Madhusudan S, Smart F, Shrimpton P, Parsons JL, Gardiner L, Houlbrook S, Talbot DC, Hammonds T, Freemont PA, Sternberg MJ, Dianov GL, Hickson ID. Isolation of a small molecule inhibitor of DNA base excision repair. Nucleic Acids Res. 2005;33:4711–4724. doi: 10.1093/nar/gki781. [DOI] [PMC free article] [PubMed] [Google Scholar]
- 20.Zou GM, Maitra A. Small-molecule inhibitor of the AP endonuclease 1/REF-1 E3330 inhibits pancreatic cancer cell growth and migration. Mol Cancer Ther. 2008;7:2012–2021. doi: 10.1158/1535-7163.MCT-08-0113. [DOI] [PMC free article] [PubMed] [Google Scholar]
- 21.Seiple LA, Cardellina JH, II, Akee R, Stivers JT. Potent inhibition of human apurinic/apyrimidinic endonuclease 1 by arylstibonic acids. Mol Pharmacol. 2008;73:669–677. doi: 10.1124/mol.107.042622. [DOI] [PMC free article] [PubMed] [Google Scholar]
- 22.Simeonov A, Kulkarni A, Dorjsuren D, Jadhav A, Shen M, McNeill DR, Austin CP, Wilson DM., 3rd Identification and characterization of inhibitors of human apurinic/apyrimidinic endonuclease APE1. PLoS One. 2009;4:e5740. doi: 10.1371/journal.pone.0005740. [DOI] [PMC free article] [PubMed] [Google Scholar]
- 23.Zawahir Z, Dayam R, Deng J, Pereira C, Neamati N. Pharmacophore guided discovery of small-molecule human apurinic/apyrimidinic endonuclease 1 inhibitors. J Med Chem. 2009;52:20–32. doi: 10.1021/jm800739m. [DOI] [PubMed] [Google Scholar]
- 24.Nyland RL, Luo M, Kelley MR, Borch RF. Design and synthesis of novel quinone inhibitors targeted to the redox function of apurinic/apyrimidinic endonuclease 1/redox enhancing factor-1 (Ape1/ref-1) J Med Chem. 2010;53:1200–1210. doi: 10.1021/jm9014857. [DOI] [PMC free article] [PubMed] [Google Scholar]
- 25.Rai G, Vyjayanti VN, Dorjsuren D, Simeonov A, Jadhav A, Wilson DM, 3rd, Maloney DJ. Synthesis, biological evaluation, and structure-activity relationships of a novel class of apurinic/apyrimidinic endonuclease 1 inhibitors. J Med Chem. 2012;55:3101–3112. doi: 10.1021/jm201537d. [DOI] [PMC free article] [PubMed] [Google Scholar]
- 26.Srinivasan A, Wang L, Cline CJ, Xie Z, Sobol RW, Xie XQ, Gold B. Identification and characterization of human apurinic/apyrimidinic endonuclease-1 inhibitors. Biochemistry. 2012;51:6246–6259. doi: 10.1021/bi300490r. [DOI] [PMC free article] [PubMed] [Google Scholar]
- 27.Fishel ML, Kelley MR. The DNA base excision repair protein Ape1/Ref-1 as a therapeutic and chemopreventative target. Molec Asp Med. 2007;28:375–395. doi: 10.1016/j.mam.2007.04.005. [DOI] [PubMed] [Google Scholar]
- 28.McNeill DR, Lam W, DeWeese TL, Cheng YC, Wilson DM., 3rd Impairment of APE1 function enhances cellular sensitivity to clinically relevant alkylators and antimetabolites. Mol Cancer Res. 2009;7:897–906. doi: 10.1158/1541-7786.MCR-08-0519. [DOI] [PMC free article] [PubMed] [Google Scholar]
- 29.Abbotts R, Madhusudan S. Human AP endonuclease (APE1): from mechanistic insights to druggable target in cancer. Cancer Treat Rev. 2010;36:425–435. doi: 10.1016/j.ctrv.2009.12.006. [DOI] [PubMed] [Google Scholar]
- 30.Chapman PB, Hauschild A, Robert C, Haanen JB, Ascierto P, Larkin J, Dummer R, Garbe C, Testori A, Maio M, Hogg D, Lorigan P, Lebbe C, Jouary T, Schadendorf D, Ribas A, O’Day SJ, Sosman JA, Kirkwood JM, Eggermont AM, Dreno B, Nolop K, Li J, Nelson B, Hou J, Lee RJ, Flaherty KT, McArthur GA, BRIM-3 Study Group Improved survival with vemurafenib in melanoma with BRAF V600E mutation. N Engl J Med. 2011;364:2507–2516. doi: 10.1056/NEJMoa1103782. [DOI] [PMC free article] [PubMed] [Google Scholar]
- 31.Gorman MA, Morera S, Rothwell DG, de La Fortelle E, Mol CD, Tainer JA, Hickson ID, Freemont PS. The crystal structure of the human DNA repair endonuclease HAP1 suggests the recognition of extra‐helical deoxyribose at DNA abasic sites. EMBO J. 1997;16:6548–6558. doi: 10.1093/emboj/16.21.6548. [DOI] [PMC free article] [PubMed] [Google Scholar]
- 32.Mol CD, Izumi T, Mitra S, Tainer JA. DNA-bound structures and mutants reveal abasic DNA binding by APE1 DNA repair and coordination. Nature. 2000;403:451–456. doi: 10.1038/35000249. [DOI] [PubMed] [Google Scholar]
- 33.Mundle ST, Delaney JC, Essigmann JM, Strauss PR. Enzymatic mechanism of human apurinic/apyrimidinic endonuclease against a THF AP site model substrate. Biochemistry. 2008;48:19–26. doi: 10.1021/bi8016137. [DOI] [PMC free article] [PubMed] [Google Scholar]
- 34.Kaur G, Cholia RP, Mantha AK, Kumar R (2014) DNA repair and redox activities and inhibitors of apurinic/apyrimidinic endonuclease 1/redox effector factor-1 (APE1/Ref-1): a comparative analysis and their scope and limitations toward anticancer drug development. J Med Chem [DOI] [PubMed]
- 35.Mohammed MZ, Vyjayanti VN, Laughton CA, Dekker LV, Fischer PM, Wilson DM, 3rd, Abbotts R, Shah S, Patel PM, Hickson ID, Madhusudan S. Development and evaluation of human AP endonuclease inhibitors in melanoma and glioma cell lines. Brit J Cancer. 2011;104:653–663. doi: 10.1038/sj.bjc.6606058. [DOI] [PMC free article] [PubMed] [Google Scholar]
- 36.Kim YJ, Wilson DM., 3rd Overview of base excision repair biochemistry. Curr Mol Pharmacol. 2012;5:3–13. doi: 10.2174/1874467211205010003. [DOI] [PMC free article] [PubMed] [Google Scholar]
- 37.Sen S, Paraggio NA, Gearheart LA, Connor EE, Issa A, Coleman RS, Wilson DM, 3rd, Wyatt MD, Berg MA. Effect of protein binding on ultrafast DNA dynamics: characterization of a DNA: APE1 complex. Biophys J. 2005;89:4129–4138. doi: 10.1529/biophysj.105.062695. [DOI] [PMC free article] [PubMed] [Google Scholar]
- 38.Vidal AE, Harkiolaki M, Gallego C, Castillo-Acosta VM, Ruiz-Pérez LM, Wilson K, González-Pacanowska D. Crystal structure and DNA repair activities of the AP Endonuclease from leishmania major. J Mol Biol. 2007;373:827–838. doi: 10.1016/j.jmb.2007.08.001. [DOI] [PubMed] [Google Scholar]
- 39.http://dtp.nci.nih.gov/branches/btb/ivclsp.html
- 40.Yeang CH. An integrated analysis of molecular aberrations in NCI-60 cell lines. BMC Bioinf. 2010;11:495. doi: 10.1186/1471-2105-11-495. [DOI] [PMC free article] [PubMed] [Google Scholar]
- 41.Li SD, Tagami T, Ho YF, Yeang CH. Deciphering causal and statistical relations of molecular aberrations and gene expressions in NCI-60 cell lines. BMC Syst Biol. 2011;5:186. doi: 10.1186/1752-0509-5-186. [DOI] [PMC free article] [PubMed] [Google Scholar]
- 42.Zhang Y, Chen FX, Mehta P, Gold B. The design of groove and sequence selective alkylation of DNA by sulfonate esters tethered to lexitropsins. Biochemistry. 1993;32:7954–7965. doi: 10.1021/bi00082a017. [DOI] [PubMed] [Google Scholar]
- 43.Iyer P, Srinivasan A, Singh SK, Mascara GP, Zayitova S, Sidone B, Fouquerel E, Svilar D, Sobol RW, Bobola MS, Silber JR, Gold B. Synthesis and characterization of DNA minor groove binding alkylating agents. Chem Res Toxicol. 2013;26:156–68. doi: 10.1021/tx300437x. [DOI] [PMC free article] [PubMed] [Google Scholar]
- 44.Ting-chao C. Drug combination studies and their synergy quantification using the Chou-Talalay method. Cancer Res. 2010;70:440–446. doi: 10.1158/0008-5472.CAN-09-1947. [DOI] [PubMed] [Google Scholar]
- 45.Corazao-Rozas P, Guerreschi P, Jendoubi M, André F, Jonneaux A, Scalbert C, Garçon G, Malet-Martino M, Balayssac S, Rocchi S, Savina A, Formstecher P, Mortier L, Kluza J, Marchetti P. Mitochondrial oxidative stress is the Achille’s heel of melanoma cells resistant to Braf-mutant inhibitor. Oncotarget. 2013;4:1986–1998. doi: 10.18632/oncotarget.1420. [DOI] [PMC free article] [PubMed] [Google Scholar]
- 46.Yu L, Gao LX, Ma XQ, Hu FX, Li CM, Lu Z. Involvement of superoxide and nitric oxide in BRAF(V600E) inhibitor PLX4032-induced growth inhibition of melanoma cells. Integr Biol. 2014;6:1211–1217. doi: 10.1039/C4IB00170B. [DOI] [PubMed] [Google Scholar]
- 47.Jain AN. Scoring noncovalent protein-ligand interactions: a continuous differentiable function tuned to compute binding affinities. J Comput Aided-Mol De. 1996;10:427–440. doi: 10.1007/BF00124474. [DOI] [PubMed] [Google Scholar]
- 48.Chen JZ, Wang J, Xie XQ. GPCR structure-based virtual screening approach for CB2 antagonist search. J Chem Inf Model. 2007;47:1626–1637. doi: 10.1021/ci7000814. [DOI] [PubMed] [Google Scholar]
- 49.Feng Z, Alqarni MH, Yang P, Tong Q, Chowdhury A, Wang L, Xie XQ. Modeling, molecular dynamics simulation, and mutation validation for structure of cannabinoid receptor 2 based on known crystal structures of GPCRs. J Chem Inf Model. 2014;54:2483–2499. doi: 10.1021/ci5002718. [DOI] [PMC free article] [PubMed] [Google Scholar]
- 50.Pedretti A, Villa L, Vistoli G. VEGA: a versatile program to convert, handle and visualize molecular structure on Windows-based PCs. J Mol Graph Model. 2002;21:47–49. doi: 10.1016/S1093-3263(02)00123-7. [DOI] [PubMed] [Google Scholar]
- 51.Søndergaard CR, Olsson MH, Rostkowski M, Jensen JH. Improved treatment of ligands and coupling effects in empirical calculation and rationalization of pKa values. J Chem Theory Comput. 2011;7:2284–2295. doi: 10.1021/ct200133y. [DOI] [PubMed] [Google Scholar]
- 52.Anandakrishnan R, Aguilar B, Onufriev AV. H++ 3.0: automating pK prediction and the preparation of biomolecular structures for atomistic molecular modeling and simulations. Nucleic Acids Res. 2012;40:W537–W541. doi: 10.1093/nar/gks375. [DOI] [PMC free article] [PubMed] [Google Scholar]
- 53.Kalé L, Skeel R, Bhandarkar M, Brunner R, Gursoy A, Krawetz N, Phillips J, Shinozaki A, Varadarajan K, Schulten K. NAMD2: greater scalability for parallel molecular dynamics. J Comput Phys. 1999;151:283–312. doi: 10.1006/jcph.1999.6201. [DOI] [Google Scholar]
- 54.Brooks BR, Bruccoleri RE, Olafson BD. CHARMM: a program for macromolecular energy, minimization, and dynamics calculations. J Comput Chem. 1983;4:187–217. doi: 10.1002/jcc.540040211. [DOI] [Google Scholar]
- 55.MacKerell AD, Bashford D, Bellott M, Dunbrack RL, Evanseck JD, Field MJ, Fischer S, Gao J, Guo H, Ha S, Joseph-McCarthy D, Kuchnir L, Kuczera K, Lau FT, Mattos C, Michnick S, Ngo T, Nguyen DT, Prodhom B, Reiher WE, Roux B, Schlenkrich M, Smith JC, Stote R, Straub J, Watanabe M, Wiórkiewicz-Kuczera J, Yin D, Karplus M. All-atom empirical potential for molecular modeling and dynamics studies of proteins. J Phys Chem B. 1998;102:3586–3616. doi: 10.1021/jp973084f. [DOI] [PubMed] [Google Scholar]
- 56.Essmann U, Perera L, Berkowitz ML, Darden T, Lee H, Pedersen LG. A smooth particle mesh Ewald method. J Chem Phys. 1995;103:8577–8593. doi: 10.1063/1.470117. [DOI] [Google Scholar]
- 57.Hsin J, Arkhipov A, Yin Y, Stone JE, Schulten K (2008) Using VMD: an introductory tutorial. Curr Protoc Bioinform Chapter 5, Unit 5.7 [DOI] [PMC free article] [PubMed]
Associated Data
This section collects any data citations, data availability statements, or supplementary materials included in this article.
Supplementary Materials
Synthetic Information and Structure Characterization of AJAY-4 (DOCX 848 kb)
Structural of compounds identified from in silico screen and Ki vs. APE-1 endonuclease activity. (DOCX 448 kb)
The water-box for molecular dynamics (MD) simulations. The sizes were 62 × 62 × 62 Å3. The whole system (APE-1 and active compound AJAY-4,) contained ~6208 water molecules, 0 sodium ions and 4 chloride ions for a total of ~23071 atoms per periodic cell. MD simulations for 50 ns were performed. (DOCX 3038 kb)
Inhibitors. (a) AJAY-1, IC50: 0.18uM, (b) AJAY-2, IC50: 0.22uM and (c) AJAY-3, IC50: 0.19 μM. His309 and Arg177 formed strong hydrogen bonds with all our four compounds. Tyr171, Asn174 and Asn212 formed weak hydrophilic interactions with these compounds. Phe266 formed strong π-π interaction with all compounds. Trp280 mainly formed hydrophobic interactions with our inhibitors. (DOCX 946 kb)
MD simulations results for inactive compound AJAY-15: (a) the alignments of AJAY-15 between before MD (orange) and after MD (blue), (b) the distances between AJAY-15 and APE-1. Although this compound matched with our five-point pharmacophore model, it showed no active for APE-1. Based our results, we found that inactive compound AJAY-15 did not form H-bonds with His309, and the distances between inactive compound AJAY-15, and Arg177 and His309 fluctuated significantly during the MS simulations. We suggest that Arg177 and His309 play key roles in the recognitions of inhibitors. (DOCX 439 kb)


