Abstract
It is generally believed that splicing removes introns as single units from pre-mRNA transcripts. However, some long D. melanogaster introns contain a cryptic site, called a recursive splice site (RS-site), that enables a multi-step process of intron removal termed recursive splicing1,2. The extent to which recursive splicing occurs in other species and its mechanistic basis remain unclear. Here we identify highly conserved RS-sites in genes expressed in the mammalian brain that encode proteins functioning in neuronal development. Moreover, the RS-sites are found in some of the longest introns across vertebrates. We find that vertebrate recursive splicing requires initial definition of a “RS-exon” that follows the RS-site. The RS-exon is then excluded from the dominant mRNA isoform due to competition with a reconstituted 5′ splice site formed at the RS-site after the first splicing step. Conversely, the RS-exon is included when preceded by cryptic exons or promoters that are prevalent in long introns, but which fail to reconstitute an efficient 5′ splice site. Most RS-exons contain a premature stop codon such that their inclusion may decrease mRNA stability. Thus, by establishing a binary splicing switch, RS-sites demarcate different mRNA isoforms emerging from long genes by coupling inclusion of cryptic elements with RS-exons.
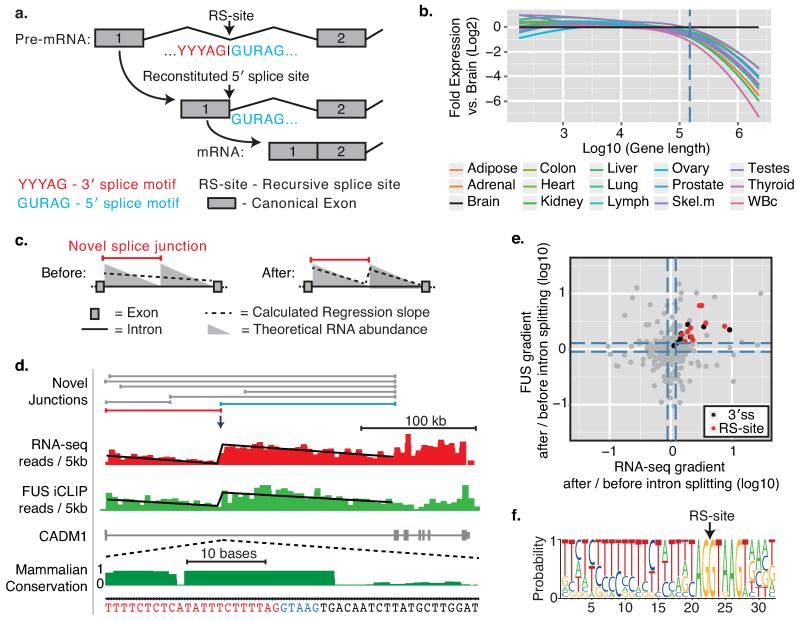
Recursive splicing has been validated within the long introns (>24 kb) of three D. melanogaster genes1,2. The RS-sites in these introns contain a 3′ splice site followed by a sequence that reconstitutes a 5′ splice site after the first part of the intron is spliced, thereby allowing subsequent splicing of the second part of the intron (Fig. 1a). While one mammalian sequence was proposed to function as an RS-site when pre-spliced to an upstream exon in a splicing reporter3, recursive splicing has not been observed in endogenous vertebrate genes. This is despite >8000 human protein-coding genes containing introns >24 kb, and many vertebrate genes containing motifs similar to the D. melanogaster RS-sites4.
Fig. 1. Detection of recursive splice sites within long genes expressed in the human brain.
a) Schematic of the D. melanogaster recursive splicing mechanism. b) Log2-fold gene expression ratios following differential expression sequencing (DESeq)19 analysis of all human protein-coding genes between the brain and all other tissues. Data are represented as Loess smoothing curves after defining genes by their maximum length in kb. Hashed vertical line indicates 150 kb. RNA-seq data was obtained from the llumina Human Body Map 2.0 total RNA-seq library (GEO accession: GSE30611). c) Schematic of the theoretical RNA abundance across long introns demonstrating linear regression analysis performed on introns before/after novel junction consideration. d) All novel junctions identified within CADM1 by RNA-seq data are shown on top of experimentally derived RNA-seq (red) and FUS iCLIP (green) read densities, both grouped in 5 kb windows. The displayed linear regression line was determined after the intron was split at the red novel junction. This split significantly improved the regression in both RNA-seq and FUS iCLIP (p<0.01 in both, F-test). Blue novel junction contacts the RS-exon. Phylo-P sequence conservation scores are shown around the CADM1 RS-site across 46 mammalian species. e) Ratio of after:before gradients at long gene novel junctions in RNA-seq (x-axis) and FUS iCLIP (y-axis) datasets. Black and red dots represent junctions that significantly improve the regression gradient and goodness-of-fit, whereas grey dots show no improvement. Black dots are junctions contacting the sequence of 3′ splice sites, whereas red dots contact the sequence of RS-sites. Hashed lines mark upper and lower quartile ratios for each dataset. f) WebLogo of RS-sites identified by red junctions from panel (e).
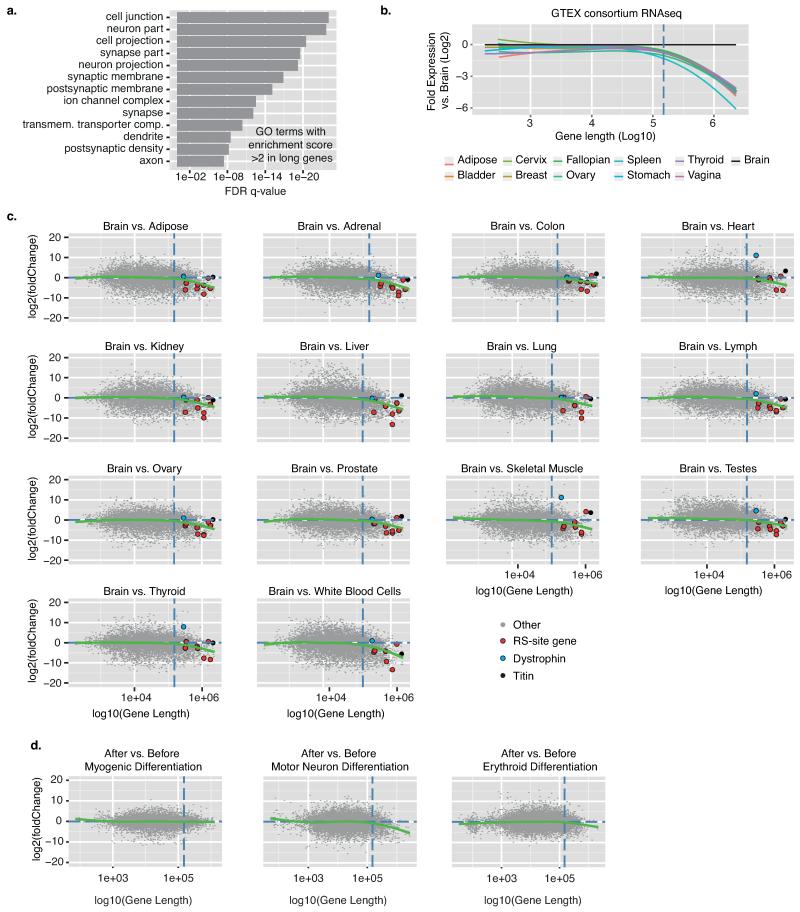
Long genes exhibit elevated expression in the nervous system, as evident by analysis of human tissues or differentiating cells (Fig. 1b, Extended Data Fig. 1b-d)5, and are enriched in GO terms associated with the nervous system (Extended Data Fig. 1a). We therefore produced 1.5 billion paired-end total RNA sequencing (RNA-seq) reads from four post-mortem brains to search for new splicing events in human long genes. Importantly, RNA abundance decreases linearly from the 5′ to 3′ end of long introns to create “saw-tooth” patterns in total RNA-seq data6 and these can be used to infer locations of major splicing events (Fig. 1c-d, Extended Data Figs. 2a, 3). We also performed crosslinking and immunoprecipitation (iCLIP) of the RNA-binding protein “fused in sarcoma” (FUS) in human brain. FUS binds across entire pre-mRNAs with limited sequence specificity7, permitting an independent examination of the saw-tooth patterns (Fig. 1d, Extended Data Fig. 3a-g).
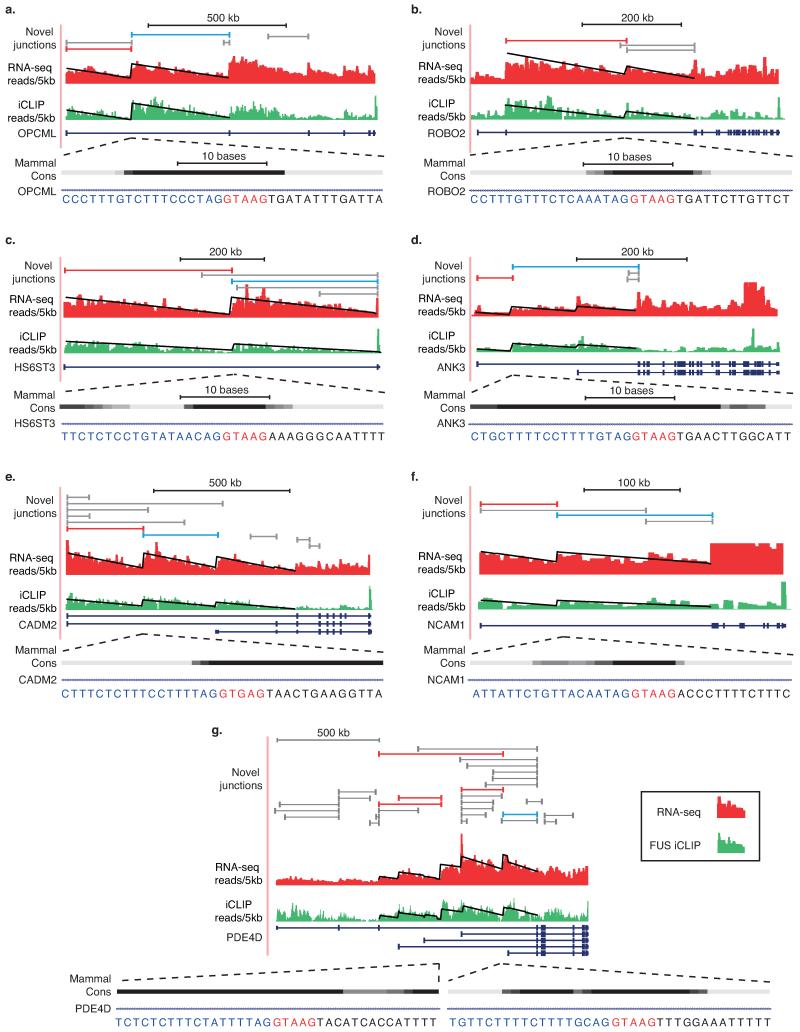
Cryptic splice sites can be identified from novel splice-junction reads in RNA-seq data (Extended Data Fig. 2c-e). We hypothesized that if some of these were major splicing events, they should cause significant deviations from the expected linear decrease of reads across long introns (Fig 1c-d). Analysis of our RNA-seq data identified 40163 unique, unannotated cryptic splice sites in introns >1 kb that contained either 5′ or 3′ splice site motifs, 419 of which conformed to the RS-site motif (Supplementary Table 1). We evaluated deviations from the expected saw-tooth pattern by establishing an analysis that computed the fit of linear regression slopes of each intron as a single unit or as two units separated at newly detected intra-intronic junctions (Fig. 1c-e, Extended Data Figs. 2a-b, 3). Since intron size is a critical determinant of our ability to reliably detect unexpected saw-tooth patterns, we restricted analysis to genes with at least one intron >150 kb. This identified 19 unique cryptic splice sites in the long introns of 14 genes that significantly improved the goodness-of-fit of the regression model in both RNA-seq and FUS iCLIP datasets. Of these, 9 had the RS-site motif whilst the remainder had a 3′ splice site motif (p<0.01 in both datasets, Fig. 1d-f, Supplementary Table 1). The genes containing these 9 RS-sites mostly function in cell adhesion and axon guidance and are linked to neurodevelopmental disorders (Supplementary Table 2).
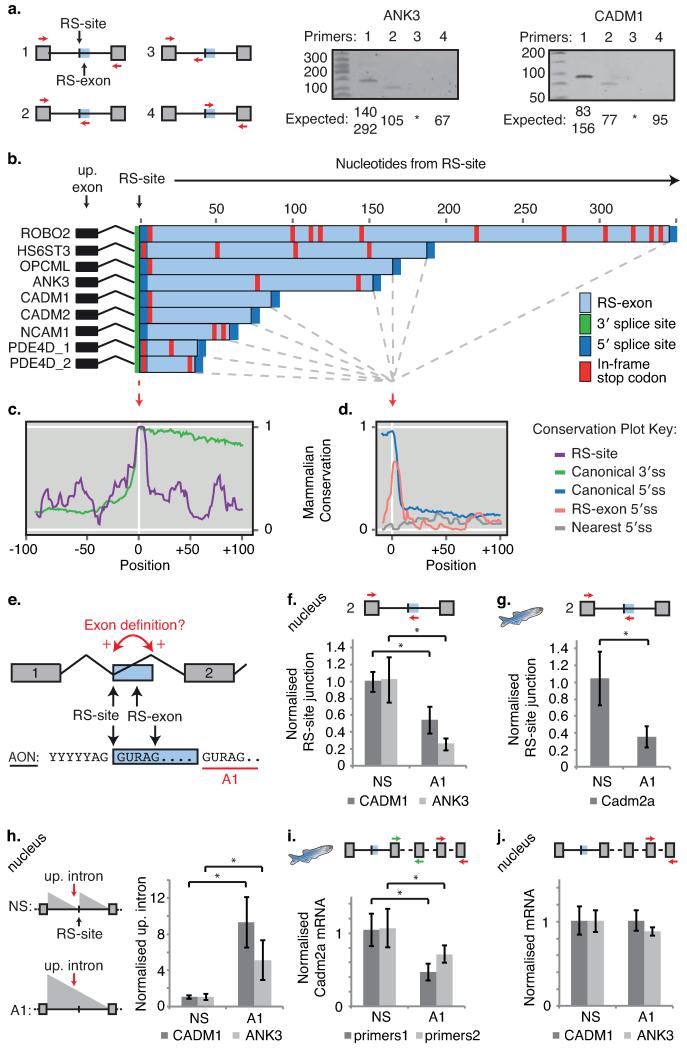
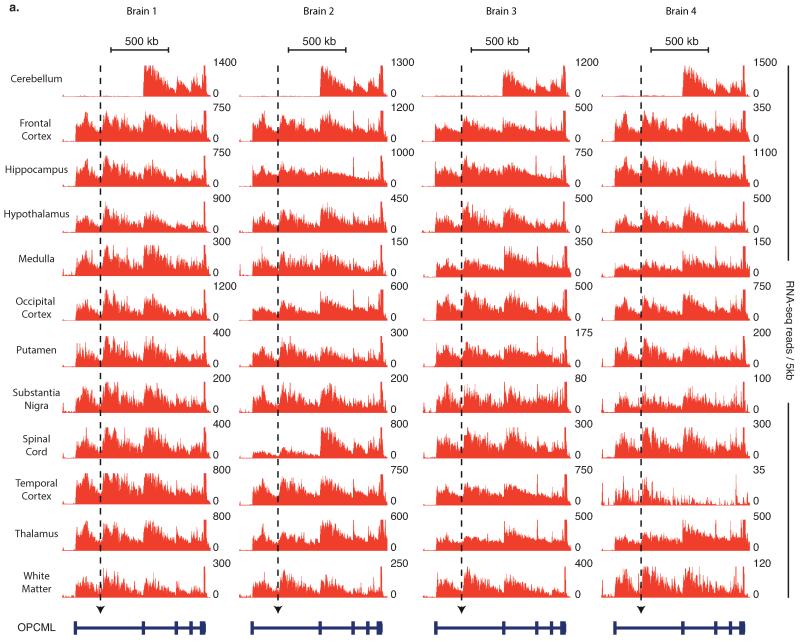
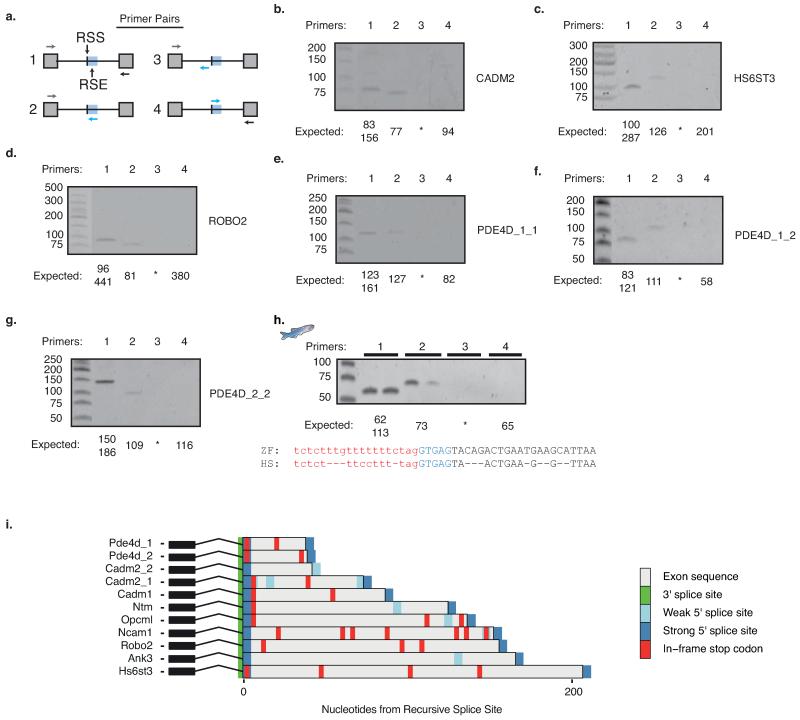
The 9 RS-sites occurred at transition points of intronic linear regression slopes in all four individuals and all brain regions profiled (Fig. 1d, Extended Data Figs. 3, 4). RT-PCR from a separate human brain confirmed splicing to 8 RS-sites at identical PCR cycle number as the mature mRNA, suggesting equal abundance, while no PCR products were observed when reverse primers were shifted upstream of RS-sites (Fig. 2a, Extended Data Fig. 5a-g).
Fig. 2. Recursive splicing requires initial definition of RS-exons.
a) RT-PCR validation of recursive splicing in ANK3 and CADM1 genes. b) Consensus splice site location and in-frame termination codons at RS-exons in indicated human genes. c-d) PhyloP conservation scores aligned at (c) RS-sites and (d) 5′ splice site of RS-exons. Conservation at the two nearest cryptic 5′ splice sites following RS-exons (“Nearest 5′ splice site”) and the canonical 5′ and 3′ splice sites in the same genes are also displayed. e) Schematic of the exon definition model and AON-A1 design strategy. f-g) qRT-PCR analysis of RS-site junctions in (f) human CADM1 and ANK3 genes (n=4 for NS, n=5 for AON-A1, 2 separate experiments) or (g) zebrafish cadm2a gene following treatment with AON-A1 (n=7, 3 separate experiments). h) qRT-PCR analysis of intronic RNA upstream of RS-sites (up. intron) in CADM1 and ANK3 genes following treatment with AON-A1. Location of primer pair is indicated by red arrow in schematic, and expected changes in intronic abundance indicated by grey triangles (n=4 for NS, n=5 for AON-A1, 2 separate experiments). i) qRT-PCR analysis of zebrafish cadm2a mRNA using two separate primer sets targeting constitutive exons following in vivo injection of AON-A1 (n=7, 3 separate experiments). j) qRT-PCR analysis of human CADM1 and ANK3 mRNAs following 48 hr treatment with AON-A1. mRNA for both genes was assessed in nuclear fractions (n=4 for NS, n=5 for AON-A1, 2 separate experiments). For relevant panels, * represents p<0.05 determined by two-tailed student t-test and values are mean ± S.D. Unless indicated otherwise, primers are indicated by coloured arrows within schematics. Replicate data are shown in Source Data Fig. 2.
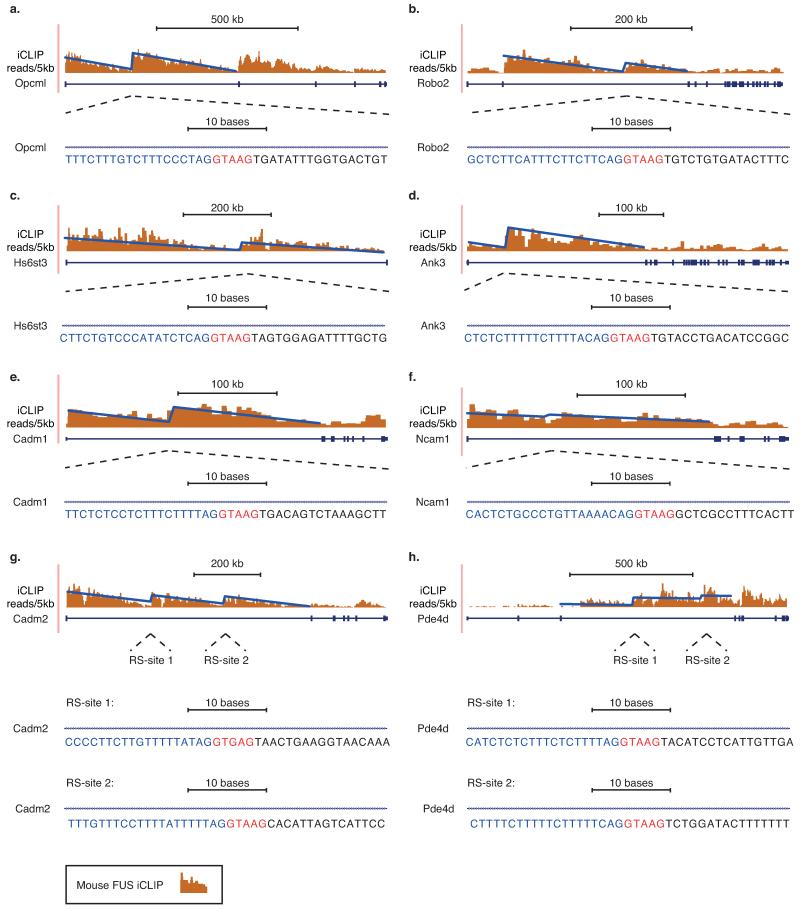
Notably, an alternative 5′ splice site is present downstream of each RS-site that could lead to inclusion of alternative exons (hereafter “RS-exons”, Fig. 2b). However, RS-exons were not detectable in mRNA transcripts at comparable PCR cycle numbers used to detect RS-site junctions (Fig. 2a, Extended Data Fig. 5a-g), arguing that RS-sites are being used for recursive splicing and not RS-exon inclusion. Despite RS-exon skipping, mammalian conservation of both the RS-sites and alternative 5′ splice sites following the RS-exons is comparable to that of canonical 5′ and 3′ splice sites (Fig. 2c-d, Extended Data Fig. 5i). Indeed, mouse Fus iCLIP regression patterns directly match conserved RS-sites (Extended Data Fig. 6a-h)7.
Splicing of most vertebrate exons requires exon definition8, where both splice sites flanking an exon are recognized in unison via interactions between U2AF proteins, SR proteins and U1/U2 snRNPs9 (Supplementary Information). We speculated that RS-exons co-evolved with RS-sites to enable exon definition (Fig. 2e). Accordingly, we masked the 5′ splice site following the CADM1 and ANK3 RS-exons in SH-SY5Y neuroblastoma cells using an antisense oligonucleotide (AON-A1; Fig. 2e). This dramatically reduced RS-site usage in both genes (Fig. 2f). We subsequently replicated this observation in vivo at the conserved RS-site/RS-exon of the zebrafish cadm2a gene (Fig 2g, Extended Data Fig. 5h). The reduced RS-site usage also led to a ~6-fold increase in abundance of the intronic region upstream of both human RS-sites, indicating a change in the saw-tooth pattern consistent with splicing of intron as a whole (Fig. 2h). Interestingly, the reduced RS-site usage caused a ~2-fold reduction in zebrafish cadm2a total mRNA (Fig. 2i), an effect not seen for the human CADM1 and ANK3 genes (Fig. 2j, Supplementary Information). Despite RS-exons usually being skipped, our findings demonstrate that RS-exon definition is crucial for the initial step of vertebrate recursive splicing (Figs. 2e, 4i).
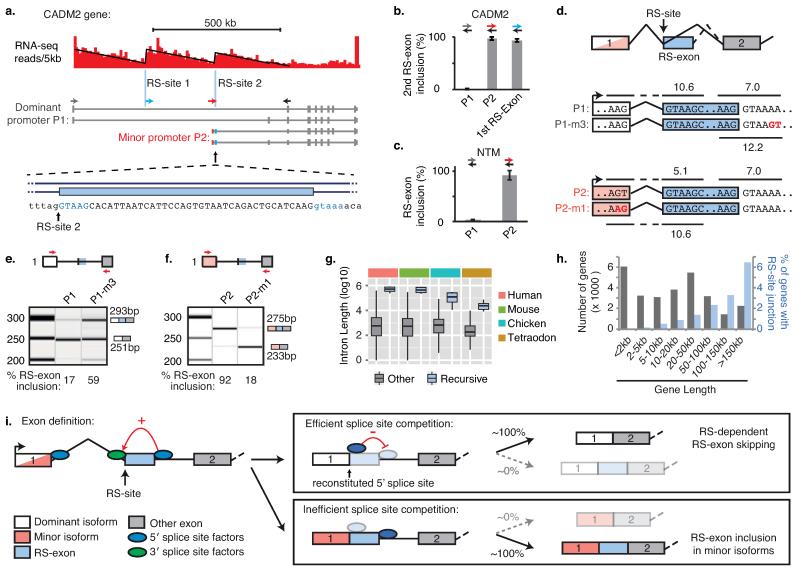
Fig. 4. Splice site competition allows a binary splicing switch for RS-exons.
a) RNA-seq read density patterns in the CADM2 gene shown in 5 kb windows, with linear regression performed after the first intron is split at the two RS-sites indicated with blue vertical lines. Isoforms expressed from the dominant and minor promoters in human frontal cortex tissue are shown, and primer locations used for (b) indicated by coloured arrows. Grey forward primer is located in the first exon of dominant isoform, blue forward primer is located in the first RS-exon (1st RS-exon), red forward primer is located in the first exon of alternative isoform (P2). Zoomed area represents the sequence at the start of the second RS-exon. b-c) RT-PCR analysis of RS-exon inclusion in (b) indicated CADM2 isoforms or (c) indicated NTM isoforms (n=4 and n=3 respectively, Extended Data Fig. 7). Values are mean ± S.D. d) Schematic of CADM2 splicing reporter variants P1 and P1-m3, based on the dominant CADM2 isoform (white), and P2 and P2-m1, based on the minor CADM2 isoform (red). Splice site scores for reconstituted and RS-exon 5′ splice sites are indicated. e-f) Qiaxcel analysis of indicated CADM2 splicing reporter products following transfection in SH-SY5Y cells (n=3 or n=4, 2 separate experiments). The expected size of PCR products is shown next to each electropherogram. g) Lengths of the 9 introns containing high-confidence RS-sites compared to other vertebrate introns. h) Histogram of human gene lengths plotted alongside the percentage of genes with RS-site-containing novel junctions. i) Schematic representation of the mechanism of recursive splicing and the binary splicing switch as described in main text. For relevant panels, replicate data are shown in Source Data Fig. 4.
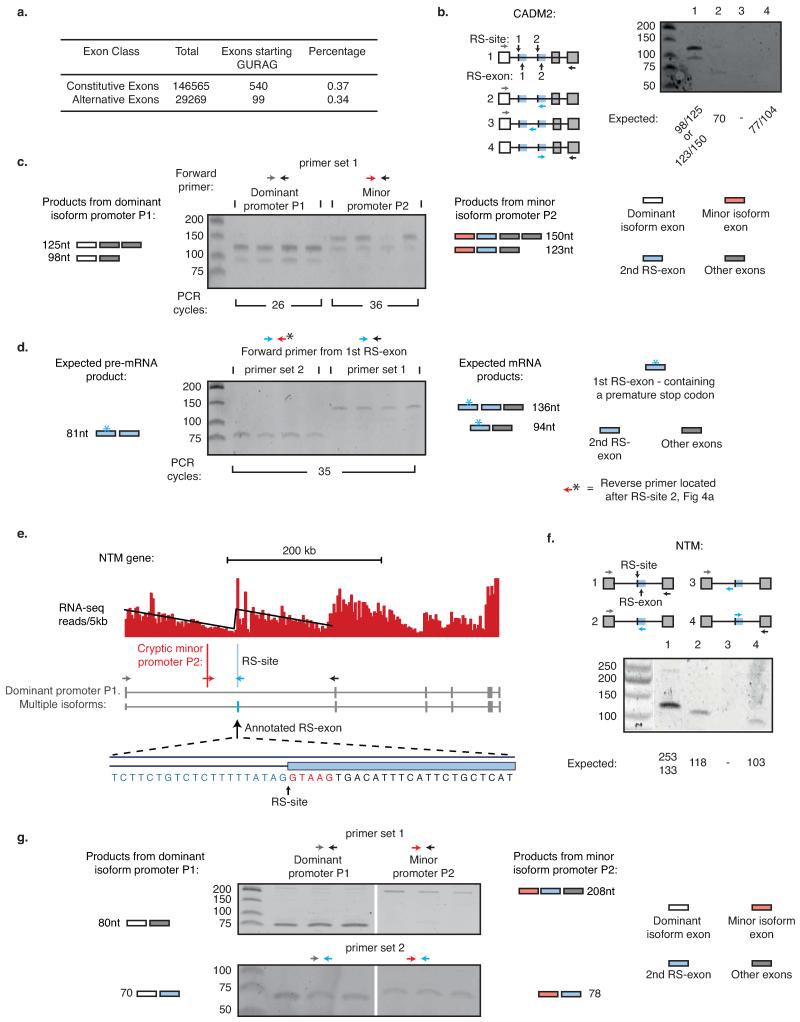
Since recursive splicing requires initial definition of an RS-exon, we questioned whether some annotated alternative exons might function as RS-exons. We found 99 candidate annotated RS-exons with RS-site sequences located precisely at their starts (Extended Data Fig. 7a). Splice-junction reads from brain RNA-seq data were present at the start of 16 of these exons despite evidence for exon skipping. These included exons in the CADM2 and NTM genes that significantly improved the goodness-of-fit of linear regression in RNA-seq and iCLIP datasets across their >150 kb introns (Fig. 4a, Extended Data Fig. 7e, Supplementary Table 1). We confirmed RS-site mediated exon-skipping in both genes by RT-PCR (Extended Data Fig. 7b,f). Thus, the first intron in CADM2 gene contains two RS-sites; the first followed by an unannotated RS-exon, and the second by an annotated RS-exon.
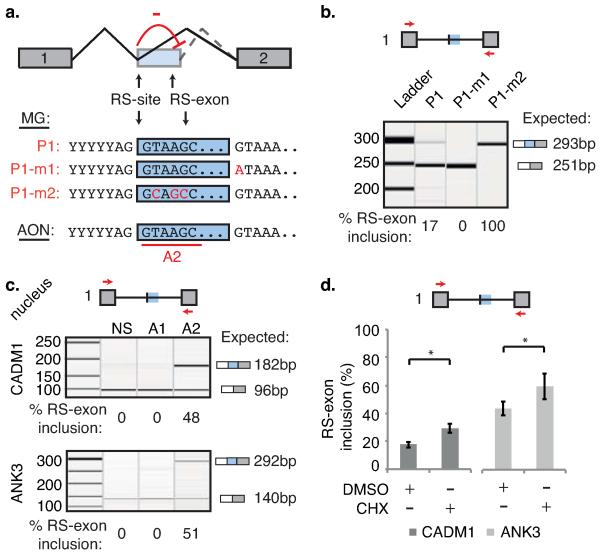
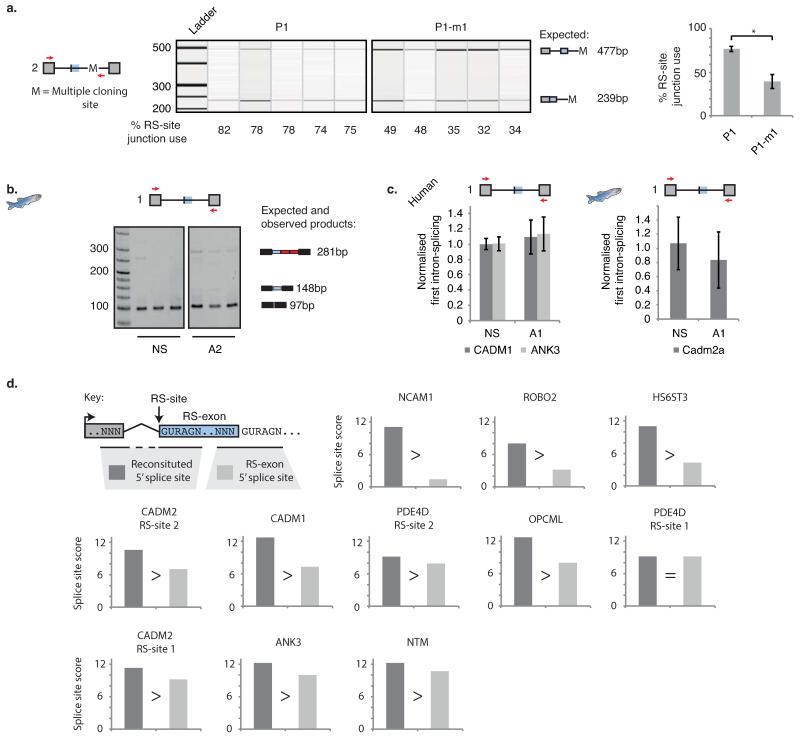
To further validate the exon definition mechanism, we established a splicing reporter containing the second CADM2 RS-site, the annotated RS-exon and its 5′ splice site, and the surrounding constitutive exons, each flanked by their nearest ~100 nt of CADM2 intronic sequence (P1; Fig. 3a). Despite the >500 kb long intron being reduced to ~0.5 kb, the reporter replicated findings of endogenous genes; 79% of mRNA isoforms skipped the RS-exon whilst RS-site usage was readily detected (Fig. 3b, Extended Data Fig. 8a). As expected given the need for exon definition to recognise RS-sites, mutating the 5′ splice site following the RS-exon greatly reduced RS-site usage, and the intron remained a single unit in most splicing intermediates (P1-m1, Fig. 3a-b, Extended Data Fig. 8a).
Fig 3. The reconstituted 5′ splice site is required for RS-exon skipping.
a) Schematic of splice site competition model, the CADM2 splicing reporter P1 variants, and AON-A2 design strategy. b-c) Qiaxcel analysis of (b) indicated CADM2 splicing reporter products following transfection in SH-SY5Y cells (n=3-5, 2 separate experiments), or (c) human CADM1 and ANK3 genes following 48hrs treatment with AON-A2 (n=4 for CADM1, n=5 for ANK3, 2 separate experiments). d) Quantification of CADM1 and ANK3 RS-exon inclusion following treatment with AON-A2 then DMSO or cycloheximide in SH-SY5Y cells (n=4, 2 separate experiments). For relevant panels, * represents p<0.05 determined by two-tailed student t-test and values are mean ± S.D. Primers used are indicated by red arrows in schematics. Replicate data are shown in Source Data Fig. 3.
Next, to examine why RS-exons are excluded from the mRNA, we mutated the CADM2 reporter’s RS-site to prevent formation of reconstituted 5′ splice site after the first splicing event (Fig. 1a). Strikingly, this resulted in complete inclusion of the RS-exon, implying competition exists between the two 5′ splice sites at either end of the RS-exon (P1-m2, Fig. 3a-b). To compare with endogenous genes, we designed AON-A2 to mask the section of RS-sites that contributes to the reconstituted 5′ splice site in the human CADM1, ANK3 or zebrafish cadm2a genes (AON-A2, Fig. 3a). Agreeing with the splicing reporter, AON-A2 dramatically increased RS-exon inclusion in all human and zebrafish experiments (Fig. 3c, Extended Data Fig. 8b). Collectively, this demonstrates that the RS-exon is skipped due to a splice site competition that leads to use of the reconstituted 5′ splice site instead of the 5′ splice site of the RS-exon (Figs. 3a, 4i, Supplementary Information).
We noticed that RS-exons typically contain one or more in-frame stop codons (Fig. 2b, Extended Data Fig. 5i), inclusion of which should prevent translation of full-length protein and target transcripts with preceding start codons to nonsense-mediated decay (NMD)10. We induced inclusion of the RS-exons in CADM1 and ANK3 by masking the 5′ splice site of their RS-sites with AON-A2, and then inhibited NMD by blocking translation with cycloheximide. This increased the proportion of isoforms containing the RS-exon (Fig. 3d), confirming that RS-exon inclusion can target transcripts for NMD and thus has potential to regulate transcript stability (Supplementary Information).
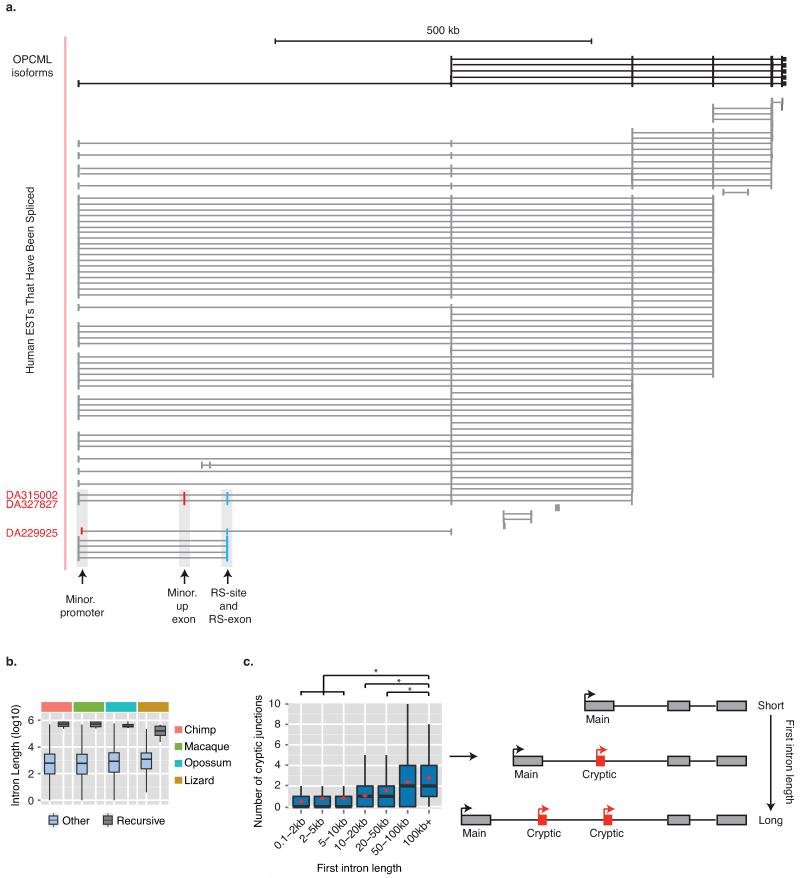
Having identified the mechanisms underlying vertebrate recursive splicing, we next explored the functions of RS-sites. Although D. melanogaster RS-sites have been proposed to maintain splicing integrity of long introns4, the assayed human and zebrafish long introns remained accurately spliced after recursive splicing inhibition with AON-A1 (Extended Data Fig. 8c). We therefore explored an additional hypothesis that RS-sites regulate inclusion of RS-exons under specific contexts. We identified minor isoforms in the CADM2 and NTM genes that use a different promoter, and were therefore not detected by our initial RT-PCR reactions. Their detection required 10 more amplification cycles compared to the dominant isoform, confirming that they are minor isoforms (Extended Data Figs. 7c-d, 7g). Surprisingly, RS-exons are completely included in these minor isoforms that have an alternative exon or promoter preceding the RS-site (Fig. 4a-c, Extended Data Fig. 7c-g). Similarly, the RS-exon is also detected in expressed sequence tags (ESTs) of minor OPCML isoforms that contain alternative exons preceding the RS-site (Extended Data Fig. 9a). A related splicing mechanism that coordinates alternative promoters with downstream alternative splicing was been observed in the human EPB41 and EPB41L3 genes, although this involves a reconstituted 3′ splice site to make it distinct from recursive splicing11.
To understand how preceding exons can dictate inclusion of RS-exons in a binary manner, we compared the computationally predicted strengths of the three relevant 5′ splice sites in CADM212; the 5′ splice sites reconstituted from the RS-site after its splicing to the preceding exon of either the dominant or minor isoforms, and the 5′ splice site of the RS-exon (Fig. 4d). We used the last three nucleotides of the preceding exon and the six nucleotides from the RS-site to calculate the scores of the reconstituted 5′ splice sites12. We found that the reconstituted 5′ splice site had a high score when the first exon is derived from the dominant promoter (10.6), a low score when derived from the minor promoter (5.1), whilst the 5′ splice site of the RS-exon had an intermediate score (7.0). This indicates that strength of the reconstituted 5′ splice site likely dictates whether the RS-exon is included or skipped. Indeed, 5′ splice sites reconstituted from the preceding exon of the dominant isoform in all 9 high-confidence RS-sites had equal or higher splice site scores than the 5′ splice sites of their corresponding RS-exons, in agreement with observed RS-exon skipping (Extended Data Fig. 8d, Supplementary Table 3).
To evaluate experimentally, we mutated the 5′ splice site of the CADM2 RS-exon in our splicing reporter such that its score was higher (12.2) than the reconstituted 5′ splice site of the dominant isoform (10.6, P1-m3, Fig. 4d). This mutation favored RS-exon inclusion (Fig. 4e). We then replaced the preceding exon of the dominant isoform with the one from the minor isoform. This led to complete inclusion of the RS-exon, re-capitulating behavior of the endogenous gene (P2, Fig. 4d,f). Finally, swapping the last three nucleotides of the preceding exon in the minor isoform to the sequence of dominant isoform led to RS-exon skipping, consistent with the higher score of the reconstituted 5′ splice site (10.6, P2-m1, Fig. 4d,f). These results reveal that the binary splicing switch is a consequence of the relative strengths of competing 5′ splice sites present after the RS-exon is spliced to the preceding exon.
Introns containing the high-confidence RS-sites are amongst the longest introns in all vertebrate species (Fig. 4g, Extended Data Fig. 9b). This includes Tetraodon nigroviridis, which has the shortest known vertebrate genome and otherwise contains very short introns13. Further, 8/9 of our high confidence RS-sites are located in the long first intron of the gene. We confirmed that long introns generally have an increased incidence of cryptic exons and noisy splicing14,15 by observing an increased incidence of cryptic junctions in our RNA-seq data in long first introns (Extended Data Fig. 9c). Since the majority of the 435 putative RS-sites identified in our study are present in the longest human genes (419 intronic loci, 16 annotated RS-exons, Fig. 4h), RS-sites are thus well positioned to couple inclusion of cryptic exons with RS-exons. As most RS-exons contain a premature stop codon, this may also allow quality control of the novel mRNA isoforms (Supplementary Information).
In summary, recursive splicing of long vertebrate genes involves two steps (Fig. 4i). First the RS-exon is defined, which requires its own 5′ splice site. Following splicing of the RS-exon to the preceding exon, a new 5′ splice site is reconstituted from the RS-site that competes with the 5′ splice site of the RS-exon. The strength of the reconstituted 5′ splice site determines whether the RS-exon is skipped via recursive splicing or included. Notably, the upstream exons of dominant isoforms reconstitute a strong 5′ splice site that leads to recursive splicing, whereas other alternative exons, which commonly emerge in long introns to produce minor isoforms, generally end in sequences that lead to RS-exon inclusion. In lieu of studies linking aberrant expression of long genes to neurologic diseases16-18, mutations or deletions around RS-sites may also contribute to human genetic diseases.
Methods
RNA-seq library preparation and sequencing
Brain samples for analysis were provided by the Medical Research Council Sudden Death Brain and Tissue Bank (Edinburgh, UK). Transcriptomic analysis of postmortem human tisue was approved by The National Hospital for Neurology and Neurosurgery & Institute of Neurology Joint Research Ethics Committee, UK (REC reference number 10/H0716/3). All four individuals sampled were of European descent, neurologically normal during life and confirmed to be neuropathologically normal by a consultant neuropathologist using histology performed on sections prepared from paraffin-embedded tissue blocks. Twelve central nervous system regions were sampled from each individual. The regions studied were: cerebellar cortex, frontal cortex, temporal cortex, occipital cortex, hippocampus, the inferior olivary nucleus (sub-dissected from the medulla), putamen, substantia nigra, thalamus, hypothalamus, intralobular white matter and cervical spinal cord.
RNA was extracted using Qiagen tissue kits (Qiagen, US), and quality controlled as detailed previously20. Libraries were prepared by the UK Brain Expression Consortium in conjunction with AROS Applied Biotechnology A/S (Aarhus, Denmark). In brief, 100 ng total RNA was used as input for cDNA generation using NuGen’s Ovation RNA-seq System V2 (NuGen Technologies, US). The RNA was processed according to the manufacturer’s protocol resulting in amplified cDNA from total RNA and concomitant de-selection of rRNA. Importantly, reverse transcription in this protocol is carried out using both oligo dT and random primers. This allowed total RNA profile patterns to be assessed with the latter and locations of splicing to be inferred. 1μg of the cDNA was fragmented using a Covaris S220 Ultrasonicator and the fragmented cDNA was used as the starting point for Illumina’s TruSeq DNA library preparation (Illumina, US). Finally, library molecules containing adapter molecules on both ends were amplified through 10 cycles of PCR. The libraries were sequenced using Illumina’s TruSeq V3 chemistry / HiSeq2000 and 100 base pair paired-end reads. The sequencing data was converted to fastq-files using Illumina’s CASAVA Software.
RNA-seq processing
Paired end RNA-seq data was mapped to the human genome (hg19) using STAR aligner (v 2.3) with default settings and known splice junctions from GENCODE21,22. For high-confidence RS-site junction detection, alignments were processed from all intronic regions >150 kb using an in-house processing pipeline implementing python (v2.7.2), Bedtools (v2.17.0) and R (v 3.0.0). This size limit was chosen since linear regression patterns could most readily be evaluated in such long introns (Extended Data Fig. 2a-b), and represented 943 introns in 780 genes (RefSeq release 60). Alignments from all 48 samples in >150 kb introns were combined and processed together unless indicated in the text. All spliced alignments with minimum flanking overhang of >10 nt (hereafter: “anchor”) and junction region exceeding 5 kb were selected and considered for further analysis. Each anchor sequence was then annotated to verify it conformed to a known splicing boundary (hereafter: exon anchor). All further analysis was done using only those novel junctions that had a single exon anchor (Extended Data Fig. 2c). Novel junctions were then ruled out if they were not detected across either multiple brain regions or in multiple patients. We subsequently asked whether intronic sequences immediately adjacent to the novel junctions contained pentamers found at 1% of all 5′ splice sites genome-wide (Extended Data Fig. 2d), or sequences located at 3′ splice sites (polypyrimidine tract consisting of >11 pyrimidines present in the region of −22 to −1, including YAG as last three positions; Extended Data Fig. 2e). Novel junctions within 418nt nucleotides of one another, the 95th percentile of exon lengths genome-wide, were considered in close enough proximity to have potential for exon formation. This analysis identified 2981 novel junctions in introns >150 kb; 979 joined an upstream exon to an intronic 3′ consensus splice site, 1296 joined an intronic 5′ consensus splice site with a downstream exon, and 353 pairs of junctions were proximally spaced in a manner that could form a novel exon (Supplementary Table 1 (Worksheet 1)). For low confidence RS-site junction detection in introns >1 kb, the same process was repeated in which alignments were now processed from all intronic regions >1 kb, and the minimum novel junction span was now 100 bp. RS-sites identified in this analysis were not tested with linear regression analysis due to shorter intron lengths having less reliable intronic read density profiles. In total 65173 un-annotated novel junctions were detected, 43229 of which joined intronic elements with consensus motifs of either 3′ or 5′ splice sites (Supplementary Table 1 (Worksheet 2)). Of these, 40163 were unique loci and 419 of them contained RS-site motifs. From these 419 unique and putative RS-sites, 48 were present in long gene introns.
iCLIP library preparation, sequencing and processing
FUS iCLIP experiments were performed as previously described23 with minor modifications. FUS iCLIP was performed with NB100-565 antibody (Novus Biologicals, US) at a concentration of 5 μg/mg on human brains, whilst FUS iCLIP from mouse brain was obtained from the previous study7. Sequencing was performed on either an Illumina GA-II or Illumina Miseq. The iCLIP libraries contained a 4-nt experimental barcode plus a 5-nt random barcode, which allowed multiplexing and the removal of PCR duplicates, respectively. The iCLIP data were mapped to hg19 using Bowtie24 and further processed as described previously23.
Computational analyses
All scripts used for the analyses in this paper are available at the Github repository (https://github.com/vplagnol/recursive_splicing).
Linear regression analysis
To establish the analysis of linear regression, each annotated intron greater than 50kb (in at least one Ensembl transcript) was first analyzed independently (Extended Data Fig. 2a-b). Following evaluation of different sized windows, we ultimately divided introns in to 5 kb bins. For both the RNA-seq and FUS iCLIP data, we then computed the number of read pairs mapping to each bin using samtools v0.19. We then ran a regression analysis with the number of mapped reads in each bin as a dependent variable. As a test, we first used this to examine genes containing multiple introns >50 kb. This showed that slopes of fitted regression lines were comparable for different long introns of the same gene (Extended Data Fig. 2a-b). Since the slope depends on transcriptional elongation rate, this observation agrees with the finding that transcription rate is relatively constant across individual genes25. We therefore assumed a constant (unconstrained) slope across each entire gene. Reducing the 5 kb bin size or the intron length cut-off reduced the reliability in the method, implying individual units of >50 kb are most appropriate for this computational analysis. Accordingly, when splitting introns into two separate parts based on novel junctions, we focused on >150 kb introns to adequately account for this size limit.
Next, for our baseline model, we coded the positions of all potential exons located in the >150 kb intron long gene introns (based on Ensembl annotations) using binary dummy variables and let the fitted read count data reset to an arbitrary value at each putative exon. We then considered for each intron a set of augmented models that include the same covariates at the baseline model (constant slope, dummy variable for potential exons) in addition to an additional dummy variable for each of the novel junctions identified by the split read analysis. We used a standard F test P-value to compare the fit between the baseline model and the augmented one in order to quantify the improvement of the goodness-of-fit provided by each additional potential RS-sites. Introns were eventually ranked on the basis of these F test P-values, with significance threshold for further analysis set at p<0.01 for both datasets (Supplementary Table 1 (Worksheet 3)). Taken together, the following filtering workflow was used in linear regression analysis for production of Fig. 1d:
-
1
Select novel junctions, which connect upstream exon to deep intronic loci.
Initial Junctions - 1378
-
2
Exclude junctions where gradient remains negative after strand correction.
Remaining - 1146
-
3
Selected lowest p-value for a junction if multiple introns overlap. Removed higher p-values since RNAseq has depth to identify most frequently used introns.
Remaining - 536
-
4
Plot after/before ratios. After/before ratios >1 correspond to increased slope, and <1 to reduced slope of linear regression line across intron.
-
5
Significance threshold set at p<0.01 for both FUS and RNA-seq.
Remaining 24 junctions
-
6
Select junctions with after/before ratio of >1 in both datasets.
Remaining 21 junctions - Indicated by YES in column AF of Supplementary Table 1 (Worksheet 3).
Alternative GURAG exon analysis
All alternative exons within the UCSC Alt events track were evaluated for GURAG pentamers at their start. Two lines of evidence were then pursued to evaluate their use as RS-exons. First, we asked if exons overlapped intronic read transition points despite being skipped. Linear regression analysis was performed on all alternative exons from UCSC Alt Events table which fell within an Ensembl transcript and would have flanking introns both >50 kb (Supplementary Table 1 (Worksheet 4)). Analysis was performed using both RNA-seq and FUS datasets. Identified GURAG exons were matched to these results to determine candidate exons which show high levels of inclusion. These were subsequently followed up through evaluation of junction counts between these exons and both upstream and downstream exons within RNA-seq data, and additionally junctions between the upstream and downstream exons in which the GURAG exon would be skipped. Limited evidence for recursive splicing was considered a double-significance in linear regression analysis, but junction counts indicating that the skipped product dominates.
Second, we asked whether these GURAG exons made regular contact with upstream exons with which they are not expected to junction (based on known gene isoforms). This could imply that the junction is used, but the GURAG exon is not included, leading to absence of isoform annotation. To identify known or novel junctions between the 99 GURAG alternative exons and upstream exons, we evaluated all junctions in RNA-seq data that were made between the identified 99 cassette exons and any annotated upstream exon (Supplementary Table 1 (Worksheet 5)). Each junction was then enumerated and classified as “known” or “novel” using the knowngene UCSC annotations. If a junction was not present in this annotation database and subsequently classed as novel, then this was considered limited evidence for recursive splicing. Examples were subsequently considered high confidence if splicing patterns inferred from the aforementioned analysis of total RNA-seq read density patterns suggested frequent use of the novel junction. Combined, these analyses identified 16 putative annotated RS-exons, two of which (in the CADM2 and NTM genes) we further experimentally validate.
Cryptic element analysis
In order to perform this analysis while limiting duplication of the same exon due to multiple transcripts, RefSeq annotations were refined to include only those transcripts defined as canonical by UCSC knowngene table. Intersection of both annotation databases identified 21531 second exons common to both databases. Of these, 798 were subsequently removed due to a lack of evidence of gene expression across all brain regions based on gene-derived RNA-seq FPKM values. For the remaining 20733 second exons, upstream intronic regions were searched for all junctions connecting these exons to any upstream elements (Supplementary Table 3 (Worksheet 1)). Junctions were classified according to the nature of the upstream elements. Specifically we separated into three categories; “exon-exon” represented junctions between the canonical first exon and second exon, “isoform” represented junctions between an alternative first exon and the second exon that are present in UCSC/RefSeq/GENCODE databases, and “novel” represented entirely unexpected junctions between intronic elements in the UCSC/RefSeq/GENCODE databases that junction to the second exon. We restricted our final analysis of cryptic upstream elements to the 6619 genes in which a canonical exon-exon junction was detected which accordingly span the full-length of the canonical first intron. The number of novel junctions to cryptic upstream elements were then counted in these genes, with genes grouped in bins based on the length of the canonical first intron. To avoid overlap with non-canonical minor transcripts, “isoform” junctions were not considered. Significance between bins was determined using the Mann-Whitney U test with two tails.
To evaluate cryptic element usage to all 142 candidate RS-sites (high confidence targets, all cassette exons starting with GURAG, and novel junctions detected that were consistent with RS-sites but failed to meet significance in linear regression analysis), the upstream gene body of candidate RS-sites genes were searched for all junctions present within brain RNA-seq libraries that connected these candidate RS-sites to any upstream elements (Supplementary Table 3 (Worksheet 2)). Junctions were then classified according to the nature of the upstream elements. Specifically we asked whether the junction was to an annotated upstream exon or cryptic exon/promoter.
Gene expression comparisons
For tissue-specific gene expression comparisons in Extended Data Fig. 1, RNA-seq data from 16 human tissues obtained by the Illumina Human Body Map Project (GEO series accession number GSE30611) and RNA-seq data from 12 human tissues collected as part of the Genotype Tissue Expression (GTEX) Project (http://www.gtexportal.org) were mapped to hg19 genome with TopHat226. For the cell line comparisons mapped in the same way to either hg19 or mm9, data was collected from the following sources: myoblast differentiation (mm9, GEO series accession number GSE20846), erythropoiesis (hg19, GEO series accession number GSE40243), motor neuron differentiation (mm9, GEO series accession number GSM1346027). Mean expression values across replicates was calculated using DESeq19. Tissue-specific comparisons were made between the brain and all other individual tissues for all protein coding genes. For cell-specific comparisons, differentiated cells were compared to un-differentiated cells in respective datasets. Log2-fold expression changes were plotted as a function of gene length. In incidences where multiple gene lengths were reported for a given gene, the maximum gene length was used.
Cross species intron lengths
To determine cross-species intron lengths, all human RefSeq genes were mapped to indicated species using the xenoRefGene track. Corresponding intron lengths were determined using exon start and exons end coordinates from all single-mapping transcripts. Identical introns found across multiple transcripts of the same gene were collapsed into a single unique intron for analysis so not to be counted multiple times.
GO term analysis
The GO term associated with >150 kb human UCSC genes analyzed by Gorilla27 using two unranked lists of genes. UCSC genes >150 kb were used as targets, while all UCSC genes were used as background. For visualization, GO terms with > 1E−3 FDR q-value or less than 2-fold enrichment were omitted.
Motif analysis
Sequence analysis around novel junction intronic loci was performed using WebLogo28. Recursive exon maps were generated by string matching consensus 5′ splice sites and stop codons to regions following RS-sites after considering open reading frame of upstream RefSeq exons. Strong consensus splice sites were considered GTAAG, GTGAG, GTAGG, GTATG (Fig. 2b, Extended Data Fig. 5i). Weak consensus splice sites are GTAAA, GTAAT, GTGGG, GTAAC, GTCAG, GTACG (Extended Data Fig. 5i).
Splice site score calculation
MaxEntScan was used as previously described using the First-order Markov Model setting by adding the last three nucleotides of the exon and the first 6 nucleotides of the 5′ splice site12. Competing splice site scores are presented in Supplementary Table 3 (Worksheet 3) and Extended Data Fig. 8d.
Conservation scores
For conservation scores, the 46-way placental mammal conservation by PhastCons track on the UCSC genome browser was used (phastCons46wayPlacental). Conservation scores were obtained for a given region using table browser, and mean scores calculated after alignment to specified features. Conservation was calculated at RS-sites (n=9), at 5′ splice sites downstream of RS-exons (n=9), at 5′ and 3′ splice sites flanking constitutive exons in genes containing RS-sites (n=130), and at the next two nearest 5′ splice sites downstream of RS-exons (n=18).
Cell culture
SH-SY5Y cells (ATTC, CRL-2266) were cultured at 37°C, 5% CO2 in Dulbecco’s Modified Essential Medium (Life technologies, US) supplemented with 10% Fetal Bovine Serum. For all treatments in this cell line, cells were seeded to be 70-80% confluent at the day of transfection in 6-well plates.
For antisense oligonucleotide (AON) treatment, cells were transfected at 24 hr with 10 μM of stated AON using Endo-porter transfection reagent (Gene-tools, US) as per manufacturers instructions. At 48 hr post-transfection cell media was removed and cells lysed and RNA extracted with Qiazol. All AONs were purchased from Gene-tools, US, and carried morpholino modifications. Sequences used were:
| CADM1: | |
| AON NS: | CCTCTTACCTCAGTTACAATTTATA |
| AON-A1: | AGCACACATGAGAAGTATGACTTAC |
| AON-A2: | ATCCAAGCATAAGATTGTCACTTAC |
| ANK3: | |
| AON NS: | CCTCTTACCTCAGTTACAATTTATA |
| AON-A1: | TTTAAAATGGAAAACCAGCACTTAC |
| AON-A2: | AATGGCCAATGCCAAGTTCACTTAC |
For cycloheximide treatment after AON-A2 transfection, cells were seeded to be 50-70% confluent at the day of transfection and were treated at 48 hr (first experiment) or 36 hr (second experiment) with either 100 μg/ml of cycloheximide dissolved in DMSO, or an equivalent volume of DMSO alone. At 6 hr post-treatment cell media was removed and cells lysed and RNA extracted using Qiazol (Qiagen, US).
Zebrafish AON treatments
Zebrafish experiments were performed by injecting 1 ng of AON (Gene-tools, US)into the yolk of 1 cell-stage embryos. Embryos were grown at 28.5 °C and were collected at 2 days post-fertilisation for RNA extraction.
AON NS: CCTCTTACCTCAGTTACAATTTATA
AON-A1: GTGGAAAAAAATACCCAAGACTCAC
AON-A2: AATGCTTCATTCAGTCTGTACTCAC
Splicing reporter design
The CADM2 splicing reporter mini-gene (P1) was designed such that the RS-exon following the second CADM2 RS-site was flanked by two short introns and the surrounding CADM2 constitutive exons (Supplementary Table 4). Introns consisted of the first ~100nt and last ~100nt of respective introns separated by multiple cloning sites. Constitutive exons were flanked by HindIII and EcoRI sites respectively. Constructs were sub-cloned into the pcDNA3 multiple cloning site of the pBluescript plasmid using HindIII and EcoRI sites. Construct P2 was subsequently generated by removing the dominant first CADM2 exon and first ~100 nt of intron present in construct P1 with HindIII and FseI, and subcloning a separate synthetic gene product into the digested plasmid. This synthetic gene product consisted of the alternative first exon and first ~100 nt of the corresponding intron. Sequences of synthetic gene products can be found in Supplementary Table 4. Mutations to both mini-gene variants were made by cross-over PCR using construct P1 or P2 as targets and primers listed in Supplementary Table 4.
Cell fractionation
For nuclear-cytoplasmic fractionation of cell lines, samples were suspended in 1 ml cytoplasmic lysis buffer (50 mM Tris-HCl pH 7.4, 10 mM NaCl, 0.5% NP-40, 0.25% Triton X-100, 1 mM EDTA, 1/200 volume of RNAsin and 1/100 vol of protease inhibitor cocktail) and homogenized by pipetting. Sample was spun for 3 min at 3000xg. Supernatant was collected as the cytoplasmic fraction and subjected to a further spin at 10000xg for 10 min. Supernatant was removed and RNA extracted using Trizol LS (Life technologies, US) and the Zymogen RNAdirect extraction kit (Zymogen, US) as per manufacturers instructions. The pellet from the initial spin was retained as the nuclear fraction and lysed using Qiazol before RNA was extracted using the Zymogen RNAdirect extraction kit (Zymogen, US) as per manufacturer’s instructions.
RNA extraction
For cell culture experiments Qiazol (Qiagen, US) suspended RNA was extracted using the Zymogen RNAdirect extraction kit (Zymogen, US) as per manufacturer’s instructions. For brain total RNA extraction and zebrafish tissue total RNA extraction, tissue was first suspended in Qiazol (Qiagen, US) and homogenized using a TissueRuptor (Qiagen, US). RNA was then extracted using the Zymogen RNAdirect extraction kit (Zymogen, US) as per manufacturer’s instructions.
RT-PCR analysis
All RNA was reverse transcribed using the high capacity cDNA synthesis kit (Applied Biosystems, US) using random primers and standard protocol. A total of 1μg was used in each reaction and cDNA then diluted according to downstream application. For RT-PCR samples were diluted 1:5 and 1 μl used for each subsequent PCR reaction. For qPCR samples were diluted 1:10 and 5 μl used for each subsequent PCR reaction.
For RT-PCR analysis, 10 ng cDNA was amplified using 2X Phusion PCR mastermix (Thermo-scientific) as per manufacturer’s instructions and each primer at a final concentration of 0.5 μM. Products were run on pre-cast 6% TBE gels (Life Technologies, UK) using low molecular weight marker (New England Biolabs, US) or Hyperladder V (Bioline, UK) as a ladder. Where exon inclusion was determined from RT-PCR images, band intensity of expected product sizes were determined using ImageJ software and expressed as a percentage of total intensity for all expected bands with indicated primers.
For Qiaxcel analysis cDNA was amplified with 2X Phusion PCR mastermix (Thermo-scientific) as per manufacturer’s instructions and each primer at a final concentration of 0.5 μM. Samples were subsequently purified using QIAquick PCR Purification Kit and loaded onto a Qiaxcel DNA cartridge (Qiagen, US) and run next to a 50-800 bp DNA marker (Qiagen, US) on the Qiaxcel machine (Qiagen, US) as per manufacturer’s instructions.
For qPCR analysis, 25 ng of cDNA was amplified using SYBR green PCR mastermix (Applied Biosystems, US) and each primer at a final concentration of 0.165 μM. PCR was carried out using an Applied Biosystems 7900HT machine (Applied Biosystems, US) as per manufacturer’s instructions and quantification assessed according to standard curves generated for each primer. Signal for each interrogated junction in qPCR analysis of human genes is normalized to GAPDH and/or EIF4A2 gene expression, and in zebrafish to β-actin1 and eif4a gene expression.
Primer sequences used for RT-PCR analysis and expected product sizes can be found in Supplementary Table 4.
Extended Data
Extended Data Fig. 1. Long gene expression is enriched in the brain.
a) GO term analysis of genes >150 kb relative to all human genes. All GO terms are associated with enrichment scores >2. b) Log2-fold gene expression ratios following differential expression sequencing (DESeq)19 analysis of all human protein-coding genes between the brain and all other tissues. Data are represented as Loess smoothing curves after the genes by their maximum length in kb. Hashed vertical line indicates 150 kb gene length. RNA-seq data was obtained from the GTEX consortium. c) Individual scatterplots used to create panel (Fig. 1b) and representing differential expression sequencing (DESeq)19 analysis of individual genes within indicated tissues compared to the brain. Red dots indicate genes that contain RS-sites, blue dots indicate dystrophin and black dots indicate titin (two long genes most highly expressed in muscle tissues). Grey dots are all remaining genes. d) Differential expression sequencing (DESeq)19 analysis of individual gene expression after and before differentiation of C2C12 mouse myoblasts (GSM521256) into myogenic lineage (GSM521259)29, after or before differentiation of mouse embryonic stem cells (GSM1346027) into motor neurons (GSM1346035)30, or after or before differentiation of hematopoietic stem cells (GSM992931) into erythroid lineage (GSM992934)31. Loess smoothing curves are shown after sorting the genes by their maximum length in kb. Hashed vertical line indicates 150 kb gene length.
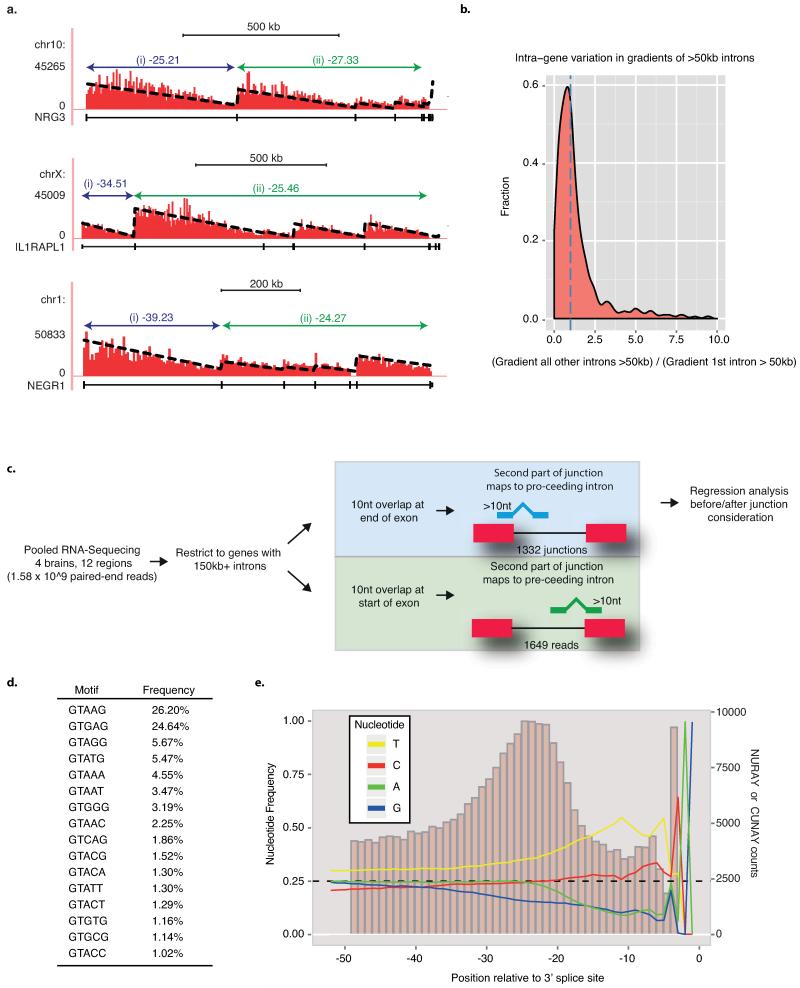
Extended Data Fig. 2. Linear regression analysis and novel junction sequence considerations used to identify mammalian recursive splice sites.
a) Examples of RNA-seq read density patterns for three genes together with their calculated gradients across the (i) first intron >50 kb and (ii) the average across all other >50 kb long introns within the same gene. Gradients represent the change in summated read count every 5 kb since RNA-seq reads are grouped in 5 kb windows and linear regression performed on resulting histograms. b) Density plot indicating the ratio of gradients of all other >50 kb introns within the same gene: the gradient of the first intron >50 kb. Blue hashed line represents ratio of 1. This would indicate that gradients for long introns within the same gene are comparable and transcription is proceeding at a largely constant rate. c) Schematic of the bioinformatics pipeline used to identify novel junctions. d) Ranking of human 5′ splice site pentamer usage genome-wide. e) Nucleotide usage frequency at human 3′ splice sites genome-wide, and branch-point positioning relative to 3′ splice site genome-wide.
Extended Data Fig. 3. Inferred splicing patterns identify recursive splice sites within mammalian >150 kb intron genes.
RNA-seq (red) read density patterns and normalized FUS iCLIP (green) cross-link density patterns for the a) OPCML b) ROBO2 c) HS6ST3 d) ANK3 e) CADM2 f) NCAM1 g) PDE4D genes within human brains. RNA-seq reads and normalized FUS iCLIP cross-links are grouped in 5 kb windows. RefSeq introns >150 kb were searched for novel junctions and linear regression performed on all Ensembl introns >50 kb in which novel junctions were located. Gene isoforms displayed are those including introns within which significant junctions were identified. Red novel junctions represent significant improvements in goodness-of-fit in both RNA-seq and FUS regression analysis (p<0.01 in both datasets, F-test). Blue novel junctions contact RS-exons. Grey novel junctions weren’t deemed significant following regression analysis. Zoomed area represents sequence at deep intronic loci surrounding novel junction. Phylo-P conservation track indicates sequence conservation across 46 levels of mammalian evolution.
Extended Data Fig. 4. Inferred recursive splicing patterns in the OPCML gene across four separate brains.
a) RNA-seq read density patterns for the OPCML gene across 12 different regions of four separate brains. Gene isoform displayed is that which included the long first intron within which a significant novel junction was identified. RNA-seq reads are grouped in 5 kb windows. Dotted arrows indicate location of experimentally derived RS-site.
Extended Data Fig. 5. RT-PCR confirmation of RS-sites in human and zebrafish samples, and prediction of mouse RS-exons.
a) Schematic of primer design used for RT-PCR validation of novel junctions. b-g) RT-PCR analysis of b) CADM2 c) HS6ST3 d) ROBO2 e) PDE4D_1_1 f) PDE4D_1_2 g) PDE4D_2_2 genes around RS-sites using indicated primers. For PDE4D sites, first number after gene name indicates RS-site studied, second number indicates the upstream exon used. See Extended Data Fig. 3g for junctions detected. h) RT-PCR analysis of cadm2a RS-site junction in adult male and female zebrafish embryos, together with an alignment of zebrafish (ZF) cadm2a RS-site to human (HS) CADM2 RS-site. i) Map of consensus splice site location and in-frame termination codons following RS-sites in indicated human genes. Strong consensus splice sites are GTAAG, GTGAG, GTAGG, GTATG. Weak consensus splice sites are GTAAA, GTAAT, GTGGG, GTAAC, GTCAG, GTACG.
Extended Data Fig. 6. Conservation of inferred recursive splicing patterns in the mouse brain.
Normalized FUS iCLIP read density patterns for the a) Opcml b) Robo2 c) Hs6st3 d) Ank3 e) Cadm1, f) Ncam1 g) Cadm2 h) Pde4d genes within the mouse brain. Normalized FUS iCLIP cross-link sites are grouped in 5 kb windows, and the displayed linear regression lines were computed on resulting histograms. Zoomed area at deep intronic loci represents RS-site sequences conserved from humans to mouse.
Extended Data Fig. 7. Promoter-dependent inclusion of RS-exons in CADM2 and NTM genes.
a) Number of cassette and constitutive exons starting with motif GURAG. b-d) RT-PCR of CADM2 gene in the frontal cortex using primers indicated in (b) or Fig. 4a. RT-PCR was carried out on one (b) or four (c-d) human brains. In (c), the inclusion of the second RS-exon occurs together with the minor promoter. Two bands are present for both PCR reactions due to the presence of an alternatively spliced exon following the RS-exon. This can result in two distinct long or short isoforms. In (d), the inclusion of the 2nd RS-exon occurs when the 1st RS-exon is included. Schematics in (c-d) represent examined splicing products together with expected length of products. e) RNA-seq read density patterns for the NTM gene and expected human isoforms. RNA-seq reads are grouped in 5 kb windows and linear regression performed on resulting histograms. A cryptic minor promoter/exon detected by RNA-seq is indicated by vertical red line. The annotated RS-exon is indicated by the vertical blue line. Zoomed area represents RS-site sequence at start of the annotated RS-exon. Primers to assess the major and minor promoter products associated with the RS-exon are indicated by coloured arrows. f) RT-PCR of NTM gene around RS-exon using indicated primers. g) RT-PCR analysis of NTM products in which the upstream exon is either derived from the major upstream promoter or the cryptic upstream promoter/exon. RT-PCR was performed in the frontal cortex of three human brains using primer sets indicated by coloured arrows in (e). Schematics represent possible splicing products together with expected length of products. Upper panel assess RS-exon inclusion, lower panel assesses RS-site junction detection.
Extended Data Fig. 8. Recursive splicing regulates the alternative splicing of RS-exons.
a) Qiaxcel analysis and quantification of the splicing intermediates of indicated CADM2 splicing reporter products following transfection in SH-SY5Y cells. Primers used are indicated by red arrows in schematic, together with expected products and their sizes. b) RT-PCR analysis of the zebrafish cadm2a mRNA following in vivo injection of AON-2. Sequencing reveals RS-exon inclusion results in subsequent splicing to additional downstream cryptic elements before the second exon, explaining why RS-exon included product size is larger than expected. c) qRT-PCR analysis of exon-exon junctions surrounding the RS-site containing introns following AON-A1 mediated inhibition of RS-site use of the human CADM1 and ANK3 genes (n=3, 1 experiment) or the zebrafish cadm2a gene (n=7, 3 separate experiments). d) Splice site scores of reconstituted 5′ splice sites following first step of recursive splicing vs. the 5′ splice sites of corresponding recursive exons.
Extended Data Fig. 9. Cryptic elements are frequent in long first introns.
a) UCSC annotated isoforms of the OPCML gene together with spliced ESTs detected across the OPCML locus. Recursive exon is marked in blue, and the preceding exons produced by minor promoter or cryptic splicing of the long first intron are marked in red. b) Lengths of the 9 introns containing the high-confidence RS-sites compared to other introns across vertebrates. Results are an extension of Fig. 4g. c) Boxplot showing the detected number of un-annotated alternative start exons which junction to the dominant second exon of brain expressed genes. Only novel junctions which do not match UCSC/GENCODE transcripts are considered for analysis. Genes are separated into bins based on the first intron length of the canonical isoform. Boxplot presents median, first and third quartile boundaries for each bin. Additional red diamonds indicate mean values for each bin. * represents significance in Mann-Whitney U tests, with significance set at p<10−10. Only tests between the 100 kb+ bin to other bins are displayed. Right panel shows cartoon of the implications of boxplot results.
Supplementary Material
Supplementary Table 1: Worksheets 1 and 2) Novel junction detection within introns (1) >150 kb or (2) in the human brain. “Recursive with poison exon” indicates two proximally spaced junctions consistent with exon formation which start with a RS-site but which either shift the transcript out-of-frame or contain a stop-codon in all three frames. “* Recursive with alternative exon” indicates two proximally spaced junctions consistent with exon formation which start with a RS-site but which do not shift the transcript out-of-frame or contain a stop-codon in all three frames. Note that this does not exclude that these are poison exons. Stop codons may be present in one or two of the frames, and this was also assessed at later stages of our workflow where necessary (see Fig. 2b). Worksheet 3) Linear regression analysis of long gene novel junctions formed between upstream exon and deep intronic loci performed on both RNA-seq and FUS iCLIP data. Significant values plotted in Fig. 1d are indicated by “YES” in column AF. Worksheets 4-5) Exons starting with GURAG pentamers were searched for supportive evidence suggestive of recursive splicing. Evidence includes (Worksheet 4) dominant saw-tooth pattern in the absence of counts that would suggest exon inclusion in mature transcripts, and (Worksheet 5) novel junctions to upstream exons which are not predicted in current UCSC or GENCODE gene annotations.
Supplementary Table 2: Functions and disease associations of high confidence RS-site containing genes.
Supplementary Table 3: Worksheet 1) RNA-seq junctions formed between elements within first introns and second exons. “Exon-exon” refers to the expected junction between the first exon and second exon, “isoform” refers to junctions between an exon in another UCSC transcript and the second exon, and “novel” refers to a junction between an intronic element and second exon, based on current UCSC/GENCODE/RefSeq annotations. Worksheet 2) Novel junctions detected from all candidate RS-sites. Candidate RS-sites are classified based on whether they are known cassette exons (Exon), linked to a poison (Poison) or alternative (Alternative) exon following novel junction analysis (see worksheet 1), or have not been detected in conjunction with an additional proximally spaced splice site that is suggestive of exon formation (Sing). Worksheet 3) Splice site scores of competing 5′ splice sites following the first step of recursive splicing. Results are represented diagrammatically in Extended Data Fig. 8d.
Supplementary Table 4: Worksheet 1) Splicing reporter mini-gene sequences used in this study that were designed around the CADM2 gene. P1 represents mini-gene with first exon coming from dominant long isoform of CADM2, P2 represents mini-gene with first exon coming from minor short isoform of CADM2. Primers indicated were used in overlapping PCRs to create mutant variants of indicated mini-genes. Worksheet 2) Primers used in this study together with expected product sizes.
Acknowledgements
We thank S. El-Andaloussi for technical support, and J. Witten, J. König and Ule lab members for comments on the manuscript. This work was supported by the European Research Council [206726-CLIP and 617837-Translate] to J.U.; Marie Curie Post-doctoral Research Fellowship [627783-NeuroCRYSP] to L.B.; the Slovenian Research Agency [J7-5460] to J. U. and T. C.; the UK NIHR Biomedical Research Centre at Moorfields Eye Hospital and UCL Institute of Ophthalmology to V.P. and W.E.; the Wellcome Trust to S.W. and A.F.; the UK Medical Research Council (MRC) [U105185858] to J.U.; MRC training fellowships to C.S. and M.B.; and MRC project grant [G0901254], MRC training fellowship [G0802462] and MRC Sudden Death Brain Bank to the members of UK Brain Expression Consortium: J. Hardy, M. Ryten, D. Trabzuni, S. Guelfi, K. D’Sa, M. Matarin, J. Vandrovcova, M.E. Weale, A. Ramasamy, J.A. Botia, C. Smith, P. Forabosco.
Footnotes
Author Information The sequencing data have been submitted to the European Genome-phenome Archive under the accession number EGAS00001001170 and the iCLIP data are available from http://icount.biolab.si/.
The authors declare no competing financial interests.
References
- 1.Burnette JM, Miyamoto-Sato E, Schaub MA, Conklin J, Lopez AJ. Subdivision of large introns in Drosophila by recursive splicing at nonexonic elements. Genetics. 2005;170:661–674. doi: 10.1534/genetics.104.039701. doi:genetics.104.039701 [pii]10.1534/genetics.104.039701. [DOI] [PMC free article] [PubMed] [Google Scholar]
- 2.Hatton AR, Subramaniam V, Lopez AJ. Generation of alternative Ultrabithorax isoforms and stepwise removal of a large intron by resplicing at exon-exon junctions. Mol Cell. 1998;2:787–796. doi: 10.1016/s1097-2765(00)80293-2. doi:S1097-2765(00)80293-2 [pii] [DOI] [PubMed] [Google Scholar]
- 3.Grellscheid SN, Smith CW. An apparent pseudo-exon acts both as an alternative exon that leads to nonsense-mediated decay and as a zero-length exon. Mol Cell Biol. 2006;26:2237–2246. doi: 10.1128/MCB.26.6.2237-2246.2006. doi:26/6/2237 [pii]10.1128/MCB.26.6.2237-2246.2006. [DOI] [PMC free article] [PubMed] [Google Scholar]
- 4.Shepard S, McCreary M, Fedorov A. The peculiarities of large intron splicing in animals. PloS one. 2009;4:e7853. doi: 10.1371/journal.pone.0007853. doi:10.1371/journal.pone.0007853. [DOI] [PMC free article] [PubMed] [Google Scholar]
- 5.Thakurela S, et al. Gene regulation and priming by topoisomerase IIalpha in embryonic stem cells. Nat Commun. 2013;4:2478. doi: 10.1038/ncomms3478. doi:ncomms3478 [pii]10.1038/ncomms3478. [DOI] [PubMed] [Google Scholar]
- 6.Ameur A, et al. Total RNA sequencing reveals nascent transcription and widespread co-transcriptional splicing in the human brain. Nat Struct Mol Biol. 2011;18:1435–1440. doi: 10.1038/nsmb.2143. doi:nsmb.2143 [pii]10.1038/nsmb.2143. [DOI] [PubMed] [Google Scholar]
- 7.Rogelj B, et al. Widespread binding of FUS along nascent RNA regulates alternative splicing in the brain. Sci Rep. 2012;2:603. doi: 10.1038/srep00603. doi:10.1038/srep00603. [DOI] [PMC free article] [PubMed] [Google Scholar]
- 8.Ke S, Chasin LA. Context-dependent splicing regulation: exon definition, co-occurring motif pairs and tissue specificity. RNA biology. 2011;8:384–388. doi: 10.4161/rna.8.3.14458. [DOI] [PMC free article] [PubMed] [Google Scholar]
- 9.Robberson BL, Cote GJ, Berget SM. Exon definition may facilitate splice site selection in RNAs with multiple exons. Mol Cell Biol. 1990;10:84–94. doi: 10.1128/mcb.10.1.84. [DOI] [PMC free article] [PubMed] [Google Scholar]
- 10.McGlincy NJ, Smith CW. Alternative splicing resulting in nonsense-mediated mRNA decay: what is the meaning of nonsense? Trends in biochemical sciences. 2008;33:385–393. doi: 10.1016/j.tibs.2008.06.001. doi:10.1016/j.tibs.2008.06.001. [DOI] [PubMed] [Google Scholar]
- 11.Yeo G, Burge CB. Maximum entropy modeling of short sequence motifs with applications to RNA splicing signals. Journal of computational biology: a journal of computational molecular cell biology. 2004;11:377–394. doi: 10.1089/1066527041410418. doi:10.1089/1066527041410418. [DOI] [PubMed] [Google Scholar]
- 12.Parra MK, Tan JS, Mohandas N, Conboy JG. Intrasplicing coordinates alternative first exons with alternative splicing in the protein 4.1R gene. EMBO journal. 2008;27:122–131. doi: 10.1038/sj.emboj.7601957. doi:10.1038/sj.emboj.7601957. [DOI] [PMC free article] [PubMed] [Google Scholar]
- 13.Jaillon O, et al. Genome duplication in the teleost fish Tetraodon nigroviridis reveals the early vertebrate proto-karyotype. Nature. 2004;431:946–957. doi: 10.1038/nature03025. doi:nature03025 [pii]10.1038/nature03025. [DOI] [PubMed] [Google Scholar]
- 14.Roy M, Kim N, Xing Y, Lee C. The effect of intron length on exon creation ratios during the evolution of mammalian genomes. Rna. 2008;14:2261–2273. doi: 10.1261/rna.1024908. doi:10.1261/rna.1024908. [DOI] [PMC free article] [PubMed] [Google Scholar]
- 15.Pickrell JK, Pai AA, Gilad Y, Pritchard JK. Noisy splicing drives mRNA isoform diversity in human cells. PLoS genetics. 2010;6:e1001236. doi: 10.1371/journal.pgen.1001236. doi:10.1371/journal.pgen.1001236. [DOI] [PMC free article] [PubMed] [Google Scholar]
- 16.Lagier-Tourenne C, et al. Divergent roles of ALS-linked proteins FUS/TLS and TDP-43 intersect in processing long pre-mRNAs. Nat Neurosci. 2012;15:1488–1497. doi: 10.1038/nn.3230. doi:10.1038/nn.3230. [DOI] [PMC free article] [PubMed] [Google Scholar]
- 17.Polymenidou M, et al. Long pre-mRNA depletion and RNA missplicing contribute to neuronal vulnerability from loss of TDP-43. Nat Neurosci. 2011;14:459–468. doi: 10.1038/nn.2779. doi:nn.2779 [pii]10.1038/nn.2779. [DOI] [PMC free article] [PubMed] [Google Scholar]
- 18.King IF, et al. Topoisomerases facilitate transcription of long genes linked to autism. Nature. 2013;501:58–62. doi: 10.1038/nature12504. doi:10.1038/nature12504. [DOI] [PMC free article] [PubMed] [Google Scholar]
Additional References
- 19.Anders S, Huber W. Differential expression analysis for sequence count data. Genome biology. 2010;11:R106. doi: 10.1186/gb-2010-11-10-r106. doi:10.1186/gb-2010-11-10-r106. [DOI] [PMC free article] [PubMed] [Google Scholar]
- 20.Trabzuni D, et al. Quality control parameters on a large dataset of regionally dissected human control brains for whole genome expression studies. Journal of neurochemistry. 2011;119:275–282. doi: 10.1111/j.1471-4159.2011.07432.x. doi:10.1111/j.1471-4159.2011.07432.x. [DOI] [PMC free article] [PubMed] [Google Scholar]
- 21.Dobin A, et al. STAR: ultrafast universal RNA-seq aligner. Bioinformatics. 2013;29:15–21. doi: 10.1093/bioinformatics/bts635. doi:10.1093/bioinformatics/bts635. [DOI] [PMC free article] [PubMed] [Google Scholar]
- 22.Harrow J, et al. GENCODE: the reference human genome annotation for The ENCODE Project. Genome research. 2012;22:1760–1774. doi: 10.1101/gr.135350.111. doi:10.1101/gr.135350.111. [DOI] [PMC free article] [PubMed] [Google Scholar]
- 23.Konig J, et al. iCLIP reveals the function of hnRNP particles in splicing at individual nucleotide resolution. Nat Struct Mol Biol. 2010;17:909–915. doi: 10.1038/nsmb.1838. doi:10.1038/nsmb.1838. [DOI] [PMC free article] [PubMed] [Google Scholar]
- 24.Langmead B, Trapnell C, Pop M, Salzberg SL. Ultrafast and memory-efficient alignment of short DNA sequences to the human genome. Genome biology. 2009;10:R25. doi: 10.1186/gb-2009-10-3-r25. doi:10.1186/gb-2009-10-3-r25. [DOI] [PMC free article] [PubMed] [Google Scholar]
- 25.Singh J, Padgett RA. Rates of in situ transcription and splicing in large human genes. Nat Struct Mol Biol. 2009;16:1128–1133. doi: 10.1038/nsmb.1666. doi:10.1038/nsmb.1666. [DOI] [PMC free article] [PubMed] [Google Scholar]
- 26.Kim D, et al. TopHat2: accurate alignment of transcriptomes in the presence of insertions, deletions and gene fusions. Genome biology. 2013;14:R36. doi: 10.1186/gb-2013-14-4-r36. doi:10.1186/gb-2013-14-4-r36. [DOI] [PMC free article] [PubMed] [Google Scholar]
- 27.Eden E, Navon R, Steinfeld I, Lipson D, Yakhini Z. GOrilla: a tool for discovery and visualization of enriched GO terms in ranked gene lists. BMC bioinformatics. 2009;10:48. doi: 10.1186/1471-2105-10-48. doi:10.1186/1471-2105-10-48. [DOI] [PMC free article] [PubMed] [Google Scholar]
- 28.Crooks GE, Hon G, Chandonia JM, Brenner SE. WebLogo: a sequence logo generator. Genome research. 2004;14:1188–1190. doi: 10.1101/gr.849004. doi:10.1101/gr.849004. [DOI] [PMC free article] [PubMed] [Google Scholar]
- 29.Trapnell C, et al. Transcript assembly and quantification by RNA-Seq reveals unannotated transcripts and isoform switching during cell differentiation. Nature biotechnology. 2010;28:511–515. doi: 10.1038/nbt.1621. doi:10.1038/nbt.1621. [DOI] [PMC free article] [PubMed] [Google Scholar]
- 30.Herrera FJ, Yamaguchi T, Roelink H, Tjian R. Core promoter factor TAF9B regulates neuronal gene expression. eLife. 2014;3:e02559. doi: 10.7554/eLife.02559. doi:10.7554/eLife.02559. [DOI] [PMC free article] [PubMed] [Google Scholar]
- 31.Madzo J, et al. Hydroxymethylation at gene regulatory regions directs stem/early progenitor cell commitment during erythropoiesis. Cell reports. 2014;6:231–244. doi: 10.1016/j.celrep.2013.11.044. doi:10.1016/j.celrep.2013.11.044. [DOI] [PMC free article] [PubMed] [Google Scholar]
- 32.Clark MB, et al. The reality of pervasive transcription. PLoS biology. 2011;9:e1000625. doi: 10.1371/journal.pbio.1000625. discussion e1001102, doi:10.1371/journal.pbio.1000625. [DOI] [PMC free article] [PubMed] [Google Scholar]
- 33.van Bakel H, Nislow C, Blencowe BJ, Hughes TR. Most “dark matter” transcripts are associated with known genes. PLoS biology. 2010;8:e1000371. doi: 10.1371/journal.pbio.1000371. doi:10.1371/journal.pbio.1000371. [DOI] [PMC free article] [PubMed] [Google Scholar]
- 34.Louro R, Smirnova AS, Verjovski-Almeida S. Long intronic noncoding RNA transcription: expression noise or expression choice? Genomics. 2009;93:291–298. doi: 10.1016/j.ygeno.2008.11.009. doi:10.1016/j.ygeno.2008.11.009. [DOI] [PubMed] [Google Scholar]
- 35.Robinson R. Dark matter transcripts: sound and fury, signifying nothing? PLoS biology. 2010;8:e1000370. doi: 10.1371/journal.pbio.1000370. doi:10.1371/journal.pbio.1000370. [DOI] [PMC free article] [PubMed] [Google Scholar]
- 36.Dreumont N, Maresca A, Boisclair-Lachance JF, Bergeron A, Tanguay RM. A minor alternative transcript of the fumarylacetoacetate hydrolase gene produces a protein despite being likely subjected to nonsense-mediated mRNA decay. BMC molecular biology. 2005;6:1. doi: 10.1186/1471-2199-6-1. doi:10.1186/1471-2199-6-1. [DOI] [PMC free article] [PubMed] [Google Scholar]
- 37.Sibley CR. Regulation of gene expression through production of unstable mRNA isoforms. Biochemical Society transactions. 2014;42:1196–1205. doi: 10.1042/BST20140102. doi:10.1042/BST20140102. [DOI] [PubMed] [Google Scholar]
- 38.Makeyev EV, Zhang J, Carrasco MA, Maniatis T. The MicroRNA miR-124 promotes neuronal differentiation by triggering brain-specific alternative pre-mRNA splicing. Mol Cell. 2007;27:435–448. doi: 10.1016/j.molcel.2007.07.015. doi:10.1016/j.molcel.2007.07.015. [DOI] [PMC free article] [PubMed] [Google Scholar]
- 39.Colak D, Ji SJ, Porse BT, Jaffrey SR. Regulation of axon guidance by compartmentalized nonsense-mediated mRNA decay. Cell. 2013;153:1252–1265. doi: 10.1016/j.cell.2013.04.056. doi:10.1016/j.cell.2013.04.056. [DOI] [PMC free article] [PubMed] [Google Scholar]
- 40.Zarnack K, et al. Direct competition between hnRNP C and U2AF65 protects the transcriptome from the exonization of Alu elements. Cell. 2013;152:453–466. doi: 10.1016/j.cell.2012.12.023. doi:10.1016/j.cell.2012.12.023. [DOI] [PMC free article] [PubMed] [Google Scholar]
- 41.Kondrashov FA, Koonin EV. Evolution of alternative splicing: deletions, insertions and origin of functional parts of proteins from intron sequences. Trends in genetics: TIG. 2003;19:115–119. doi: 10.1016/S0168-9525(02)00029-X. doi:10.1016/S0168-9525(02)00029-X. [DOI] [PubMed] [Google Scholar]
- 42.Modrek B, Lee CJ. Alternative splicing in the human, mouse and rat genomes is associated with an increased frequency of exon creation and/or loss. Nature genetics. 2003;34:177–180. doi: 10.1038/ng1159. doi:10.1038/ng1159. [DOI] [PubMed] [Google Scholar]
- 43.Makalowski W. Genomics. Not junk after all. Science. 2003;300:1246–1247. doi: 10.1126/science.1085690. doi:10.1126/science.1085690. [DOI] [PubMed] [Google Scholar]
- 44.Ermakova EO, Nurtdinov RN, Gelfand MS. Fast rate of evolution in alternatively spliced coding regions of mammalian genes. BMC genomics. 2006;7:84. doi: 10.1186/1471-2164-7-84. doi:10.1186/1471-2164-7-84. [DOI] [PMC free article] [PubMed] [Google Scholar]
- 45.Melamud E, Moult J. Stochastic noise in splicing machinery. Nucleic acids research. 2009;37:4873–4886. doi: 10.1093/nar/gkp471. doi:10.1093/nar/gkp471. [DOI] [PMC free article] [PubMed] [Google Scholar]
- 46.Draper BW, Morcos PA, Kimmel CB. Inhibition of zebrafish fgf8 pre-mRNA splicing with morpholino oligos: a quantifiable method for gene knockdown. Genesis. 2001;30:154–156. doi: 10.1002/gene.1053. [DOI] [PubMed] [Google Scholar]
- 47.Berget SM. Exon recognition in vertebrate splicing. The Journal of biological chemistry. 1995;270:2411–2414. doi: 10.1074/jbc.270.6.2411. [DOI] [PubMed] [Google Scholar]
- 48.Fairbrother WG, Yeh RF, Sharp PA, Burge CB. Predictive identification of exonic splicing enhancers in human genes. Science. 2002;297:1007–1013. doi: 10.1126/science.1073774. doi:10.1126/science.1073774. [DOI] [PubMed] [Google Scholar]
- 49.Cartegni L, Wang J, Zhu Z, Zhang MQ, Krainer AR. ESEfinder: A web resource to identify exonic splicing enhancers. Nucleic acids research. 2003;31:3568–3571. doi: 10.1093/nar/gkg616. [DOI] [PMC free article] [PubMed] [Google Scholar]
- 50.Ke S, et al. Quantitative evaluation of all hexamers as exonic splicing elements. Genome research. 2011;21:1360–1374. doi: 10.1101/gr.119628.110. doi:10.1101/gr.119628.110. [DOI] [PMC free article] [PubMed] [Google Scholar]
- 51.Popp MW, Maquat LE. The dharma of nonsense-mediated mRNA decay in mammalian cells. Molecules and cells. 2014;37:1–8. doi: 10.14348/molcells.2014.2193. doi:10.14348/molcells.2014.2193. [DOI] [PMC free article] [PubMed] [Google Scholar]
- 52.Obrig TG, Culp WJ, McKeehan WL, Hardesty B. The mechanism by which cycloheximide and related glutarimide antibiotics inhibit peptide synthesis on reticulocyte ribosomes. The Journal of biological chemistry. 1971;246:174–181. [PubMed] [Google Scholar]
- 53.Schneider-Poetsch T, et al. Inhibition of eukaryotic translation elongation by cycloheximide and lactimidomycin. Nature chemical biology. 2010;6:209–217. doi: 10.1038/nchembio.304. doi:10.1038/nchembio.304. [DOI] [PMC free article] [PubMed] [Google Scholar]
- 54.Rajavel KS, Neufeld EF. Nonsense-mediated decay of human HEXA mRNA. Mol Cell Biol. 2001;21:5512–5519. doi: 10.1128/MCB.21.16.5512-5519.2001. doi:10.1128/MCB.21.16.5512-5519.2001. [DOI] [PMC free article] [PubMed] [Google Scholar]
Associated Data
This section collects any data citations, data availability statements, or supplementary materials included in this article.
Supplementary Materials
Supplementary Table 1: Worksheets 1 and 2) Novel junction detection within introns (1) >150 kb or (2) in the human brain. “Recursive with poison exon” indicates two proximally spaced junctions consistent with exon formation which start with a RS-site but which either shift the transcript out-of-frame or contain a stop-codon in all three frames. “* Recursive with alternative exon” indicates two proximally spaced junctions consistent with exon formation which start with a RS-site but which do not shift the transcript out-of-frame or contain a stop-codon in all three frames. Note that this does not exclude that these are poison exons. Stop codons may be present in one or two of the frames, and this was also assessed at later stages of our workflow where necessary (see Fig. 2b). Worksheet 3) Linear regression analysis of long gene novel junctions formed between upstream exon and deep intronic loci performed on both RNA-seq and FUS iCLIP data. Significant values plotted in Fig. 1d are indicated by “YES” in column AF. Worksheets 4-5) Exons starting with GURAG pentamers were searched for supportive evidence suggestive of recursive splicing. Evidence includes (Worksheet 4) dominant saw-tooth pattern in the absence of counts that would suggest exon inclusion in mature transcripts, and (Worksheet 5) novel junctions to upstream exons which are not predicted in current UCSC or GENCODE gene annotations.
Supplementary Table 2: Functions and disease associations of high confidence RS-site containing genes.
Supplementary Table 3: Worksheet 1) RNA-seq junctions formed between elements within first introns and second exons. “Exon-exon” refers to the expected junction between the first exon and second exon, “isoform” refers to junctions between an exon in another UCSC transcript and the second exon, and “novel” refers to a junction between an intronic element and second exon, based on current UCSC/GENCODE/RefSeq annotations. Worksheet 2) Novel junctions detected from all candidate RS-sites. Candidate RS-sites are classified based on whether they are known cassette exons (Exon), linked to a poison (Poison) or alternative (Alternative) exon following novel junction analysis (see worksheet 1), or have not been detected in conjunction with an additional proximally spaced splice site that is suggestive of exon formation (Sing). Worksheet 3) Splice site scores of competing 5′ splice sites following the first step of recursive splicing. Results are represented diagrammatically in Extended Data Fig. 8d.
Supplementary Table 4: Worksheet 1) Splicing reporter mini-gene sequences used in this study that were designed around the CADM2 gene. P1 represents mini-gene with first exon coming from dominant long isoform of CADM2, P2 represents mini-gene with first exon coming from minor short isoform of CADM2. Primers indicated were used in overlapping PCRs to create mutant variants of indicated mini-genes. Worksheet 2) Primers used in this study together with expected product sizes.


