

Abstract
Background
Nuclear factor (erythroid-derived 2) factor 2 (Nrf2) is a crucial transcription factor mediating protection against oxidants. Nrf2 is negatively regulated by cytoplasmic Kelch-like ECH associated protein 1 (Keap1) thereby providing inducible antioxidant defence. Antioxidant properties of Nrf2 are thought to be mainly exerted by stimulating transcription of antioxidant proteins, whereas its effects on ROS production within the cell are uncertain.
Methods
Live cell imaging and qPCR in brain hippocampal glio-neuronal cultures and explants slice cultures with graded expression of Nrf2, i.e. Nrf2-knockout (Nrf2-KO), wild-type (WT), and Keap1-knockdown (Keap1-KD).
Results
We here show that ROS production in Nrf2-KO cells and tissues is increased compared to their WT counterparts. Mitochondrial ROS production is regulated by the Keap1–Nrf2 pathway by controlling mitochondrial bioenergetics. Surprisingly, Keap1-KD cells and tissues also showed higher rates of ROS production when compared to WT, although with a smaller magnitude. Analysis of the mRNA expression levels of the two NOX isoforms implicated in brain pathology showed, that NOX2 is dramatically upregulated under conditions of Nrf2 deficiency, whereas NOX4 is upregulated when Nrf2 is constitutively activated (Keap1-KD) to a degree which paralleled the increases in ROS production.
Conclusions
These observations suggest that the Keap1–Nrf2 pathway regulates both mitochondrial and cytosolic ROS production through NADPH oxidase.
General significance
Findings supports a key role of the Keap1–Nrf2 pathway in redox homeostasis within the cell.
Keywords: ROS, Nrf2, Keap1, NADPH oxidase, NOX
Highlights
-
•
We studied ROS production/NADPH oxidase expression in Nrf2-KO and Keap1-KD cells.
-
•
ROS production is increased in Nrf2-KO and Keap1-KD neurons when compared to WT.
-
•
NOX2/NOX4 mRNA in Nrf2-KO and Keap1-KD paralleled these changes.
1. Introduction
Nuclear factor (erythroid-derived 2) factor 2 (Nrf2) is increasingly being recognized as a crucial transcription factor which mediates protection against electrophiles and oxidants and enhances cell survival in many tissues [1]. Under homeostatic conditions, Nrf2 is negatively regulated by cytoplasmic Kelch-like ECH associated protein 1 (Keap1). The Keap1–Nrf2 system orchestrates a very powerful inducible antioxidant defence, and more recently has been also shown to contribute to cellular bioenergetics by controlling substrate availability for mitochondrial respiration [2,3]. Nrf2 binds to antioxidant response elements (AREs), specific sequences present in the promoter regions of its target genes, as a heterodimer with a small Maf protein, and stimulates transcription of antioxidant proteins [4]. These include gluthatione S-transferases (GSTs), NAD(P)H: quinone oxidoreductase 1 (NQO1), thioredoxin, thioredoxin reductase, as well as proteins involved in scavenging reactive oxygen species (ROS) and glutathione (GSH) biosynthesis and regeneration. ROS have been implicated in physiological functions such as for example signal transduction cascades and calcium signalling [5], but excess of ROS may lead to cell death via oxidation of membrane lipids (lipid peroxidation) and oxidation of proteins, and is a fundamental mechanism underlying many human diseases such as diabetes and neurodegenerative diseases [6]. The degree of tissue damage varies depending on tissue composition and properties and on the balance of oxidative stress and antioxidant defence within the cells. The brain is particularly susceptible to oxidative damage due to its high levels of oxidizable polyunsaturated fatty acids (PUFAs), high rates of ROS production given its high oxygen consumption, and low levels of endogenous antioxidants [7,8]. Importantly, the levels of ROS within a cell are not only determined by the availability of scavengers of ROS, but also by systems or enzymes producing ROS either as the main product or as a by-product of their catalytic reactions. ROS are produced during mitochondrial respiration and the mitochondria are considered as one of the main ROS producers within the cell. Given that Nrf2 affects substrate availability for mitochondrial respiration, it is therefore likely to also affect mitochondrial ROS production. However, the experimental evidence for the effect of Nrf2 on the generation of ROS specifically in mitochondria is limited.
Besides mitochondria, the NADPH oxidase system is now widely recognized as a key player in intracellular ROS homeostasis and as one of the major producers of ROS within the cell [6]. Initially discovered as the enzyme responsible for the oxidative burst by which leukocytes kill bacteria [9], the NADPH oxidase is now considered to play a role in almost all tissue types [10]. There are different isoforms (NOX1-NOX5 and DUOX1 and 2) of this enzyme and the expression of different subtypes varies amongst tissue types [10]. NOX2 is the main isoform of NADPH oxidase in brain tissues such as glia and neurons [10–12] and contributes to brain injury but NOX4 also seems to play a role [13]. Both NOX2 and NOX4 activation has been linked to brain pathology, implying that NADPH oxidase mediated ROS production participates in acute and chronic neurological disease [13–15]. Several lines of evidence strongly suggest that NADPH oxidase regulates Nrf2 activation; indeed, this has been shown for NOX4 in pulmonary epithelial cells and cardiomyocytes [16,17]. Whether the reverse holds true, namely whether NADPH oxidase expression and activation are regulated by the Keap1–Nrf2 pathway, is much less understood. Cells and animals with graded expression of Nrf2, i.e. Nrf2-knockout (Nrf2-KO), wild-type (WT), and Keap1-knockdown (Keap1-KD) [18] represent an ideal genetic model system in which to address the role of Nrf2 on NADPH oxidase expression and to test the hypothesis that there is a reciprocal interaction between Nrf2 activity and NADPH oxidase expression, thereby forming a negative feedback regulatory loop. Such information is important since the Keap1–Nrf2 pathway is increasingly targeted to prevent and treat human disease and several clinical trials have been completed or are underway [19]. Moreover, BG12 (an orally-bioavailable preparation of dimethyl fumarate), a drug licensed for the treatment of multiple sclerosis, exerts its effect via activation of the Nrf2 antioxidant pathway [20]. We therefore aimed to firstly, provide a detailed analysis of the interaction between ROS and the Nrf2 pathway. Secondly, we determined the NOX expression levels in primary glio-neuronal and brain explant slice cultures, and in mouse embryonic fibroblasts (MEFs) isolated from WT, Nrf2-KO and Keap1-KD animals to establish whether there is a correlation with ROS production.
We found that the Keap1–Nrf2 pathway modulates ROS production in primary glio-neuronal and brain explant slice cultures. ROS production in Nrf2-KO cells and tissues was increased dramatically in comparison with their WT counterparts. This increase was seen in mitochondrial ROS, and was even more pronounced in overall ROS production. Surprisingly, Keap1-KD cells and tissues, in which Nrf2 is constitutively upregulated, also showed higher rates of ROS production when compared to WT, although with a much smaller magnitude. Analysis of the mRNA expression levels of the two NOX isoforms implicated in brain pathology showed, that NOX2 was dramatically upregulated under conditions of Nrf2 deficiency, whereas NOX4 was upregulated when Nrf2 is constitutively activated (Keap1-KD) to a degree which paralleled the increases in ROS production.
2. Experimental—materials and methods
2.1. Mouse embryonic fibroblast cultures
Three lines of mouse embryonic fibroblasts (MEFs) were used for experiments. These were wild-type (WT), Keap1-knockout (Keap1-KO) and Nrf2-knockout (Nrf2-KO). Cells were grown in Iscoves Modified Eagle's medium (IMDM; Gibco) with each 500 ml bottle supplemented with 5 μg epidermal growth factor (EGF; Invitrogen), 5 ml of insulin transferrin-selenium (ITS; Gibco) and 50 ml foetal bovine serum (FBS; Gibco) and kept at 37 °C with 5% CO2. Cells were maintained in culture and split regularly to maintain them at a maximum 90% confluency. Cells were seeded onto coverslips 24 h prior to experiments.
2.2. Cortical cell cultures
Mixed co-cultures of cortical neurons and glial cells from postnatal (P0–3) WT, Nrf2-KO or Keap1-KD SKH-1 hairless mice (from our breeding colony at the University of Dundee) were prepared according to a modified protocol described by Deitch and Fischer [21]. Mixed co-cultures were used rather than pure neuronal cultures as these provide a more physiological model than separate cultures of individual cell types. In addition, neuron–astrocyte interaction is vitally important in terms of bioenergetics and antioxidant defence (astrocytes supporting neurons with precursors of GSH)—processes in which Nrf2 plays an important role. Mouse brains were quickly removed and neocortical tissue was cut and minced in ice-cold HBSS (Ca2 +, Mg2 +-free, Gibco-Invitrogen, Paisley, UK). After treatment with 1% trypsin for 15 min at 37 °C to dissociate the cells, residual trypsin was removed and the tissue was triturated. The suspension was plated on Poly-D-Lysine/Laminin coated coverslips and cultured in Neurobasal A medium (Gibco-Invitrogen, Paisley, UK) supplemented with B-27 and 2 mM l-glutamine (Gibco-Invitrogen, Paisley, UK). Experiments were carried out after 12–18 DIV to allow maturation of synapses in cultures.
2.3. Cortical explant cultures
Organotypic slice cultures were prepared from embryonic tissue from littermates of the same WT, Nrf2-KO or Keap1-KD mice as for the primary cultures according to Stoppini et al. [22] with slight modifications [23,24]. Mice were sacrificed according to the British Home Office ethical guidelines. Brains were rapidly removed and placed into a chilled dissection medium, containing: EBSS media with 1% penicillin/streptomycin (Invitrogen) supplemented with 25 mM HEPES (Sigma Aldrich). Hemispheres were separated and placed on a vibratome stage (Leica VT1000S) for coronal sectioning at a 250-μm thickness. Three to six slices were directly transferred to one membrane insert (PICM0RG50; Millipore) in 6-well plates, containing culturing media: MEM + EBSS (2:1), 25% horse serum, 2 mM Glutamax, 1% penicillin–streptomycin (all Invitrogen), 20 mM D-glucose, 0.06% Nystatin (both from Sigma). Slices were incubated in a humidified 5% CO2 atmosphere at 37 °C, and medium was replaced twice a week. On the 12–14 DIV explants were excised from the biomembrane and imaged in HBSS (Invitrogen).
2.4. Imaging of intracellular ROS generation and lipid peroxidation
ROS generation was measured with hydroethidine (HEt; 2–10 μM—mostly superoxide) and MitoSOX. Both probes were obtained from Invitrogen, Life science (Paisley, UK). All imaging was performed in HBSS. To avoid accumulation of oxidized products, HEt was not preincubated, but was present in solutions throughout the experiments both in glio-neuronal co-cultures and explants slice cultures. To target mitochondrial ROS production, cells were loaded with MitoSOX (10 μM) for 10 min and washed prior to experiments. Rates of lipid peroxidation in glio-neuronal cultures and explants slice cultures were measured using C11-BODIPY (581/591) (Invitrogen, Life science, Paisley, UK). Glio-neuronal co-cultures were pre-incubated for 20 min with C11-BODIPY 581/591 (2 μM; Molecular Probes, Eugene, OR).
Imaging of reactive oxygen species with HEt was performed with a CCD camera and with a confocal microscope. Recordings on the CCD camera were performed capturing fluorescence images on an epifluorescence inverted microscope equipped with a 20 × fluorite objective (Cairn Research, Kent, UK). Excitation wavelength was selected using a 10 nm bandpass filter centred on 530 nm light. Emitted fluorescence was detected by a cooled CCD camera after passing through a long-pass filter and 12-bit resolution. HEt was excited by illumination at 530 nm. Ratiometric HEt fluorescence was recorded with excitation light at 380 and 530 nm.
We also imaged ROS with dihydroethidium using confocal microscopy. Confocal images were obtained with a Zeiss 710 LSM with an integrated META detection system. HEt was excited with the 565 laser and light emitted at 580–620 nm was measured. To assess lipid peroxidation, C11-BODIPY (581/591) was excited using the 488 and 543 nm laser line and fluorescence measured between 505 to 540 nm and 560–650 nm accordingly (40 × objective). MitoSOX images were obtained using a 63 × objective to increase precision in measuring fluorescent signals immediately over mitochondria. MitoSOX were excited using the 565 nm laser line and fluorescence was measured above 580 nm. Phototoxicity and photobleaching of cells were minimized by limiting the light exposure to the time of acquisition of the images. Fluorescent images were acquired with a frame interval of 10 s. Data were analysed using software from Andor (Belfast, UK). Illumination intensity was kept to a minimum (at 0.1–0.2% of laser output) to avoid phototoxicity and the pinhole set to give an optical slice of ~ 2 μm. Rates of mitochondrial ROS increase were calculated at different time points after exposure to rotenone or pyruvate and compared to baseline rates of ROS production.
HEt, MitoSOX and Bodipy are dynamic dyes; i.e. meaningful quantification of these dyes is only achieved by measuring increases in the rates of fluorescence rather than absolute fluorescence at a given time point. Therefore, HEt data, MitoSOX and Bodipy data were analysed by determining the slope of the trace after normalization to the first data point.
2.5. Analysis of mRNA expression levels
The primers and probes used to quantify the levels of mRNA for NOX2 and NOX4 were obtained from Applied Biosystems (Mm01287743_m1and Mm00479246_m1). Total RNA was extracted from WT, Nrf2-KO, and Keap1-KD glio-neuronal co-cultures (n = 3) or from WT, Nrf2-KO, and Keap1-KO MEFs (n = 3) using RNeasy Kit (Qiagen Ltd.). Total RNA (500 ng) was reverse transcribed into cDNA with Omniscript Reverse Transcription Kit (Qiagen Ltd.). Real-time quantitative PCR was performed on Applied Biosystems 7500 Real Time PCR System. The TaqMan® data for the mRNA species were normalized using β-actin (mouse ACTB, Applied Biosystems, Mm00607939_s1) as an internal control.
2.6. Statistical analyses
Statistical analyses (Student t-tests) were performed using SPSS 17.0 (Chicago, IL, USA). The significance level was set at p < 0.05 and all data are given as mean ± standard error of the mean (SEM) or mean ± standard deviation (for measurements of mRNA expression). Analyses were performed on single cells if not explicitly stated otherwise.
3. Results
3.1. NADPH oxidase contributes to ROS production in Nrf2-knockout MEFs
We first examined rates of ROS production in mouse embryonic fibroblasts of Keap1-KO and Nrf2-KO mice. Surprisingly, we found that basal rates of ROS production as measured with dihydroethidium fluorescence in Nrf2-KO MEFs were similar to WT (p = ns.). Keap1-KO MEFs had significantly lower rates of ROS production when compared to either Nrf2-KO (p < 0.01) or WT MEFs (n = 7; p < 0.05; Fig. 1A and B). Ionomycin is a Ca2 + ionophore and amongst other effects has been used as a potent activator to stimulate ROS production in several cell types via activation of NADPH oxidase [25,26]. We therefore measured ROS production in MEFs after treatment with ionomycin. Ionomycin increased the rate of ROS production in all treatment groups when compared to basal ROS production. However there were no significant differences between the groups (each group n = 7; Fig. 1C, D). We next asked whether the increase in ROS production in MEFs after stimulation with ionomycin can be attributed to an increased ROS production through NADPH oxidase. Blocking NADPH oxidase with AEBSF (20 μM) significantly (p < 0.01) reduced ionomycin induced ROS production in Nrf2-KO MEFs whereas there was no inhibition of ionomycin induced ROS production in Keap-1 KO and WT MEFs (Fig. 1E) suggesting ROS production through NADPH oxidase contributes significantly to ionomycin induced increases in ROS production in Nrf2-KO MEFs.
Fig. 1.

Ionomycin induced ROS production in Nrf2-KO, Keap1-KO and wild-type (WT) mouse embryonic fibroblasts (MEFs). ROS production as measured with HEt fluorescence is significantly reduced in Keap1-KO when compared to Nrf2-KO and WT (A and B). The graphs show the mean (and SEM) rate of ROS production in a representative experiment (A). Histograms quantifying rates of ROS production in the three groups (B; each n = 7 coverslips). Treatment with ionomycin, an activator of NADPH oxidase, induced ROS production in all three genotypes (n = 7 coverslips; C and D). C: Increase of ROS production in MEFs after treatment with ionomycin as measured with HEt representative experiment (mean and SEM; n = 4 cells); histogram summarizing ROS increase after ionomycin treatment; co-treatment of MEFs with an inhibitor of NADPH oxidase, AEBSF (20 μM), during activation with ionomycin reduced the rate of ROS production when compared to ionomycin treatment only in Nrf2-KO MEFs (E). Note that inhibition of NADPH oxidase in Keap1-KO and WT MEFs activated with ionomycin did not have any effect on ROS production when compared to ionomycin treatment alone. Error bars indicate SEM. **p < 0.01; *p < 0.05.
Next, we evaluated the expression of NADPH oxidase in MEF cells of the three genotypes. It has been reported previously that NOX4 is expressed in fibroblasts [27–29]. Besides NOX4, some studies have reported NOX2 expression in adventitial fibroblasts on a protein level [30,31]. Quantitative real-time PCR analysis in WT, Nrf2-KO and Keap1-KO MEFs showed that the mRNA levels of NOX4 were lowest in Keap1-KO, higher in Nrf2-KO, and highest in WT MEFs (Fig. 2). NOX2 mRNA was not detectable in any of the genotypes of MEFs. The profound (~ 90%) reduction in NOX4 mRNA in Keap1-KO MEFs relative to their WT counterparts is consistent with the previously reported transcriptional down-regulation of NOX4 expression by Nrf2 in endothelial cells [32]. The lower levels of NOX4 mRNA in Nrf2-KO MEFs in comparison with WT cells were at first sight surprising. However, this is consistent with the facts that: (i) inhibition of histone deacetylase (HDAC) 3 has been shown to decrease NOX4 transcription in human endothelial cells [33], (ii) similarly to other HDACs, HDAC3 is inactivated by oxidative stress [34], and (iii) compared to WT cells, the levels of GSH are lower in Nrf2-KO MEFs, whereas the levels of ROS are higher [2,35]. It can be therefore proposed that, in the absence of Nrf2, the increased levels of ROS lead to inactivation of HDAC3, and consequently to reduced expression of NOX4.
Fig. 2.
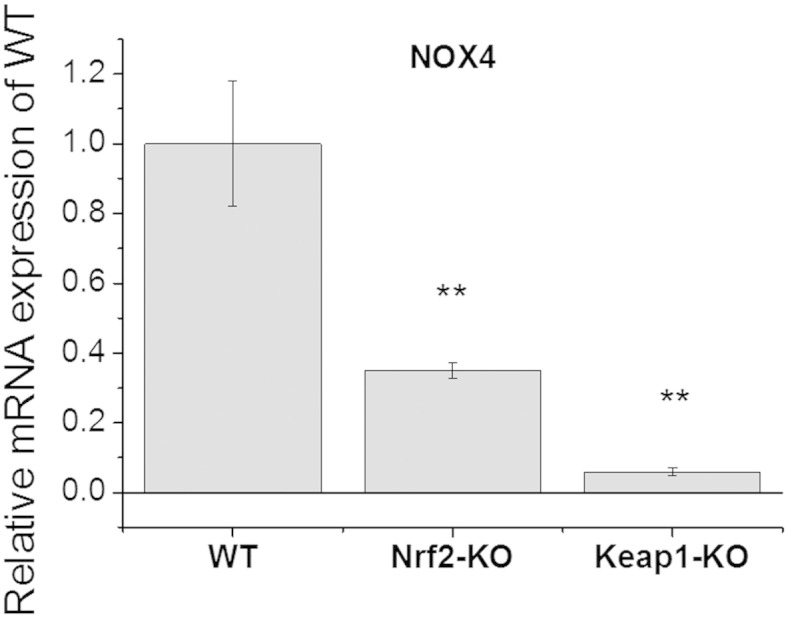
mRNA expression levels of NOX4 in Nrf2-KO, Keap1-KO and wild-type (WT) MEFs. Histogram quantifying relative mRNA expression with WT mRNA set as 1 (mean ± SD); **p < 0.01; ***p < 0.001.
3.2. ROS production in mouse glio-neuronal cultures and explants cultures
Strong evidence indicates that ROS play a critical role in neuronal toxicity [7,36–38]. Indeed, the sequelae of neurodegenerative disease and acute neurological disorders may be largely mediated by ROS [15,39]. NADPH oxidase plays an important role in ROS production in the brain, and both NOX2 and NOX4 isoforms have been implicated [13,14]. We therefore next examined the basal rates of ROS production in brain hippocampal glio-neuronal and explant slice cultures isolated from mice with graded levels of Nrf2. As Keap1-KO mice die shortly after birth and cannot be used for breeding [40], we used WT, Nrf2-KO and Keap1-KD mice for these experiments. Keap1-KD mice carry floxed alleles of the keap1 gene, which reduces its expression and consequently increases the levels of Nrf2, and thus represent a genetic model for constitutive Nrf2 activation [18]. We have previously shown that the activities of several Nrf2-dependent enzymes are higher in Keap1-KD animals compared to their WT counterparts [2]. As expected, we found that the rate of ROS production was dramatically increased in Nrf2-KO when compared to WT (Fig. 3) in both primary hippocampal cultures (~ 6-fold increase; p < 0.001; Fig. 3A and B) as well as explant slice cultures (all; ~ 8-fold increase; p < 0.001 Fig. 3C and D). Surprisingly, the rates of ROS production were also increased in Keap1-KD compared to WT, although to a lesser extent (1.5-fold increase in primary cultures; p = ns.; 2-fold increase in explant cultures; p < 0.01). Increases in ROS production were also paralleled by increased lipid peroxidation as measured with Bodipy-11 in explants cultures (Fig. 4) with a significant increase in lipid peroxidation in Nrf2-KO when compared to WT (p < 0.01) and a slight, but non-significant increase in Keap1-KD when compared to WT. These data strongly suggest that NOX-mediated ROS production induced oxidative stress, resulting in lipid oxidation in Nrf2-KO but not in Keap1-KD cells.
Fig. 3.

ROS production in Nrf2-KO, Keap1-KD and wild-type (WT) neuronal co-cultures and organotypic slice cultures. ROS production is significantly higher in Nrf2-KO both in glio-neuronal co-culture (A and B; WT: n = 49 cells; 3 experiments; Nrf2-KO: n = 70 cells; 3 experiments; Keap1-KD n = 51 cells; 3 experiments) and organotypic slice cultures (C and D WT: n = 72 cells; 3 experiments; Nrf2-KO: n = 62 cells; 3 experiments; Keap1-KD n = 80 cells; 3 experiments). Panel A and C show representative experiments (mean ± SEM) demonstrating increase in ROS as measured by HEt fluorescence over time for the different groups. B and D summarize normalized ROS production rates in histograms. **p < 0.01; ***p < 0.001; ns: not significant.
Fig. 4.

Rates of lipid peroxidation in Nrf2-KO (n = 5), Keap1-KD (n = 5) and wild-type (WT; n = 9) organotypic slice cultures.
Real-time PCR using brain hippocampal glio-neuronal cultures of WT, Nrf2-KO, and Keap1-KD mice showed that NOX2 mRNA levels are robustly elevated in Nrf2-KO (~ 7-fold increase compared to WT; p < 0.01; Fig. 5A), whereas NOX2 mRNA expression in Keap1-KD was not different from WT cells. The elevated NOX2 expression in the absence of Nrf2, when the intracellular levels of ROS are high, may render the brain tissue especially vulnerable to damaging agents, such a pesticides, β-amyloid, glutamate, emphasizing the critical role of Nrf2 in neuroprotection. Interestingly NOX4 mRNA expression levels were decreased by ~ 50% in Nrf2-KO when compared to WT cells (p < 0.05; Fig. 5B), consistent with the findings in MEFs (Fig. 2). However, in contrast to the MEF data, Keap1-KD glio-neuronal cells showed slightly higher (~ 1.5-fold) NOX4 mRNA expression when compared to WT. Together, these results suggest that the relationship between Nrf2 and NOX4 is complex and tissue-specific. In brain cells, the primary mechanism of regulation of NOX4 expression by Nrf2 is most likely indirect, i.e. determined by the levels of ROS and consequently HDAC activity, and not through direct binding of Nrf2 to the promoter of NOX4 as in endothelial cells. This conclusion is further supported by the fact that the magnitude of the relative increase in NOX4 mRNA levels in Keap1-KD brain cultures (~ 1.5-fold) and the increase in NOX2 mRNA levels in Nrf2-KO brain cultures (~ 7-fold; Fig. 5) paralleled the ROS increases which we observed in both primary glio-neuronal cultures and brain explant cultures (Fig. 3).
Fig. 5.

mRNA expression levels of NOX2 in Nrf2-KO, Keap1-KD and wild-type (WT) glio-neuronal co-cultures. Histograms summarizing expression of NOX2 (A) and NOX4 (B) mRNA in mouse glio-neuronal co-cultures. **p < 0.01; *p < 0.05.
3.3. Mitochondrial ROS in mouse glio-neuronal cultures
Mitochondria are a prominent source of ROS within the cell. We therefore next examined whether ROS of mitochondrial origin contribute to the overall ROS production in WT, Nrf2-KO, and Keap1-KD mouse glio-neuronal co-cultures. Mitochondrial ROS production is linked to the rate of respiration and therefore also to the mitochondrial membrane potential, with hyperpolarization contributing to higher rates of respiration and thus increased electron leak/ROS production. In full agreement with our previous studies [2], the mitochondrial membrane potential was lower in Nrf2-KO when compared to WT cells, whereas mitochondria of Keap1-KD cells were slightly hyperpolarized (Fig. 6G). The basal rates of mitochondrial ROS production, as measured with the mitochondria-specific probe MitoSOX, differed between the three genotypes. Nrf2-KO showed higher rates of mitochondrial ROS production (~ 180% of WT) than WT (p < 0.001; Fig. 6A–F, H, I). Surprisingly, Keap1-KD also showed higher rates of mitochondrial ROS production when compared to WT cells (p < 0.001; ~ 160% of WT; Fig. 6 A–E, H, I).
Fig. 6.

Mitochondrial ROS production in Nrf2-KO, Keap1-KD and wild-type (WT) glio-neuronal co-cultures. Mitochondrial ROS production was measured with MitoSOX. Traces A –F show mean MitoSOX fluorescence of representative experiments in Nrf2-KO (n = 42), Keap1-KD (n = 46) and WT (n = 32) neurons. Grey background indicates treatment with rotenone (5 μM; A–C; WT (n = 16); Nrf2-KO (n = 20) and Keap1-KD (n = 20) or pyruvate (5 mM; D-F WT (n = 16); Nrf2-KO (n = 22) and Keap1-KD (n = 26). Note that treatment with pyruvate decreases mitochondrial ROS production in Nrf2-KO neurons (F). Histograms summarizing basal mitochondrial membrane potential (G) and basal mitochondrial ROS production (H) in Nrf2-KO, Keap1-KD and WT neurons. The histogram in I shows rates of mitochondrial ROS production in Nrf2-KO, Keap1-KD and WT neurons after treatment with rotenone or pyruvate. Significance levels are indicated above the bars and refer to a comparison between baseline and pyruvate or rotenone. **p < 0.01; *p < 0.05.
To further investigate the mechanisms governing mitochondrial ROS production in Nrf2-KO and Keap1-KD cells, we inhibited complex I with rotenone (5 μM) (Fig. 6A–C) or increased respiration with pyruvate (Fig. 6D–F) while monitoring mitochondrial ROS production with MitoSOX. Blocking complex I with rotenone, which is recognized as a powerful mechanism to induce ROS [15,41] led to a dramatic increase in mitochondrial ROS when compared to basal ROS production in both WT (p < 0.001) and Keap1-KD cells (p < 0.001; Fig. 6A, B,I). However, no significant increase in ROS production was observed in Nrf2-KO cells (p = ns. Fig. 6C,I) upon rotenone administration, suggesting that, in the absence of Nrf2, the activity of complex I is impaired even at basal state due to substrate limitation [2]. While the basal level of mitochondrial ROS production in Nrf2-KO cells was higher than WT cells, the rate of ROS production in Nrf2-KO cells was comparable to WT cells following rotenone treatment, indicating that Nrf2-KO cells respond to complex I inhibition with the same degree of ROS production as WT cells.
Furthermore, this result implies that insufficient supply of substrates is the main mechanism for mitochondrial ROS generation under basal conditions. We next explored mitochondrial ROS production under conditions of increased NADH availability within the cell by adding pyruvate (5 mM) to glio-neuronal co-cultures. Pyruvate increased mitochondrial ROS production compared to basal levels in WT (p < 0.05; Fig. 6D and I), and in Keap1-KD cells (p = ns; Fig. 6E and I). In sharp contrast, administration of pyruvate significantly decreased ROS production in Nrf2-KO cells (p < 0.001; Fig. 6F and I), in agreement with our previous studies showing that application of substrates restores the mitochondrial membrane potential and decreases ROS [2]. Together, these results strongly suggest, that limitation of substrates for complex I and, consequently its impaired activity, is the main reason for mitochondrial ROS production in Nrf2 deficiency.
4. Discussion
4.1. ROS production
Previous studies have reported that ROS levels are increased in Nrf2-KO cardiomyocytes when compared to WT cells [42]. Similar to cardiomyocytes, neurons have high metabolic rates. This is due to high activity of transmembrane channels and pumps in electrically active cells with consequent high metabolic demand predominantly covered by oxidative phosphorylation. We therefore examined ROS production in brain tissue. We chose to study glio-neuronal co-cultures and brain slices as we believe that this provides more valuable insight in the physiological and pathophysiological processes in health and disease. Although Nrf2 mediated neuroprotection has been primarily attributed to astrocytes [43,44], more recent studies show that regulation of endogenous antioxidant and Nrf2 signalling is highly dependent on the interplay between neurons and astrocytes at the neuron–astrocyte tripartite synapse [45].
We found that ROS production is dramatically increased in brain tissue from Nrf2-KD mice. Previous studies in Nrf2-KO mice have shown that Nrf2-target gene products play a role in protection against oxidative stress in primary cortical astrocytes and in vivo [43,46,47]. Jeffrey Johnson et al. showed that Nrf2-KO neurons were more sensitive to mitochondrial toxins such as rotenone than their WT counterparts. Using microarray analysis they then found that this vulnerability was due to Nrf2-KO cells having reduced expression of genes encoding detoxification enzymes, antioxidant proteins, calcium homeostasis proteins, growth factors, neuron-specific proteins, and signalling molecules compared to WT cultures [47]. Furthermore, compared to WT, Nrf2-KO mice that had been exposed to the mitochondrial complex I inhibitor 1-methyl-4-phenyl-1,2,3,6-tetrahydropyridine (MPTP) display a much more rapid dose-dependent decline in markers of dopaminergic toxicity, including decreases in tyrosine hydroxylase levels, in both striatum and substantia nigra [48]. In addition, numerous studies have shown that Nrf2-KO mice have enhanced susceptibility to oxidizing stimuli and glutathione depletion [49]. Whereas it is well established that deletion of Nrf2 causes ROS accumulation, the origin of these ROS is unknown.
We here show that ROS of mitochondrial origin are upregulated in brain tissue of Nrf2-KO mice. We have previously shown that Nrf2 impacts on cellular bioenergetics by controlling substrate availability and the efficiency of mitochondrial fatty acid oxidation [2,3]. Both processes affect oxidative phosphorylation and thereby are likely to affect mitochondrial ROS production. We here found that mitochondrial ROS production can be decreased by providing substrates, such as pyruvate, to Nrf2-deficient neurons, further linking metabolic pathways to redox homeostasis within the cell.
We want to highlight that within the brain glial cells, macrophages and neurons produce ROS, with all three cell types expressing NADPH oxidase [6]. ROS are small molecules and ROS induced damage is not restricted to the cell producing ROS. Thus, measuring intact brain tissue such as glioneuronal cultures and explants cultures rather than cells in isolation is important to appreciate the overall impact on brain tissue.
4.2. Nrf2 and NADPH oxidase
Previous studies have suggested a link between NADPH oxidase and Nrf2. Thus, in MEFs, suppression of NADPH oxidase with diphenyleneiodonium reduced activation of Nrf2 and thereby transcription of antioxidant enzymes [50]. Similarly, NADPH oxidase and ERK signalling play a role in hyperoxia-induced Nrf2 transcriptional response in pulmonary epithelial cells [16]. These findings have been replicated in studies in vivo and in isolated macrophages showing that NADPH oxidase redox-mediated signalling is critical in activating Nrf2, which ultimately terminated lung inflammation [51]. Whether there is an interaction in the other direction, i.e. whether Nrf2 regulates NADPH oxidase expression is less clear and may be tissue-specific. Curiously, it has been reported that Nrf2 negatively regulates the gene expression of NOX4 in endothelial cells [32], suggesting the existence of a negative feedback regulation. However, another study points to a role for Nrf2 in upregulating NOX4 expression. This has been shown to occur in the mouse and human lung endothelium in response to hyperoxia [52]. In the present study, we found that, compared to WT, the expression of NOX2 is upregulated in primary brain hippocampal glio-neuronal cultures of Nrf2-KO mice, whereas NOX4 is downregulated. Interestingly, the expression of NOX4 appeared higher in Keap1-KD than in WT cells, even though the difference was not statistically significant.
The expression of NOX4 in both MEF and glio-neuronal cultures is lower when Nrf2 is absent (Figs. 2 and 5B), suggesting at first glance, that Nrf2 is a positive regulator of NOX4 transcription. An alternative explanation of this result is the following: The absence of Nrf2 promotes a pro-oxidative environment. This in turn leads to oxidation of redox-sensitive cysteines in HDAC4 and enzyme inactivation [53]. Inactivation of HDAC4 ultimately results in decreased transcription of NOX4 [33]. Interestingly, constitutive activation of Nrf2 (by Keap1-knockdown or knockout) has a divergent outcome in the two tissue types, whereby it leads to strong suppression of NOX4 expression in MEFs and upregulation in glio-neuronal cultures. Moreover, in contrast to NOX4, deletion of Nrf2 leads to higher NOX2 expression (Fig. 5A). Together, these findings indicate that the mechanism by which Nrf2 regulates NADPH oxidase activity is complex, and that the overall outcome is probably determined by both direct (promoter binding) and indirect (chromatin remodelling) effects. Such effects have been previously reported for other Nrf2-regulated genes. One prominent example is the pentose phosphate pathway NADPH-generating enzyme, glucose-6-phosphate dehydrogenase (G6PD), the gene expression of which is profoundly affected by the activity of Nrf2 [54–56]. Direct effects of Nrf2 activation (by sulforaphane) on G6PD activity have been shown before [57], especially in astroglia [58]. It has been suggested that loss of Nrf2 increases oxidation and nuclear export of the redox-sensitive histone deacetylase, HDAC4 [56,59]. In turn, the resulting hypoacetylation of the HDAC targets miR-1 and miR-206 leads to enhanced expression of these miRs, and consequently, to inhibition of G6PD expression and activity. It can be proposed that the absence of Nrf2 leads to downregulation of NOX4 expression by a similar (HDAC4-dependent) mechanism.
Taken together with previous reports by other investigators, our findings suggest the existence of a negative feedback regulatory loop between NOX4 and Nrf2. Under homeostatic conditions, NOX4 generates superoxide and hydrogen peroxide, which in turn activate Nrf2 [17] by oxidizing cysteine sensors and inactivating Keap1. The activated Nrf2 then inhibits the transcription of NOX4 [32] to lower ROS production. In the absence of Nrf2, the feedback regulation is missing, creating a pro-oxidative environment, leading to oxidation of redox-sensitive cysteines in HDAC4 [53], HDAC4 inactivation and decreased NOX4 transcription [33]. When Nrf2 is constitutively activated (as in Keap1 knockdown or knockout), HDAC4 is fully reduced and active, leading to enhanced transcription of NOX4, and higher levels of ROS.
Interestingly, a recent investigation has suggested that Nrf2 controls neuronal survival in ageing and neurodegenerative disease upstream of ROS. This study showed that glutathione depletion did not correlate with ageing, but found that rather the redox environment which was modulated by a protective treatment with an Nrf2 activator and nicotinamide protected against neuronal damage [60]. We here show that Nrf2 activity affects the function of two different sources of ROS—i.e. mitochondrial ROS production and production of ROS via NADPH oxidase. Our study therefore supports the notion that Nrf2 functions at the interface between redox and intermediary metabolism and does not only affect the levels of scavengers of ROS, but also ROS production.
Acknowledgements
We thank Masayuki Yamamoto (Tohoku University) for originally providing the Nrf2-KO and Keap1-KD mice. This work was supported by Epilepsy Research UK, Cancer Research UK (C20953/A10270) and The Wellcome Trust/MRC Parkinson's Disease Consortium grant to UCL/IoN (grant number WT089698).
Contributor Information
Albena T. Dinkova-Kostova, Email: a.dinkovakostova@dundee.ac.uk.
Andrey Y. Abramov, Email: a.abramov@ucl.ac.uk.
References
- 1.Baird L., Dinkova-Kostova A.T. The cytoprotective role of the Keap1–Nrf2 pathway. Arch. Toxicol. 2011;85:241–272. doi: 10.1007/s00204-011-0674-5. [DOI] [PubMed] [Google Scholar]
- 2.Holmström K.M., Baird L., Zhang Y., Hargreaves I., Chalasani A., Land J.M., Stanyer L., Yamamoto M., Dinkova-Kostova A.T., Abramov A.Y. Nrf2 impacts cellular bioenergetics by controlling substrate availability for mitochondrial respiration. Biol. Open. 2013;2:761–770. doi: 10.1242/bio.20134853. [DOI] [PMC free article] [PubMed] [Google Scholar]
- 3.Ludtmann M.H.R., Angelova P.R., Zhang Y., Abramov A.Y., Dinkova-Kostova A.T. Nrf2 affects the efficiency of mitochondrial fatty acid oxidation. Biochem. J. 2014;457:415–424. doi: 10.1042/BJ20130863. [DOI] [PMC free article] [PubMed] [Google Scholar]
- 4.Motohashi H., Yamamoto M. Nrf2-Keap1 defines a physiologically important stress response mechanism. Trends Mol. Med. 2004;10:549–557. doi: 10.1016/j.molmed.2004.09.003. [DOI] [PubMed] [Google Scholar]
- 5.Domijan A.-M., Kovac S., Abramov A.Y. Lipid peroxidation is essential for phospholipase C activity and the inositol-trisphosphate-related Ca2 + signal. J. Cell Sci. 2014;127:21–26. doi: 10.1242/jcs.138370. [DOI] [PubMed] [Google Scholar]
- 6.Dröge W. Free radicals in the physiological control of cell function. Physiol. Rev. 2002;82:47–95. doi: 10.1152/physrev.00018.2001. [DOI] [PubMed] [Google Scholar]
- 7.Gandhi S., Abramov A.Y. Mechanism of oxidative stress in neurodegeneration. Oxidative Med. Cell. Longev. 2012;2012:428010. doi: 10.1155/2012/428010. [DOI] [PMC free article] [PubMed] [Google Scholar]
- 8.Halliwell B. Oxidative stress and neurodegeneration: where are we now? J. Neurochem. 2006;97:1634–1658. doi: 10.1111/j.1471-4159.2006.03907.x. [DOI] [PubMed] [Google Scholar]
- 9.Segal A.W. How neutrophils kill microbes. Annu. Rev. Immunol. 2005;23:197–223. doi: 10.1146/annurev.immunol.23.021704.115653. [DOI] [PMC free article] [PubMed] [Google Scholar]
- 10.Bedard K., Krause K.-H. The NOX family of ROS-generating NADPH oxidases: physiology and pathophysiology. Physiol. Rev. 2007;87:245–313. doi: 10.1152/physrev.00044.2005. [DOI] [PubMed] [Google Scholar]
- 11.Dohi K., Ohtaki H., Nakamachi T., Yofu S., Satoh K., Miyamoto K., Song D., Tsunawaki S., Shioda S., Aruga T. Gp91phox (NOX2) in classically activated microglia exacerbates traumatic brain injury. J. Neuroinflammation. 2010;7:41. doi: 10.1186/1742-2094-7-41. [DOI] [PMC free article] [PubMed] [Google Scholar]
- 12.Park L., Zhou P., Pitstick R., Capone C., Anrather J., Norris E.H., Younkin L., Younkin S., Carlson G., McEwen B.S. Nox2-derived radicals contribute to neurovascular and behavioral dysfunction in mice overexpressing the amyloid precursor protein. Proc. Natl. Acad. Sci. U. S. A. 2008;105:1347–1352. doi: 10.1073/pnas.0711568105. [DOI] [PMC free article] [PubMed] [Google Scholar]
- 13.Kleinschnitz C., Grund H., Wingler K., Armitage M.E., Jones E., Mittal M., Barit D., Schwarz T., Geis C., Kraft P. Post-stroke inhibition of induced NADPH oxidase type 4 prevents oxidative stress and neurodegeneration. PLoS Biol. 2010;8 doi: 10.1371/journal.pbio.1000479. [DOI] [PMC free article] [PubMed] [Google Scholar]
- 14.Girouard H., Wang G., Gallo E.F., Anrather J., Zhou P., Pickel V.M., Iadecola C. NMDA receptor activation increases free radical production through nitric oxide and NOX2. J. Neurosci. 2009;29:2545–2552. doi: 10.1523/JNEUROSCI.0133-09.2009. [DOI] [PMC free article] [PubMed] [Google Scholar]
- 15.Abramov A.Y., Scorziello A., Duchen M.R. Three distinct mechanisms generate oxygen free radicals in neurons and contribute to cell death during anoxia and reoxygenation. J. Neurosci. 2007;27:1129–1138. doi: 10.1523/JNEUROSCI.4468-06.2007. [DOI] [PMC free article] [PubMed] [Google Scholar]
- 16.Papaiahgari S., Kleeberger S.R., Cho H.-Y., Kalvakolanu D.V., Reddy S.P. NADPH oxidase and ERK signaling regulates hyperoxia-induced Nrf2-ARE transcriptional response in pulmonary epithelial cells. J. Biol. Chem. 2004;279:42302–42312. doi: 10.1074/jbc.M408275200. [DOI] [PubMed] [Google Scholar]
- 17.Brewer A.C., Murray T.V.A., Arno M., Zhang M., Anilkumar N.P., Mann G.E., Shah A.M. Nox4 regulates Nrf2 and glutathione redox in cardiomyocytes in vivo. Free Radic. Biol. Med. 2011;51:205–215. doi: 10.1016/j.freeradbiomed.2011.04.022. [DOI] [PMC free article] [PubMed] [Google Scholar]
- 18.Taguchi K., Maher J.M., Suzuki T., Kawatani Y., Motohashi H., Yamamoto M. Genetic analysis of cytoprotective functions supported by graded expression of Keap1. Mol. Cell. Biol. 2010;30:3016–3026. doi: 10.1128/MCB.01591-09. [DOI] [PMC free article] [PubMed] [Google Scholar]
- 19.Kensler T.W., Egner P.A., Agyeman A.S., Visvanathan K., Groopman J.D., Chen J.-G., Chen T.-Y., Fahey J.W., Talalay P. Keap1-nrf2 signaling: a target for cancer prevention by sulforaphane. Top. Curr. Chem. 2013;329:163–177. doi: 10.1007/128_2012_339. [DOI] [PMC free article] [PubMed] [Google Scholar]
- 20.Linker R.A., Lee D.-H., Ryan S., van Dam A.M., Conrad R., Bista P., Zeng W., Hronowsky X., Buko A., Chollate S. Fumaric acid esters exert neuroprotective effects in neuroinflammation via activation of the Nrf2 antioxidant pathway. Brain. 2011;134:678–692. doi: 10.1093/brain/awq386. [DOI] [PubMed] [Google Scholar]
- 21.Haynes L.W. John Wiley & Sons; 1999. The Neuron in Tissue Culture. [Google Scholar]
- 22.Stoppini L., Buchs P.A., Muller D. A simple method for organotypic cultures of nervous tissue. J. Neurosci. Methods. 1991;37:173–182. doi: 10.1016/0165-0270(91)90128-m. [DOI] [PubMed] [Google Scholar]
- 23.De Simoni A., Yu L.M.Y. Preparation of organotypic hippocampal slice cultures: interface method. Nat. Protoc. 2006;1:1439–1445. doi: 10.1038/nprot.2006.228. [DOI] [PubMed] [Google Scholar]
- 24.Kim H., Kim E., Park M., Lee E., Namkoong K. Organotypic hippocampal slice culture from the adult mouse brain: a versatile tool for translational neuropsychopharmacology. Prog. Neuropsychopharmacol. Biol. Psychiatry. 2013;41:36–43. doi: 10.1016/j.pnpbp.2012.11.004. [DOI] [PubMed] [Google Scholar]
- 25.Lundqvist-Gustafsson H., Bengtsson T. Activation of the granule pool of the NADPH oxidase accelerates apoptosis in human neutrophils. J. Leukoc. Biol. 1999;65:196–204. doi: 10.1002/jlb.65.2.196. [DOI] [PubMed] [Google Scholar]
- 26.Abramov A.Y., Jacobson J., Wientjes F., Hothersall J., Canevari L., Duchen M.R. Expression and modulation of an NADPH oxidase in mammalian astrocytes. J. Neurosci. 2005;25:9176–9184. doi: 10.1523/JNEUROSCI.1632-05.2005. [DOI] [PMC free article] [PubMed] [Google Scholar]
- 27.Colston J.T., de la Rosa S.D., Strader J.R., Anderson M.A., Freeman G.L. H2O2 activates Nox4 through PLA2-dependent arachidonic acid production in adult cardiac fibroblasts. FEBS Lett. 2005;579:2533–2540. doi: 10.1016/j.febslet.2005.03.057. [DOI] [PubMed] [Google Scholar]
- 28.Cucoranu I., Clempus R., Dikalova A., Phelan P.J., Ariyan S., Dikalov S., Sorescu D. NAD(P)H oxidase 4 mediates transforming growth factor-beta1-induced differentiation of cardiac fibroblasts into myofibroblasts. Circ. Res. 2005;97:900–907. doi: 10.1161/01.RES.0000187457.24338.3D. [DOI] [PubMed] [Google Scholar]
- 29.Dhaunsi G.S., Paintlia M.K., Kaur J., Turner R.B. NADPH oxidase in human lung fibroblasts. J. Biomed. Sci. 2004;11:617–622. doi: 10.1007/BF02256127. [DOI] [PubMed] [Google Scholar]
- 30.Chamseddine A.H., Miller F.J., Jr. Gp91phox contributes to NADPH oxidase activity in aortic fibroblasts but not smooth muscle cells. Am. J. Physiol. Heart Circ. Physiol. 2003;285:H2284–H2289. doi: 10.1152/ajpheart.00459.2003. [DOI] [PubMed] [Google Scholar]
- 31.Rey F.E., Li X.-C., Carretero O.A., Garvin J.L., Pagano P.J. Perivascular superoxide anion contributes to impairment of endothelium-dependent relaxation: role of gp91(phox) Circulation. 2002;106:2497–2502. doi: 10.1161/01.cir.0000038108.71560.70. [DOI] [PubMed] [Google Scholar]
- 32.Goettsch C., Goettsch W., Brux M., Haschke C., Brunssen C., Muller G., Bornstein S.R., Duerrschmidt N., Wagner A.H., Morawietz H. Arterial flow reduces oxidative stress via an antioxidant response element and Oct-1 binding site within the NADPH oxidase 4 promoter in endothelial cells. Basic Res. Cardiol. 2011;106:551–561. doi: 10.1007/s00395-011-0170-3. [DOI] [PubMed] [Google Scholar]
- 33.Siuda D., Zechner U., El Hajj N., Prawitt D., Langer D., Xia N., Horke S., Pautz A., Kleinert H., Förstermann U. Transcriptional regulation of Nox4 by histone deacetylases in human endothelial cells. Basic Res. Cardiol. 2012;107:283. doi: 10.1007/s00395-012-0283-3. [DOI] [PubMed] [Google Scholar]
- 34.Yang X.-J., Grégoire S. Class II histone deacetylases: from sequence to function, regulation, and clinical implication. Mol. Cell. Biol. 2005;25:2873–2884. doi: 10.1128/MCB.25.8.2873-2884.2005. [DOI] [PMC free article] [PubMed] [Google Scholar]
- 35.Wakabayashi N., Dinkova-Kostova A.T., Holtzclaw W.D., Kang M.-I., Kobayashi A., Yamamoto M., Kensler T.W., Talalay P. Protection against electrophile and oxidant stress by induction of the phase 2 response: fate of cysteines of the Keap1 sensor modified by inducers. Proc. Natl. Acad. Sci. U. S. A. 2004;101:2040–2045. doi: 10.1073/pnas.0307301101. [DOI] [PMC free article] [PubMed] [Google Scholar]
- 36.Brennan A.M., Suh S.W., Won S.J., Narasimhan P., Kauppinen T.M., Lee H., Edling Y., Chan P.H., Swanson R.A. NADPH oxidase is the primary source of superoxide induced by NMDA receptor activation. Nat. Neurosci. 2009;12:857–863. doi: 10.1038/nn.2334. [DOI] [PMC free article] [PubMed] [Google Scholar]
- 37.Demaurex N., Scorrano L. Reactive oxygen species are NOXious for neurons. Nat. Neurosci. 2009;12:819–820. doi: 10.1038/nn0709-819. [DOI] [PubMed] [Google Scholar]
- 38.Raj L., Ide T., Gurkar A.U., Foley M., Schenone M., Li X., Tolliday N.J., Golub T.R., Carr S.A., Shamji A.F. Selective killing of cancer cells by a small molecule targeting the stress response to ROS. Nature. 2011;475:231–234. doi: 10.1038/nature10167. [DOI] [PMC free article] [PubMed] [Google Scholar] [Retracted]
- 39.Gandhi S., Wood-Kaczmar A., Yao Z., Plun-Favreau H., Deas E., Klupsch K., Downward J., Latchman D.S., Tabrizi S.J., Wood N.W. PINK1-associated Parkinson's disease is caused by neuronal vulnerability to calcium-induced cell death. Mol. Cell. 2009;33:627–638. doi: 10.1016/j.molcel.2009.02.013. [DOI] [PMC free article] [PubMed] [Google Scholar]
- 40.Wakabayashi N., Itoh K., Wakabayashi J., Motohashi H., Noda S., Takahashi S., Imakado S., Kotsuji T., Otsuka F., Roop D.R. Keap1-null mutation leads to postnatal lethality due to constitutive Nrf2 activation. Nat. Genet. 2003;35:238–245. doi: 10.1038/ng1248. [DOI] [PubMed] [Google Scholar]
- 41.Abramov A.Y., Smulders-Srinivasan T.K., Kirby D.M., Acin-Perez R., Enriquez J.A., Lightowlers R.N., Duchen M.R., Turnbull D.M. Mechanism of neurodegeneration of neurons with mitochondrial DNA mutations. Brain. 2010;133:797–807. doi: 10.1093/brain/awq015. [DOI] [PMC free article] [PubMed] [Google Scholar]
- 42.He X., Kan H., Cai L., Ma Q. Nrf2 is critical in defense against high glucose-induced oxidative damage in cardiomyocytes. J. Mol. Cell. Cardiol. 2009;46:47–58. doi: 10.1016/j.yjmcc.2008.10.007. [DOI] [PubMed] [Google Scholar]
- 43.Shih A.Y., Imbeault S., Barakauskas V., Erb H., Jiang L., Li P., Murphy T.H. Induction of the Nrf2-driven antioxidant response confers neuroprotection during mitochondrial stress in vivo. J. Biol. Chem. 2005;280:22925–22936. doi: 10.1074/jbc.M414635200. [DOI] [PubMed] [Google Scholar]
- 44.Kraft A.D., Johnson D.A., Johnson J.A. Nuclear factor E2-related factor 2-dependent antioxidant response element activation by tert-butylhydroquinone and sulforaphane occurring preferentially in astrocytes conditions neurons against oxidative insult. J. Neurosci. 2004;24:1101–1112. doi: 10.1523/JNEUROSCI.3817-03.2004. [DOI] [PMC free article] [PubMed] [Google Scholar]
- 45.Habas A., Hahn J., Wang X., Margeta M. Neuronal activity regulates astrocytic Nrf2 signaling. Proc. Natl. Acad. Sci. U. S. A. 2013;110:18291–18296. doi: 10.1073/pnas.1208764110. [DOI] [PMC free article] [PubMed] [Google Scholar]
- 46.Lee J.-M., Calkins M.J., Chan K., Kan Y.W., Johnson J.A. Identification of the NF-E2-related factor-2-dependent genes conferring protection against oxidative stress in primary cortical astrocytes using oligonucleotide microarray analysis. J. Biol. Chem. 2003;278:12029–12038. doi: 10.1074/jbc.M211558200. [DOI] [PubMed] [Google Scholar]
- 47.Lee J.-M., Shih A.Y., Murphy T.H., Johnson J.A. NF-E2-related factor-2 mediates neuroprotection against mitochondrial complex I inhibitors and increased concentrations of intracellular calcium in primary cortical neurons. J. Biol. Chem. 2003;278:37948–37956. doi: 10.1074/jbc.M305204200. [DOI] [PubMed] [Google Scholar]
- 48.Innamorato N.G., Jazwa A., Rojo A.I., García C., Fernández-Ruiz J., Grochot-Przeczek A., Stachurska A., Jozkowicz A., Dulak J., Cuadrado A. Different susceptibility to the Parkinson's toxin MPTP in mice lacking the redox master regulator Nrf2 or its target gene heme oxygenase-1. PLoS One. 2010;5(7):e11838. doi: 10.1371/journal.pone.0011838. [DOI] [PMC free article] [PubMed] [Google Scholar]
- 49.Enomoto A., Itoh K., Nagayoshi E., Haruta J., Kimura T., O'Connor T., Harada T., Yamamoto M. High sensitivity of Nrf2 knockout mice to acetaminophen hepatotoxicity associated with decreased expression of ARE-regulated drug metabolizing enzymes and antioxidant genes. Toxicol. Sci. 2001;59:169–177. doi: 10.1093/toxsci/59.1.169. [DOI] [PubMed] [Google Scholar]
- 50.Sekhar K.R., Crooks P.A., Sonar V.N., Friedman D.B., Chan J.Y., Meredith M.J., Starnes J.H., Kelton K.R., Summar S.R., Sasi S. NADPH oxidase activity is essential for Keap1/Nrf2-mediated induction of GCLC in response to 2-indol-3-yl-methylenequinuclidin-3-ols. Cancer Res. 2003;63:5636–5645. [PubMed] [Google Scholar]
- 51.Segal B.H., Han W., Bushey J.J., Joo M., Bhatti Z., Feminella J., Dennis C.G., Vethanayagam R.R., Yull F.E., Capitano M. NADPH oxidase limits innate immune responses in the lungs in mice. PLoS ONE. 2010;5:e9631. doi: 10.1371/journal.pone.0009631. [DOI] [PMC free article] [PubMed] [Google Scholar]
- 52.Pendyala S., Moitra J., Kalari S., Kleeberger S.R., Zhao Y., Reddy S.P., Garcia J.G.N., Natarajan V. Nrf2 regulates hyperoxia-induced Nox4 expression in human lung endothelium: identification of functional antioxidant response elements on the Nox4 promoter. Free Radic. Biol. Med. 2011;50:1749–1759. doi: 10.1016/j.freeradbiomed.2011.03.022. [DOI] [PMC free article] [PubMed] [Google Scholar]
- 53.Matsushima S., Kuroda J., Ago T., Zhai P., Park J.Y., Xie L.-H., Tian B., Sadoshima J. Increased oxidative stress in the nucleus caused by Nox4 mediates oxidation of HDAC4 and cardiac hypertrophy. Circ. Res. 2013;112:651–663. doi: 10.1161/CIRCRESAHA.112.279760. [DOI] [PMC free article] [PubMed] [Google Scholar]
- 54.Wu K.C., Cui J.Y., Klaassen C.D. Beneficial role of Nrf2 in regulating NADPH generation and consumption. Toxicol. Sci. 2011;123:590–600. doi: 10.1093/toxsci/kfr183. [DOI] [PMC free article] [PubMed] [Google Scholar]
- 55.Mitsuishi Y., Taguchi K., Kawatani Y., Shibata T., Nukiwa T., Aburatani H., Yamamoto M., Motohashi H. Nrf2 redirects glucose and glutamine into anabolic pathways in metabolic reprogramming. Cancer Cell. 2012;22:66–79. doi: 10.1016/j.ccr.2012.05.016. [DOI] [PubMed] [Google Scholar]
- 56.Singh A., Happel C., Manna S.K., Acquaah-Mensah G., Carrerero J., Kumar S., Nasipuri P., Krausz K.W., Wakabayashi N., Dewi R. Transcription factor NRF2 regulates miR-1 and miR-206 to drive tumorigenesis. J. Clin. Invest. 2013;123:2921–2934. doi: 10.1172/JCI66353. [DOI] [PMC free article] [PubMed] [Google Scholar]
- 57.Thimmulappa R.K., Mai K.H., Srisuma S., Kensler T.W., Yamamoto M., Biswal S. Identification of Nrf2-regulated genes induced by the chemopreventive agent sulforaphane by oligonucleotide microarray. Cancer Res. 2002;62:5196–5203. [PubMed] [Google Scholar]
- 58.Takahashi S., Izawa Y., Suzuki N. Astroglial pentose phosphate pathway rates in response to high-glucose environments. ASN Neuro. 2012;4 doi: 10.1042/AN20120002. [DOI] [PMC free article] [PubMed] [Google Scholar]
- 59.Ago T., Liu T., Zhai P., Chen W., Li H., Molkentin J.D., Vatner S.F., Sadoshima J. A redox-dependent pathway for regulating class II HDACs and cardiac hypertrophy. Cell. 2008;133:978–993. doi: 10.1016/j.cell.2008.04.041. [DOI] [PubMed] [Google Scholar]
- 60.Ghosh D., LeVault K.R., Brewer G.J. Dual-energy precursor and nuclear erythroid-related factor 2 activator treatment additively improve redox glutathione levels and neuron survival in aging and Alzheimer mouse neurons upstream of reactive oxygen species. Neurobiol. Aging. 2014;35:179–190. doi: 10.1016/j.neurobiolaging.2013.06.023. [DOI] [PMC free article] [PubMed] [Google Scholar]