

ABSTRACT
Clostridium perfringens epsilon toxin (ε-toxin) is responsible for a devastating multifocal central nervous system (CNS) white matter disease in ruminant animals. The mechanism by which ε-toxin causes white matter damage is poorly understood. In this study, we sought to determine the molecular and cellular mechanisms by which ε-toxin causes pathological changes to white matter. In primary CNS cultures, ε-toxin binds to and kills oligodendrocytes but not astrocytes, microglia, or neurons. In cerebellar organotypic culture, ε-toxin induces demyelination, which occurs in a time- and dose-dependent manner, while preserving neurons, astrocytes, and microglia. ε-Toxin specificity for oligodendrocytes was confirmed using enriched glial culture. Sensitivity to ε-toxin is developmentally regulated, as only mature oligodendrocytes are susceptible to ε-toxin; oligodendrocyte progenitor cells are not. ε-Toxin sensitivity is also dependent on oligodendrocyte expression of the proteolipid myelin and lymphocyte protein (MAL), as MAL-deficient oligodendrocytes are insensitive to ε-toxin. In addition, ε-toxin binding to white matter follows the spatial and temporal pattern of MAL expression. A neutralizing antibody against ε-toxin inhibits oligodendrocyte death and demyelination. This study provides several novel insights into the action of ε-toxin in the CNS. (i) ε-Toxin causes selective oligodendrocyte death while preserving all other neural elements. (ii) ε-Toxin-mediated oligodendrocyte death is a cell autonomous effect. (iii) The effects of ε-toxin on the oligodendrocyte lineage are restricted to mature oligodendrocytes. (iv) Expression of the developmentally regulated proteolipid MAL is required for the cytotoxic effects. (v) The cytotoxic effects of ε-toxin can be abrogated by an ε-toxin neutralizing antibody.
IMPORTANCE
Our intestinal tract is host to trillions of microorganisms that play an essential role in health and homeostasis. Disruption of this symbiotic relationship has been implicated in influencing or causing disease in distant organ systems such as the brain. Epsilon toxin (ε-toxin)-carrying Clostridium perfringens strains are responsible for a devastating white matter disease in ruminant animals that shares similar features with human multiple sclerosis. In this report, we define the mechanism by which ε-toxin causes white matter disease. We find that ε-toxin specifically targets the myelin-forming cells of the central nervous system (CNS), oligodendrocytes, leading to cell death. The selectivity of ε-toxin for oligodendrocytes is remarkable, as other cells of the CNS are unaffected. Importantly, ε-toxin-induced oligodendrocyte death results in demyelination and is dependent on expression of myelin and lymphocyte protein (MAL). These results help complete the mechanistic pathway from bacteria to brain by explaining the specific cellular target of ε-toxin within the CNS.
INTRODUCTION
The human gut harbors one of the most diverse microbial communities known (1, 2). This complex ecology encompasses an almost unfathomable number of microbe-microbe, host-microbe, and other microbial and environmental interactions vital to host health and homeostasis. Consequently, disruption of this healthy symbiosis between the microbiome and host is implicated in numerous diseases. The specific mechanisms by which the gut microbiome causes central nervous system (CNS) disease remains unclear.
In ruminant animals, Clostridium perfringens epsilon toxin (ε-toxin) is responsible for a distinct CNS disease that is characterized by blood-brain barrier (BBB) disruption and white matter injury (3–8). This process is an ideal model for studying how a gut microbe causes specific CNS disease. The path that this 29-kDa pore-forming toxin of the aerolysin family (9, 10) makes from bacterium to brain to cause white matter injury is only partially understood.
C. perfringens is a Gram-positive, spore-forming anaerobic rod that carries genes encoding more than 17 exotoxins, but it is conventionally categorized into five toxinotypes, A to E, based on carriage of one or more of the major toxin genes (alpha, beta, epsilon, or iota) (11). The type B and type D strains of C. perfringens carry the ε-toxin gene (12). ε-Toxin is secreted as a poorly active 33-kDa protoxin into the intestinal lumen where it is enzymatically cleaved by host trypsin, α-chymotrypsin, or a C. perfringens gene-encoded λ-protease, to its 29-kDa active form.
Active ε-toxin binds to the intestinal epithelium to induce epithelial permeability in the absence of overt histologic damage (13). It should be noted that ε-toxin does not cause diarrheal illness but instead slows intestinal motility (14). It is unclear how ε-toxin enters the bloodstream once it is past the intestinal epithelial barrier, but presumably, the toxin causes permeability of the intestinal microvasculature. Once ε-toxin has entered the bloodstream, it binds to CNS endothelial cells of the blood-brain and blood-retinal barriers (15–20). The effects of ε-toxin at the blood-brain barrier are well described, ranging from focal defects in permeability to frank cerebral edema (4, 8, 15, 16, 19–24). However, the mechanism by which ε-toxin induces permeability of the blood-brain barrier remains undetermined. Following blood-brain barrier disruption, ε-toxin enters the brain parenchyma where it then has access to all cell types within the CNS (25).
The first studies on the CNS effects of systemic ε-toxin showed that the earliest changes within CNS white matter were characterized by swelling of the myelin sheaths (21). Numerous subsequent pathological studies emphasized the focal symmetric insult to white matter (4, 5, 21). More recently, direct binding of ε-toxin to white matter suggested a potential cellular specificity for myelin (26). Focal insults to white matter and binding of ε-toxin to myelin suggest that the toxin might directly bind and cause injury to oligodendrocytes or myelin. Interestingly, ε-toxin has been hypothesized to play a role in multiple sclerosis (27, 28), an inflammatory, demyelinating disease, of the human CNS, characterized by disruption of the blood-brain barrier and oligodendrocyte death. However, ambiguity remains, given that a number of studies have reported direct cytotoxic effects of ε-toxin on neurons in the hippocampus, granule cells of the cerebellum (4, 29–32), microglia, and astrocytes (25).
In this study, we define the oligodendrocyte as the unique cellular target of ε-toxin in the CNS. We show that ε-toxin causes selective death of oligodendrocytes and demyelination with preservation of neurons, astrocytes, and microglia. We define a developmental dependence of epsilon toxin-mediated oligodendrocyte death on expression of the myelin and lymphocyte protein (MAL) proteolipid. These results provide novel mechanistic insights into the pathophysiology of C. perfringens type B or D enterotoxemia.
RESULTS
ε-Toxin binds to and specifically kills oligodendrocytes.
Because ε-toxin was previously established to bind myelinated regions of the central nervous system (26), we hypothesized that ε-toxin is binding to oligodendrocytes, the myelinating cells of the CNS and to myelin membranes. To determine the specific cell types ε-toxin binds to in the CNS, we examined dissociated glial cultures derived from murine forebrains, which are comprised of glial fibrillary acidic protein (GFAP)-positive astrocytes, CD68-positive microglia, and myelin basic protein (MBP)-, myelin-associated glycoprotein (MAG)-, myelin proteolipid protein (PLP)-, and O1-positive oligodendrocytes (Fig. 1). Cultures were negative for NG2-positive oligodendrocyte progenitor cells (OPCs) or NeuN-positive neurons. Binding to specific glial populations was determined by colocalization of Alexa Fluor 594-conjugated ε-protoxin (proETX-594) with the cell-specific markers. The binding specificity of ε-protoxin and active ε-toxin overlap in the CNS as shown before (26).
FIG 1 .
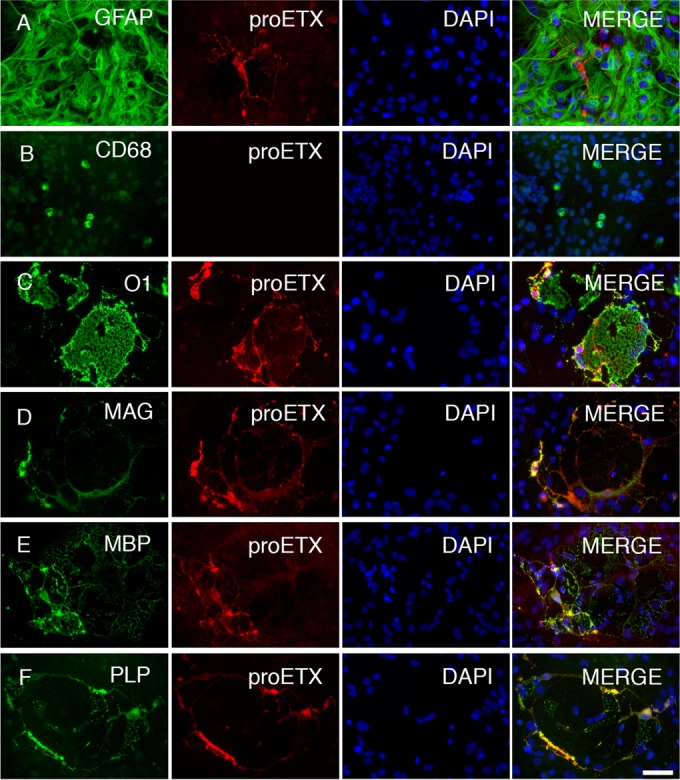
ε-Toxin specifically binds to oligodendrocytes in the CNS. Mixed murine glial cells were grown in media promoting oligodendrocyte differentiation. (A to F) Fixed cells were stained for cell-specific markers, including anti-GFAP for astrocytes (A), anti-CD68 for microglial cells (B), and anti-O1 (C), anti-MAG (D), anti-MBP (E), and anti-PLP (F) for oligodendrocytes. To determine the specificity of ε-toxin binding, stained cells were probed with Alexa Fluor 598-conjugated ε-protoxin (proETX). Nuclei were visualized with DAPI. Bar, ca. 20 µm.
Our data demonstrate that ε-toxin colocalization was detected only on oligodendrocytes identified by O1, MAG, MBP, and PLP, whereas ε-toxin did not colocalize with the astrocyte marker GFAP or the microglial marker CD68 (Fig. 1). proETX-594-positive cells could not be located in the same vicinity as CD68-positive microglia. These results indicate that ε-toxin binding is specific and exclusive to oligodendrocytes in the CNS.
Because ε-toxin binds only to oligodendrocytes, we sought to determine whether ε-toxin-mediated cell death was specific to oligodendrocytes in the context of a mixed glial culture. Mixed glial cultures were treated with active ε-toxin for 1 h and stained with an O1 antibody to identify oligodendrocytes (Fig. 2A and B). Cell viability was evaluated by propidium iodide (PI) exclusion. ε-Toxin treatment significantly increased oligodendrocyte death in a dose-dependent manner compared to untreated controls. Treatment with 5 nM, 10 nM, 50 nM, and 100 nM concentrations of ε-toxin for 1 h lead to 18.1%, 35.1%, 41.8%, and 45.7% of oligodendrocyte death, respectively, whereas only 7% oligodendrocyte cell death was observed in the untreated controls (Fig. 2B).
FIG 2 .
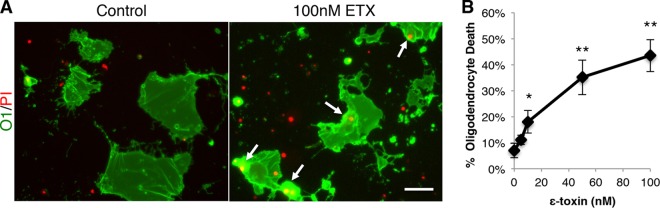
ε-Toxin kills oligodendrocytes. (A) To identify oligodendrocytes grown in mixed primary glial culture, the cells were stained live with anti-O1 antibodies. Mixed cells were grown in media to promote oligodendrocyte maturation. Cell viability was evaluated by PI exclusion. Cultures were treated with 100 nM ε-toxin (ETX) for 4 h, and cell viability was evaluated by PI inclusion. Arrows point to PI-positive, O1-positive (O1+) cells. Bar, ca. 50 µm. (B) Quantification of the percentage of dead oligodendrocytes indicated ε-toxin doses for 1 h. The percentage of dead oligodendrocytes was calculated by dividing the number of PI-positive O1+ cells by the total number of O1+ cells. Values are means ± standard deviations (SD) (error bars). Values that are significantly different from the value for the untreated control by ANOVA are indicated by asterisks as follows: *, P < 0.02; **, P < 0.001. There were 3 to 4 replicates for each condition. Similar results were obtained in two independent experiments.
To exclude the possible by-stander influence of other glial cells on ε-toxin-mediated oligodendrocyte death, cell viability after ε-toxin treatment was evaluated in enriched oligodendrocyte cultures. OPCs were isolated from mixed glial cultures and grown in oligodendrocyte maturation medium. Enriched oligodendrocyte cultures were primarily MBP positive with very few or no GFAP-, CD68-, or NG2-positive cells (see Fig. S1A and S1B in the supplemental material). The majority of MBP-positive cells also bind proETX-594 (Fig. S1B). This heterogeneity likely indicates varied expression of ε-toxin receptor among oligodendrocyte subpopulations and may explain why less than 100% of O1-positive cells are ε-toxin sensitive. Live enriched oligodendrocyte cultures were stained with O1 (Fig. S1C) and treated with 50 nM ε-toxin for 1 and 6 h, and cell death was evaluated by PI exclusion. After 1 and 6 h of treatment, ε-toxin significantly decreased oligodendrocyte viability compared to untreated controls (Fig. S1D).
To further assess the specificity of ε-toxin for oligodendrocytes, enriched cultures of astrocytes and microglia were treated with ε-toxin. Enriched astrocyte cultures were primarily GFAP positive, but they did contain residual contaminating CD68-positive microglial cells and oligodendrocyte debris (see Fig. S2A in the supplemental material). Enriched astrocyte cultures were treated with 5 nM, 10 nM, and 50 nM ε-toxin for 24 h, and cell viability was evaluated by PI exclusion. No difference in cell viability was observed between the controls and ε-toxin-treated astrocytes (Fig. S2B). Enriched microglia cultures were primarily composed of CD68-positive cells (Fig. S3A) and exhibit no significant increase in cell death after 24 h of ε-toxin treatment compared to untreated control cells (Fig. S3B). Taken together, our data demonstrate that ε-toxin exclusively and specifically kills oligodendrocytes and has no direct effect on astrocytes or microglia.
ε-Toxin causes demyelination in cerebellar organotypic slice cultures.
To study the effects of ε-toxin within the complex cytoarchitecture of the CNS, we used cerebellar organotypic slice cultures which faithfully recapitulate the complex events of myelination, allowing investigation into mechanisms of demyelination and remyelination (33, 34). Cerebellar tissue slices were prepared from brains obtained from postnatal day 7 pups and cultured in vitro for 4 weeks prior to being treated with ε-toxin. ε-Toxin treatment caused demyelination, as evaluated by MPB immunofluorescence (Fig. 3). ε-Toxin-mediated demyelination is dependent on both dose (Fig. 3A and C) and time (Fig. 3B and D). After 20 h of ε-toxin treatment, a significant reduction of MPB was observed at 50 pM, 500 pM, 5 nM, and 50 nM concentrations when compared to the untreated control. When treated with 5 nM ε-toxin, a significant decrease in MPB is observed after 8 h of treatment. Importantly, there is no significant reduction in 4′,6′-diamidino-2-phenylindole (DAPI) fluorescence after ε-toxin treatment, indicating that the reduction in MPB is oligodendrocyte specific and not due to indiscriminate toxic effects of ε-toxin.
FIG 3 .

ε-Toxin treatment causes demyelination in cerebellar slice culture. ε-Toxin exposure leads to dose-dependent loss of MPB immunostaining. (A and C) Representative images (A) and quantification (C) of MBP immunostaining (green) and DAPI (blue) when the slices were treated with the indicated concentrations of ε-toxin for 20 h. DAPI (blue) was used to visualize nuclei. ε-Toxin exposure leads to time-dependent reduction of MBP immunostaining. (B and D) Representative images (B) or quantification (D) of MBP and DAPI immunostaining when the slices were treated with 5 nM ε-toxin for the indicated time points normalized to the values for untreated controls (CT or 0 h) (100%). ε-Toxin treatment does not reduce the number of neurons in slice culture. (E and F) Representative images (E) and quantitation (F) of NeuN immunostaining (green) when the slices were treated with 10 nM ε-toxin for 20 h. Results are normalized to the values for untreated controls (100%). The insets in the NeuN row of images show the regions at low magnification in corresponding conditions at a higher magnification to illustrate the nuclear staining pattern of NeuN, a neuronal marker. Values in panels C, D, and F are means ± standard errors of the means (SEM) (error bars). Values that are significantly different by two-tailed Student’s t test are indicated by asterisks as follows: **, P < 0.01; ***, P < 0.001. There were five to eight slices for each condition. Similar results were obtained in at least two independent experiments. Bars, 500 µm (for low-magnification views) and 10 µm (insets).
These data are supported by the fact that there is no significant difference in the number of neurons indicated by NeuN (Fig. 3E and F) or microglia cells labeled by CD68 (Fig. 4A and B) after ε-toxin treatment. However, GFAP immunofluorescence increases after 20 h of 50 nM ε-toxin treatment compared to controls (Fig. 4C to E), consistent with secondary astrocyte activation. This occurrence is in marked contrast to the significant decrease in 2′,3′-cyclic nucleotide 3′-phosphodiesterase (CNPase) immunofluorescence observed in the same slices at ε-toxin doses as low as 50 pM. In addition, there is a severe reduction in CNPase immunofluorescence at 50 nM ε-toxin, indicating a substantial reduction in myelin membranes. Taken together, our data indicate that astrocyte activation may be a secondary response to widespread oligodendrocyte death and/or demyelination.
FIG 4 .

ε-Toxin does not affect microglia in cerebellar slice cultures but does increase astrocyte reactivity. (A and B) Representative images (A) and quantitation (B) of CD68 immunostaining (green) treated with 5 nM ε-toxin or without ε-toxin at the indicated time points. Bar, 20 µm. (C to E) High doses of ε-toxin increase expression of the reactive astrocyte marker GFAP. Representative images (C) and quantitation (E) of immunostaining for GFAP (red) after ε-toxin (ETX) treatment at the indicated doses for 20 h. CNPase (green) immunostaining was evaluated in the same slices as a positive control of ε-toxin activity against oligodendrocytes. DAPI (blue) is counterstained to identify cell nuclei. Bar, 500 µm. Regions framed in low-magnification images (C) are shown at higher magnification (D) to illustrate immunostaining details in respective conditions. Bars, 100 µm. All results are normalized to the values for untreated controls (100%). Values are means ± SEM. Values that are significantly different by two-tailed Student’s t test are indicated by asterisks as follows: *, P < 0.05; **, P < 0.01; ***, P < 0.001. There were 5 or 6 slices for each condition. Similar results were obtained in at least two independent experiments.
ε-Toxin-mediated cell death is dependent on oligodendrocyte maturation.
Heterogeneity among oligodendrocytes for expression of the ε-toxin receptor is indicated by three observations. (i) Not all MBP-positive (MBP+) oligodendrocytes bind ε-toxin. (ii) Not all O1-positive (O1+) oligodendrocytes die after ε-toxin treatment in mixed culture. (iii) Not all MBP+ oligodendrocytes disappear after ε-toxin treatment in slice culture. We hypothesized that oligodendrocyte maturation may be influencing ε-toxin receptor expression, thereby affecting ε-toxin binding and susceptibility of oligodendrocytes at different developmental stages.
To investigate ε-toxin binding and its dependence on oligodendrocyte maturation, ε-toxin binding in combination with NG2 and MBP immunostaining was evaluated by immunohistochemistry (IHC) on postnatal day 17 brain tissue sections (Fig. 5A and B). Although there is robust proETX-594 binding in the white matter, there is no colocalization with NG2 staining. In comparison, there is robust colocalization of proETX-594 and MBP staining, indicating that ε-toxin binds to mature, myelinating oligodendrocytes but not OPCs.
FIG 5 .
ε-Toxin binding and toxicity depend on oligodendrocyte maturation. (A and B) To determine whether ε-toxin binds to OPCs or mature oligodendrocytes, brain slices from P17 pups were immunostained for NG2 (A) or MBP (B), respectively, and probed with Alexa Fluor 594-labeled ε-protoxin (proETX-594). (C) Quantification of staining intensity for A2B5 or MBP after ε-toxin treatment. Primary mixed glial cultures were grown in media to promote OPC proliferation or oligodendrocyte differentiation. To determine ε-toxin toxicity on immature and mature oligodendrocytes, cultures were treated with the indicated doses of ε-toxin for 24 h. OPC cultures were stained for A2B5, and oligodendrocyte differentiation cultures were stained for MBP. Relative intensity was normalized to untreated controls (100%). Values are means ± SEM (n = 6 to 8). Values that are significantly different (P ≤ 0.05) from the value for A2B5 by Mann-Whitney rank sum test are indicated (*). (D) Primary mixed glial cultures were grown in media to promote OPC proliferation or oligodendrocyte differentiation. To determine the effect of ε-toxin on cell morphology, cultures were treated with the indicated doses of ε-toxin for 24 h. OPC cultures were stained for A2B5 (top row) and oligodendrocyte differentiation cultures were stained for O1 (bottom row). Green arrowheads point to A2B5 cells with healthy processes. Green arrows point to healthy O1+ cells with full, extended membranes. Red arrowheads point to O1+ cells with retracted membranes and processes. Similar results were obtained in two independent experiments. Bar, ca. 100 µm.
To further characterize ε-toxin binding and its dependence on oligodendrocyte maturation, developmental profiling of proETX-594 binding and O1 expression was performed on brain tissues from early postnatal stages through adulthood (see Fig. S4 in the supplemental material). O1 staining was evaluated to maintain consistency with earlier experiments (Fig. 1 and Fig. S1). Strong O1+ staining is observed as early as postnatal day 8 in the cerebellum and postnatal day 14 in the corpus callosum. Robust proETX-594 binding and colocalization with O1 is observed by postnatal day 14 in the cerebellum. Weak proETX-594 staining is observed as early as postnatal day 14 in the corpus callosum; however, strong staining and colocalization with O1 is not observed until postnatal day 22, indicating that ε-toxin binding follows oligodendrocyte maturation. The observation that O1 positivity precedes ε-toxin binding may explain the incomplete susceptibility of O1-positive oligodendrocytes to ε-toxin in vitro.
Because the above data suggest that ε-toxin is binding to mature oligodendrocytes, we evaluated the sensitivity of OPCs to ε-toxin treatment. For this purpose, mixed glial cells were grown in medium to promote OPC proliferation and were compared to mixed primary glia cells grown in medium to promote oligodendrocyte maturation for sensitivity to ε-toxin. MBP immunofluorescence in mixed glial culture significantly decreases after 24 h of 5, 10, 50, and 100 nM ε-toxin treatments compared to untreated controls (Fig. 5C). No difference was observed in A2B5 immunofluorescence after the same ε-toxin treatments. O1+ oligodendrocytes also exhibit morphological changes after ε-toxin treatment, while A2B5+ cells do not (Fig. 5D). Specifically, untreated control O1+ cells have wide, fully extended sheet-like membranes. O1+ cells treated with ε-toxin doses as low as 1 nM exhibit membrane retraction and disintegration.
MAL is required for ε-toxin binding to CNS white matter, oligodendrocyte death, and demyelination.
Although HAVCR1 and caveolins 1 and 2 have been shown to play a role in ε-toxin binding and cytotoxicity in cell lines (35, 36), the receptor for CNS white mater and oligodendrocytes is still unknown. Because MAL is required for ε-toxin binding to myelin in mice, we choose to evaluate the role of MAL in oligodendrocyte susceptibility to ε-toxin (37). MAL is a proteolipid expressed during late myelination in the CNS and plays a role in proper maintenance of CNS paranodes (38).
To evaluate MAL’s role in ε-toxin binding to CNS white matter, brain tissue from mice deficient in MAL (Mal−/−) and wild-type mice (Mal+/+) were probed with proETX-594. Strong colocalization is observed with MAL immunostaining and proETX-594 in the white matter of Mal+/+ mice (Fig. 6A). proETX-594 binding was not observed in Mal−/− mice, nor was there any MAL expression detected, as expected. This indicates that MAL is necessary for ε-toxin binding to white matter in the CNS.
FIG 6 .

MAL is required for ε-toxin binding, oligodendrocyte death, and myelin loss. (A) Micrographs of MAL expression and Alexa Fluor 594-labeled ε-toxin (proETX) in the corpus callosum of wild-type (Mal+/+) and MAL-deficient (Mal−/−) mice. The nuclei were visualized with DAPI. (B) Primary glial culture from Mal+/+ and Mal−/− mice grown in media to promote oligodendrocyte differentiation treated with 50 nM ε-toxin or without ε-toxin (CT) for 4 h. Live cultures were stained with O1 antibodies, and cell viability was assessed by PI exclusion. Percent oligodendrocyte death was quantified as previously described. Values are means ± SD (n = 3 or 4). Values that are significantly different (P < 0.001) by ANOVA are indicated by a bar and an asterisk. Values that are not significantly different by ANOVA are indicated (ns). Similar results were obtained in three independent experiments. (C) Cerebellar slice cultures from Mal+/+ and Mal−/− mice were treated with 5 nM ε-toxin for 20 h, and MBP expression was compared to the values for untreated controls via immunostaining. (D) Quantification of MBP staining (n = 5 or 6 slices for each condition) normalized to the values for the respective controls (100%). Values that are significantly different (P < 0.001) by two-tailed Student’s t test are indicated (***). Similar results were obtained in three independent experiments. Bar, 500 µm.
MAL’s role in oligodendrocyte susceptibility was assessed by evaluating O1+ cell death in mixed glial culture isolated from Mal−/− mice after ε-toxin treatment (Fig. 6B). No significant difference is observed between control and ε-toxin-treated oligodendrocytes from Mal−/− mice. ε-Toxin significantly increased Mal+/+ oligodendrocyte death compared to untreated controls as determined by PI staining. In addition, cerebellar slice cultures from Mal−/− mice did not exhibit demyelination compared to their Mal+/+ controls (Fig. 6C and D). This indicates that MAL is required for oligodendrocyte susceptibility to ε-toxin.
ε-Toxin neutralizing antibody prevents oligodendrocyte death and demyelination.
Previous studies have demonstrated that neutralizing antibodies against ε-toxin can protect mice from ε-toxin-mediated death (39). To determine whether ε-toxin-mediated oligodendrocyte death and demyelination could be inhibited with a neutralizing antibody (40) against ε-toxin, mixed primary glial cells were treated with a neutralizing antibody against ε-toxin immediately prior to ε-toxin treatment (Fig. 7A and B). A large amount of cell death is visible in mixed glial cultures by PI staining 24 h after treatment with 10 nM and 100 nM ε-toxin. The addition of the neutralizing antibody just prior to ε-toxin treatment significantly inhibited the number of PI-positive cells. A series of antibody dilutions (1:10,000, 1:1,000, and 1:100) were evaluated. All antibody dilutions significantly inhibited cell death when treated with 10 nM and 100 nM ε-toxin. Furthermore, addition of the neutralizing antibody also inhibited ε-toxin-mediated demyelination in cerebellar slice cultures (Fig. 7B and D). Twenty hours of 5 nM ε-toxin treatment significantly reduced the immunofluorescence of MBP compared to untreated controls. Addition of the ε-toxin neutralizing antibody protected the slice culture from ε-toxin-mediated demyelination as assessed by MBP immunofluorescence.
FIG 7 .

Neutralizing ε-toxin antibody protects oligodendrocytes from cell death and prevents myelin loss. (A) Primary mixed glial cells were treated with the indicated ε-toxin (ETX) doses and ε-toxin neutralizing antibody (AB) dilutions for 24 h. Cell viability was evaluated by PI exclusion. (B) Quantification of cell death in mixed culture treated with the indicated doses of ε-toxin and neutralizing antibody dilutions. The percent cell death was calculated by enumerating the number of PI-positive nuclei and normalizing the values against the values for the controls (100%). Values are means ± SD (n = 3). Values that are significantly different (P < 0.001) by ANOVA from the values for the control are indicated by an asterisk. Similar results were obtained in two independent experiments. (C) MBP immunostaining (green) of untreated cerebellar slices (control [CT]), slices treated with 5 nM ε-toxin (5nM ETX), or slices treated with 5 nM ε-toxin plus neutralizing ε-toxin antibody (5nM ETX + AB) for 20 h. DAPI (blue) is counterstained to identify cell nuclei. Bar, 500 µm. (D) Quantification of MBP staining normalized to control (100%). Values are means ± SEM. There were 5 or 6 slices for each condition. Values that are significantly different (P < 0.001) from the value for the control by two-tailed Student’s t test are indicated (***). Similar results were obtained in three independent experiments.
DISCUSSION
Clostridium perfringens type B and type D cause a unique CNS disease characterized by blood-brain barrier disruption and focal lesions most notably localized to white matter (3–8). The CNS manifestations of C. perfringens type D-mediated disease are wholly dependent on ε-toxin, since targeted loss of function of the ε-toxin gene renders the organism incapable of causing CNS pathology, and restoration of a functional ε-toxin gene reestablishes the CNS phenotype (6, 7).
ε-Toxin-mediated disease is often referred to as enterotoxemia because the inciting organism produces toxin within the gut that then enters the bloodstream. Some readers erroneously confuse enterotoxemia with enteritis (41). This confusion arises because C. perfringens type, which does not produce ε-toxin, is associated with watery diarrheal illnesses in many species and also because C. perfringens strains that carry the C. perfringens enterotoxin (CPE) gene cause a severe enteritis which, in humans is associated with food poisoning (41). In contrast, C. perfringens type D causes CNS pathology without diarrhea or pathological changes in the gut and is considered a true enterotoxemia (41). For example, in a detailed necropsy of a calf that succumbed to C. perfringens type D white matter disease, the entire length of the digestive system from esophagus to rectum was normal (17). In mice, the toxin can be absorbed from any segment of gut other than stomach (42) and does not cause diarrhea but in fact slows intestinal motility (14). The increased intestinal permeability caused by ε-toxin is accompanied by ultrastructural but not light microscopic changes in the intestinal epithelium (13).
While ε-toxin-producing strains of C. perfringens are not considered typical pathogens of humans, Timothy Murrell first hypothesized that these typical sheep pathogens could cause multiple sclerosis (MS) based on the frequency of MS in regions where sheep populations were high and on the pathological similarities between epsilon enterotoxemia and MS: blood-brain barrier defects along with focal white matter lesions (27). We investigated the frequency of immunoreactivity to epsilon toxin in a cross-sectional analysis of banked serum and cerebrospinal fluid (CSF) samples from people with MS and controls. We found that about 10% of people with MS harbored antibodies to epsilon toxin in contrast to 1% of controls (28). Whether epsilon toxin is a causative agent for MS remains to be determined. The results of our current study support the concept that ε-toxin could initiate lesion formation because newly forming MS lesions are characterized by blood-brain barrier disruption, oligodendrocyte death, early changes in myelin, and complete preservation of neurons, astrocytes, and microglia (43, 44).
To determine whether ε-toxin specifically targets oligodendrocytes in the CNS, we analyzed primary mixed glia cultures and enriched cultures of oligodendrocytes, astrocytes, or microglia for binding and susceptibility to ε-toxin. Oligodendrocytes showed robust binding of ε-toxin, whereas astrocytes and microglia failed to bind ε-toxin. In cell death assays, oligodendrocytes were sensitive to ε-toxin in a dose-dependent fashion, while astrocyte and microglia viability was unaffected. We conclude that ε-toxin acts directly on oligodendrocytes to induce cell death and does not require a secondary/intermediate cell type for its action because of the following. (i) ε-Toxin binds only to oligodendrocytes and myelin in the CNS. (ii) ε-Toxin-mediated oligodendrocyte death occurred to similar extents in both mixed glial cultures and enriched oligodendrocyte cultures.
As with dissociated primary CNS cultures, ε-toxin induced robust and specific oligodendrocyte death in cerebellar slice cultures as assessed by CNPase staining. Neuronal, astroglial, and microglial cell numbers were not negatively affected by ε-toxin treatment in cerebellar slices. Although previous studies have observed that ε-toxin binds to and stimulates glutamate release in cerebellum granule cells (31), we did not observe a cytotoxic effect of ε-toxin on neuronal cells in our cerebellum culture system.
ε-Toxin treatment resulted in loss of MBP immunoreactivity, consistent with oligodendrocyte death and demyelination. Interestingly, GFAP immunofluorescence increased at high ε-toxin treatments of 50 nM, indicating activation of astrocytes. We believe that astrocyte activation is a secondary response to ε-toxin-induced oligodendrocyte death, as both MBP and CNPase activity greatly decreased at this dose, indicating substantial oligodendrocyte death. Astrocyte activation is a common response to CNS injury (45). While oligodendrocyte death might result from astrocyte activation, as seen in other systems (46), this occurrence seems unlikely, as CNPase immunofluorescence decreased with low ε-toxin doses that did not affect GFAP expression. Furthermore, oligodendrocytes grown in the absence of astrocytes were still susceptible to ε-toxin cytotoxicity.
Oligodendrocyte susceptibility to ε-toxin required oligodendrocyte maturation: OPCs identified by A2B5 staining were insensitive to ε-toxin treatment, as A2B5 immunofluorescence did not decrease after ε-toxin treatment. In addition, ε-toxin did not bind to NG2+ cells in tissue sections and did not bind to CNS white matter until postnatal day 14. These findings are consistent with what is observed in MS where OPCs have been detected in early and established MS lesions (47, 48). Although OPC recruitment and differentiation in the in vivo environment are complicated processes with numerous factors involved (47, 48), ε-toxin’s indifference to OPCs would allow for OPC differentiation, permitting spontaneous remyelination after ε-toxin-mediated demyelination. This is consistent with the occurrence of spontaneous remyelination in MS (43, 49, 50).
The ε-toxin receptor is unknown. We have shown that introduction of the myelin and lymphocyte protein (MAL) into transfected cell lines renders them susceptible to ε-toxin binding and toxicity (K. R. Rumah et al., submitted for publication). We assessed the requirement of MAL for ε-toxin-mediated cell death in oligodendrocytes. In the absence of MAL, oligodendrocytes were completely resistant to the effects of ε-toxin. The dependence of oligodendrocyte susceptibility to ε-toxin on cell maturation likely relates to the timing of MAL expression. In the developing rat brain, MAL expression lags 3 to 5 days behind MBP expression and after PLP expression (51). Although we have demonstrated that MAL is necessary for ε-toxin binding and cell-mediated toxicity, it is unclear whether MAL directly interacts with ε-toxin. MAL is a tetraspan proteolipid primarily expressed by oligodendrocytes and Schwann cells and is a component of compact myelin (52). In the CNS, MAL plays a role in proper myelin organization and paranode maintenance (38). Theoretically, ε-toxin could bind to one or both of the extracellular loops of MAL (53). MAL forms cholesterol-dependent complexes with apical proteins and recruits apical proteins to detergent-resistant membranes (54). Therefore, MAL may be functioning as a lipid raft scaffolding protein, maintaining a complex that allows ε-toxin binding to other proteins and assists in pore formation.
The observation that ε-toxin targets only mature oligodendrocytes and is dependent on MAL expression may explain why not all of our oligodendrocytes in mixed and enriched cultures were susceptible to ε-toxin. In these experiments, only 30 to 45% of O1+ oligodendrocytes died after ε-toxin treatment. As O1+ expression precedes MBP expression (55) and MBP expression precedes MAL expression in the rodent CNS (51), it seems plausible that not all O1+ oligodendrocytes are developmentally mature enough to be susceptible to ε-toxin.
Wioland et al. recently reported that ε-toxin-mediated demyelination in rat cerebellar slice cultures occurred in the absence of oligodendrocyte death (56), which is in contrast to our findings of ε-toxin-induced death of mature oligodendrocytes. The reasons for these differences are unclear, but one possibility is that Wioland et al. evaluated cell viability by measuring extracellular release and activity of glucose-6-phosphate dehydrogenase (G6PDH) in an assay that is better suited to cell lysis or necrosis and may be insensitive to other forms of cell death. In addition, Wioland et al. did not observe ε-toxin-mediated oligodendrocyte death in mixed cultures by trypan blue exclusion. In our experience, it is difficult to reliably distinguish oligodendrocytes from other cell types in mixed cultures in a trypan blue assay. In contrast, we used cell-specific and lineage-specific markers in conjunction with PI exclusion to distinguish cell death in oligodendrocytes from other glia cells in mixed cultures. Importantly, we verified the specific effect of ε-toxin on oligodendrocytes by use of enriched cultures. Both studies indicate that epsilon toxin induces demyelination in vitro. Under the experimental conditions of Wioland et al., it still remains unclear whether ε-toxin-induced demyelination is a result of an extracellular increase in glutamate concentration without oligodendrocyte death. In comparison, ε-toxin-induced demyelination under our experimental conditions appears to be a direct effect of ε-toxin-induced oligodendrocyte death.
In conclusion, our study significantly advances and expands on ε-toxin-induced demyelination by demonstrating the following. (i) ε-Toxin specifically kills oligodendrocytes. (ii) ε-Toxin does not affect neuron, microglia, or astrocyte viability. (iii) ε-Toxin activity against oligodendrocytes is dependent on oligodendrocyte maturation. (iv) ε-Toxin activity against oligodendrocytes is dependent on MAL expression. Current studies are under way to investigate the role of MAL in ε-toxin-induced BBB permeability and whether ε-toxin interacts directly with MAL.
MATERIALS AND METHODS
Ethics statement.
All animal studies were carried out according to the guidelines established by the Institutional Animal Care and Use Committee of Weill Cornell Medical College.
Animals.
C57BL/6 control mice were obtained from Jackson Laboratories. The MAL-deficient mice were generated by replacing the first exon of the mal gene with the lacZ gene sequence by standard embryonic stem cell technology (38). MAL-deficient mice were backcrossed with C57BL/6 mice for more than 6 generations. Littermates of heterozygous breeding were routinely used, but occasionally homozygous breeding of MAL-deficient and wild-type littermates was used. MAL-deficient mice bred normally and had a normal life span.
Mixed primary glial culture.
Mixed primary glial culture was obtained as previously described with modifications (57, 58). Briefly, neonatal mouse cerebral cortexes were removed from pups on postnatal day 0 (P0) to postnatal day 4 (P4). Meninges-free cortexes were dissociated by dicing and enzymatic treatment with DNase I and trypsin with subsequent trituration. Strained cells were seeded in poly-d-lysine-coated culture dishes and coverslips. To promote oligodendrocyte differentiation in mixed culture, cells were grown in oligodendrocyte (OL) medium (advanced Dulbecco modified Eagle medium [DMEM] supplemented with GlutaMAX, 5 µg/ml bovine insulin, 5 mg/ml apotransferrin, B27 supplement, 0.5% fetal bovine serum [FBS], 50 ng/ml ciliary neurotrophic factor [CNTF], 0.1 mg/ml bovine serum albumin [BSA], 60 ng/ml progesterone, 16.1 µg/ml putrescine, 5 ng/ml sodium selenite, 0.4 µg/ml 3,3′,5-trioodo-l-thyronine) with 20% horse serum for 7 to 10 days at 37°C in a humidified incubator. To promote OPC proliferation, cells were grown in OPC medium (advanced DMEM supplemented with GlutaMAX, 50 U/ml penicillin, 50 µg/ml streptomycin, 10 ng/ml platelet-derived growth factor with two A chains [PDGF-AA], and 10 ng/ml basic fibroblast growth factor [bFGF]) with 20% FBS for 7 to 10 days at 37°C in a humidified incubator.
Enriched glial culture.
Enriched oligodendrocyte, astrocyte, and microglia cultures were obtained as previously described with modifications (57). Briefly, mixed primary glial cultures grown on poly-d-lysine-coated T-75 flasks in DMEM20S medium (advanced DMEM supplemented with GlutaMAX, 50 U/ml penicillin, 50 µg/ml streptomycin, and 20% FBS) for 7 to 10 days. To enrich for microglia, T-75 flasks were shaken on an orbital shaker at 200 rpm at 37°C for 2 h. Medium was transferred to 24-well ultralow attachment plates (Costar), and microglia were allowed to adhere for 10 min at 37°C. Supernatant was removed and replaced with fresh DMEM20S. Cultures were maintained at 37°C in a humidified chamber until treatment. To enrich for astrocytes and OPCs, fresh DMEM20S was added to the T-75 flasks before shaking and shaken again on the orbital shaker at 175 rpm at 37°C overnight. Culture medium was transferred to petri dishes for 30 to 45 min to allow contaminating microglia to adhere to the surface. Culture medium was removed from petri dishes and used for enrichment. Astrocytes were enriched using the magnetically activated cell sorting (MACS) anti-GLAST microbead kit (Miltenyi Biotec) per the manufacturer’s instructions. Isolated astrocytes were plated in DMEM20S on poly-d-lysine-coated 96-well tissue culture plates. Astrocytes were maintained at 37°C in a humidified incubator until treatment. Depletion of the GLAST+ cells resulted in a cell suspension enriched for OPCs. The depleted cell suspension was centrifuged at 150 × g at 4°C for 10 min, and OPCs were resuspended in ice-cold phosphate-buffered saline (PBS) plus 0.5% BSA. Ninety-six-well plates were prepared by incubating the wells overnight in 0.01% solution of poly-l-ornithine solution at room temperature followed by three washes in H2O. The wells were then incubated in a 10-mg/ml laminin solution in PBS at 37°C for 1 to 2 h. The wells were washed twice with PBS and immediately seeded with enriched OPCs in OL medium without horse serum for 10 to 14 days at 37°C in a humidified incubator.
Organotypic culture.
The organotypic cerebellar slice culture method was based on a published protocol (59). Briefly, parasagittal slices of postnatal day 7 mouse cerebellum were cut at 350 µm using a tissue slicer (SD Instruments). The slices were placed on Millicell cell culture inserts (Millipore) in medium. Cerebellar slices were cultured in 50% basal medium with Earle’s salts, 25% Hanks’ buffered salt solution, 25% horse serum, and 5 mg/ml glucose for 4 weeks at 37°C. For treatment experiments indicated in the manuscript, active ε-toxin was added in culture medium.
Alexa Fluor 594 labeling of ε-protoxin (proETX-594).
ε-Protoxin (BEI) was labeled with Alexa Fluor 598 (Invitrogen) per the manufacturer’s instructions. The final labeled product was stored at − 20°C in 50% glycerol to protect from freeze-thaw cycles.
Live staining of oligodendrocytes and microglia.
For live staining of oligodendrocytes, live cells were probed with supernatants containing anti-O1 (clone 59) or anti-A2B5 (clone 105) for 30 min at 37°C in culture media. Cells were gently washed twice with PBS and probed with Alexa Fluor 488-conjugated goat polyclonal antibody to mouse IgM (Abcam Ab98676) for 30 min at 37°C and then washed twice with PBS. For live staining of microglia cells, cells were probed with fluorescein isothiocyanate (FITC)-conjugated BSL1 (vector FL-1101) for 30 min at 37°C and washed twice with PBS. All cells were treated in appropriate culture medium with the indicated doses of active ε-toxin (BEI) for the indicated time points. To evaluate cell viability, cells were stained with 4 µg/ml propidium iodine (Sigma) for 5 min, and pictures were taken with an AxioCam MRm camera (Zeiss) mounted on an Eclipse TS100 (Nikon) microscope using AxioVision software (Zeiss). Images were obtained from at least three separate fields for at least three separate replicates (wells). To calculate the percentage of PI-positive O1+ cells, the total number of PI-positive O1+ cells of each replicate (well) was divided by the total number of O1+ or A2B5+ cells of each replicate (well) using the counting tool in Photoshop (Adobe). The same process was used for A2B5+ cells.
ICC.
A list of antibodies used for immunocytochemistry (ICC) is given below in “Antibodies used for ICC, IHC, and WM immunostaining.”. Cells grown on both tissue culture dishes and glass coverslips were fixed for 10 min in 4% paraformaldehyde (PFA) at room temperature and then washed 3 times with PBS. The cells were blocked in PBS buffer containing 10% FBS and 0.5% BSA, with or without 0.1% Triton X-100. Triton X-100-containing buffer was used when staining for GFAP, MAG, MPB, NeuN, and PLP staining, and the cells were then permeabilized. Buffer without Triton X-100 was used when staining for A2B5, CD68, and O1. The cells were washed three times with PBS and probed with primary antibodies in PBS buffer containing 5% FBS and 0.5% BSA with or without 0.1% Triton X-100 for 1 h at room temperature or overnight at 4°C. The cells were washed three times with PBS and incubated in the same buffer with the appropriate FITC- and/or Cy3-conjugated secondary antibodies for 1 h at room temperature. When determining what cell types ε-toxin bound to, secondary antibody dilutions contained 100 nM proETX-594. For cells grown in tissue culture dishes, the cells were washed three times with PBS and visualized on an Eclipse TS100 (Nikon) microscope, and images were digitally acquired using an AxioCam MRm camera (Zeiss) with AxioVision software mounted on the microscope. For cells grown on coverslips, the cells were washed three times with PBS and mounted in Vectashield mounting medium with DAPI (Vector Laboratories). Immunostained sections were visualized by using an Axioskop2 fluorescence microscope (Carl Zeiss), and images were digitally acquired with a Spot cooled charge-coupled-device (CCD) camera (Diagnostic Instruments) mounted on the microscope.
IHC.
A list of antibodies used for immunohistochemistry (IHC) is given below in “Antibodies used for ICC, IHC, and WM immunostaining.” Brain tissue from euthanized mice was embedded in optimal-cutting temperature compound (OTC) and frozen on dry ice. Fresh frozen tissue was sectioned into 14-µm sections using a Cryostat Leica CM3050 S instrument. Sectioned tissue was fixed for 10 min in 4% PFA and washed three times with PBS. For MBP and NG2 staining, tissue was permeabilized with 0.1% Triton X-100 for 2 min and washed three times with PBS. Triton X-100 was omitted for O1 staining. Tissue was blocked in 10% FBS in PBS for 30 min at room temperature. Primary antibodies were diluted in the same buffer for 1 h at room temperature followed by three washes in PBS. Tissue was probed with the appropriate FITC-conjugated secondary antibodies diluted in the same buffer containing 50 nM of proETX-594 for 2 h at room temperature, washed three times with PBS, and mounted in Vectashield mounting medium with DAPI (Vector Laboratories). For detection of MAL, a rabbit antiserum against the rat MAL amino acids 114 to 126 was used as previously described (60). Immunostained sections were visualized using an Axiskop2 fluorescence microscope (Carl Zeiss), and images were digitally acquired with a Spot cooled CCD camera (Diagnostic Instruments) mounted on the microscope.
WM immunostaining.
A list of antibodies used for whole-mount (WM) immunostaining is given below in “Antibodies used for ICC, IHC, and WM immunostaining.” For analysis, slices were fixed with 4% paraformaldehyde and washed with PBS buffer, and whole-mount immunostaining was carried out. After fixation, cerebellar slices were removed gently from the inserts. The slices were permeabilized with 0.5% Triton X-100, followed by blocking in PBS buffer containing 7% normal serum. The slices were then incubated with primary antibody diluted in PBS buffer containing 0.2% Triton X-100. Each of these steps was done overnight at 4°C. Following three washes, the slices were incubated with the appropriate FITC- and/or Cy3-conjugated secondary antibody in the same dilution buffer for 4 h at 37°C. Finally, sections were mounted in Vectashield mounting medium with DAPI (Vector Laboratories). Immunostained sections were visualized under an Axiskop2 fluorescence microscope (Carl Zeiss), and images were digitally acquired with a Spot-cooled CCD camera (Diagnostic Instruments) mounted on the microscope.
Antibodies used for ICC, IHC, and WM immunostaining.
The following antibodies were used for ICC, IHC, and WM immunostaining: anti-A2B5 monoclonal antibody (MAB312R; Chemicon) (used for ICC), anti-CD68 monoclonal antibody (ab955; Abcam) (used for WM), anti-CD68 polyclonal antibody (ab125212; Abcam) (used for ICC), anti-CNPase monoclonal antibody (catalog no. C5922; Sigma-Aldrich) (used for WM), anti-GFAP polyclonal antibody (catalog no. 18-0063; Life Technologies) (used for WM), anti-GFAP polyclonal antibody (catalog no. 180063; Invitrogen) (used for ICC), anti-MAG monoclonal antibody (MAB1567; Millipore) (used for ICC), anti-MBP monoclonal antibody (sc-271524; Santa Cruz Biotechnology) (used for WM, ICC, and IHC), anti-NeuN antibody (MAB377; Millipore) (used for WM and ICC), anti-NG2 monoclonal antibody (ab5009;Abcam) (used for IHC), anti-O1 antibody (hybridoma clone 59; used for IHC), and anti-PLP polyclonal antibody (PA3151; used for ICC). A rabbit antiserum against the rat MAL amino acids 114 to 126 was generated and purified as previously described for IHC (60).
Measurement of immunofluorescence intensities and cell counts.
Single-channel/monochromatic images taken with a Spot cooled camera (Diagnostic Instruments) mounted on an Axiskop2 fluorescence microscope (Carl Zeiss) are directly imported in ImageJ64 (NIH) and converted into an 8-bit gray format. Adjust the threshold to the image as a whole (or regions of interest) to pick up signals to be measured. For comparative analysis, the same threshold values are applied to all images taken from all experimental groups. Apply the threshold adjustment to convert the image into a binary image. For fluorescence intensity analysis, measurement is automatically performed on the binary image for mean and integrated density. For cell counts, the Analyze Particles function is selected to automatically count the number of particles (soma or nuclei) and analyze particle properties (size and shape) and distribution. The measurement data were exported directly for statistical analysis.
Anti-ε-toxin neutralizing antibody.
Mixed primary glial culture and organotypic culture were generated as described above. ε-Toxin was introduced to cultures at the indicated doses, and the anti-ε-toxin neutralizing antibody was immediately added at the indicated dilutions. The neutralizing monoclonal antibody (5B7) was kindly provided by the Center for Veterinary Biologics Laboratory, USDA-APHIS-VS (40). Measurements of immunofluorescence intensities and PI-positive cells were determined as described above.
Statistical analysis.
Significance of difference in quantitative analyses was assessed by two-tailed Student’s t test using Excel (Microsoft) or analysis of variance (ANOVA) using SigmaPlot 11.0 software where indicated. Results are expressed as described in the figure legends.
SUPPLEMENTAL MATERIAL
ε-Toxin kills enriched oligodendrocytes. (A) To evaluate the purity of enriched oligodendrocytes, fixed cells were stained with the astrocyte marker GFAP, microglia marker CD68, and OPC marker NG2. (B) MBP+ oligodendrocytes were probed with proETX-594 to determine ε-toxin binding. (C) Typical micrograph of enriched oligodendrocyte culture live stained with O1 antibody. Top image is of untreated control cells. Bottom image is of cells treated with 100 nm ε-toxin. Cell viability was evaluated by PI exclusion. Arrows point to PI-positive O1+ cells. (D) Quantification of viability of oligodendrocytes compared to that of untreated controls. Viability was calculated by dividing the total percentage of viable oligodendrocytes after 50 nM ε-toxin treatment by the percentage of viable oligodendrocytes after control treatment at indicated time points. Values are means ± standard deviations (SD) (n = 3). Values that are significantly different (P < 0.05) by ANOVA are indicated by an asterisk. Similar results were obtained at least two independent experiments. Download
ε-Toxin does not kill enriched astrocytes. Astrocytes were enriched from mixed primary glial cultures. (A) The purity of the cultures was determined by staining fixed cells with astrocyte marker GFAP, microglia marker CD68, and oligodendrocyte marker MBP. (B) Enriched astrocytes were treated with the indicated doses of ε-toxin (ETX) for 24 h. Cell viability was evaluated by PI exclusion. Representative images from two independent experiments are shown. Bars. ca. 20 µm. Download
ε-Toxin does not kill enriched microglia cells. Microglia cells were enriched from mixed primary glia cultures. (A) The purity of the cultures was determined by staining fixed cells with antibodies against astrocyte marker GFAP, microglia marker CD68, OPC marker NG2, and oligodendrocyte marker MBP. Bar, ca. 20 µm. (B) Live microglia cells were stained with the fluorescently labeled lectin BSL1 and treated with the indicated ε-toxin (ETX) doses for 24 h. Cell death was evaluated by PI exclusion. Bar, ca. 10 µm. (C) Quantification of percent microglial cell death. Percent cell death was calculated by dividing the number of BSL1+ cells that were PI positive by the total number of BSL1+ cells. Values are means ± SD (n = 3). Values that are not significantly different by ANOVA are indicated (ns). Similar results were obtained in two independent experiments. Download
Developmental profile of O1 expression and ε-toxin binding. Brain tissue from P8, P14, P17, P22, and 5-week-old (5WK) mice were evaluated for O1 expression by immunostaining. Stained tissue was probed with Alexa Fluor 598-tagged ε protoxin (proETX-594) to evaluate binding. Download
ACKNOWLEDGMENTS
This work was generously supported in part by NMSS award RG5185A5/1, the Mortimer D. Sackler Family Fund for Neuroregenerative Research, the Laurence Tisch Family Research Fund, the MS Hope Foundation, and the Widgeon Point Charitable Foundation. The work of N.S.-W. was supported by the Swiss National Science Foundation (grants 3100A0-112583 and 31003A_141185).
Footnotes
Citation Linden JR, Ma Y, Zhao B, Harris JM, Rumah KR, Schaeren-Wiemers N, Vartanian T. 2015. Clostridium perfringens epsilon toxin causes selective death of mature oligodendrocytes and central nervous system demyelination. mBio 6(3):e02513-14. doi:10.1128/mBio.02513-14.
Contributor Information
Joseph T. Barbieri, Medical College of Wisconsin.
R. John Collier, Harvard Medical School.
REFERENCES
- 1.Cho I, Blaser MJ. 2012. The human microbiome: at the interface of health and disease. Nat Rev Genet 13:260–270. doi: 10.1038/nrg3182. [DOI] [PMC free article] [PubMed] [Google Scholar]
- 2.Eloe-Fadrosh EA, Rasko DA. 2013. The human microbiome: from symbiosis to pathogenesis. Annu Rev Med 64:145–163. doi: 10.1146/annurev-med-010312-133513. [DOI] [PMC free article] [PubMed] [Google Scholar]
- 3.Stiles BG, Barth G, Barth H, Popoff MR. 2013. Clostridium perfringens epsilon toxin: a malevolent molecule for animals and man? Toxins (Basel) 5:2138–2160. doi: 10.3390/toxins5112138. [DOI] [PMC free article] [PubMed] [Google Scholar]
- 4.Finnie JW. 1984. Histopathological changes in the brain of mice given Clostridium perfringens type D epsilon toxin. J Comp Pathol 94:363–370. doi: 10.1016/0021-9975(84)90024-0 [DOI] [PubMed] [Google Scholar]
- 5.Finnie JW. 2004. Neurological disorders produced by Clostridium perfringens type D epsilon toxin. Anaerobe 10:145–150. doi: 10.1016/j.anaerobe.2003.08.003. [DOI] [PubMed] [Google Scholar]
- 6.Garcia JP, Adams V, Beingesser J, Hughes ML, Poon R, Lyras D, Hill A, McClane BA, Rood JI, Uzal FA. 2013. Epsilon toxin is essential for the virulence of Clostridium perfringens type D infection in sheep, goats, and mice. Infect Immun 81:2405–2414. doi: 10.1128/IAI.00238-13 [DOI] [PMC free article] [PubMed] [Google Scholar]
- 7.Garcia JP, Giannitti F, Finnie JW, Manavis J, Beingesser J, Adams V, Rood JI, Uzal FA. 2014. Comparative neuropathology of ovine enterotoxemia produced by Clostridium perfringens type D wild-type strain CN1020 and its genetically modified derivatives. Vet Pathol 52:465–4750300985814540543. [DOI] [PubMed] [Google Scholar]
- 8.Gardner DE. 1973. Pathology of Clostridium welchii type D enterotoxaemia. II. Structural and ultrastructural alterations in the tissues of lambs and mice. J Comp Pathol 83:509–524. doi: 10.1016/0021-9975(73)90009-1. [DOI] [PubMed] [Google Scholar]
- 9.Popoff MR. 2011. Epsilon toxin: a fascinating pore-forming toxin. FEBS J 278:4602–4615. doi: 10.1111/j.1742-4658.2011.08145.x [DOI] [PubMed] [Google Scholar]
- 10.Smedley JG III, Fisher DJ, Sayeed S, Chakrabarti G, McClane BA. 2004. The enteric toxins of Clostridium perfringens. Rev Physiol Biochem Pharmacol 152:183–204. doi: 10.1007/s10254-004-0036-2. [DOI] [PubMed] [Google Scholar]
- 11.Petit L, Gibert M, Popoff MR. 1999. Clostridium perfringens: toxinotype and genotype. Trends Microbiol 7:104–110. doi: 10.1016/S0966-842X(98)01430-9. [DOI] [PubMed] [Google Scholar]
- 12.Li J, Adams V, Bannam TL, Miyamoto K, Garcia JP, Uzal FA, Rood JI, McClane BA. 2013. Toxin plasmids of Clostridium perfringens. Microbiol Mol Biol Rev 77:208–233. doi: 10.1128/MMBR.00062-12 [DOI] [PMC free article] [PubMed] [Google Scholar]
- 13.Goldstein J, Morris WE, Loidl CF, Tironi-Farinati C, McClane BA, Uzal FA, Fernandez Miyakawa ME. 2009. Clostridium perfringens epsilon toxin increases the small intestinal permeability in mice and rats. PLoS One 4:e7065. doi: 10.1371/journal.pone.0007065 [DOI] [PMC free article] [PubMed] [Google Scholar]
- 14.Losada-Eaton DM, Fernandez-Miyakawa ME. 2010. Clostridium perfringens epsilon toxin inhibits the gastrointestinal transit in mice. Res Vet Sci 89:404–408. doi: 10.1016/j.rvsc.2010.04.006. [DOI] [PubMed] [Google Scholar]
- 15.Buxton D, Morgan KT. 1976. Studies of lesions produced in the brains of colostrum deprived lambs by Clostridium welchii (Cl. perfringens) type D toxin. J Comp Pathol 86:435-447. doi: 10.1016/0021-9975(76)90012-8. [DOI] [PubMed] [Google Scholar]
- 16.Morgan KT, Kelly BG, Buxton D. 1975. Vascular leakage produced in the brains of mice by Clostridium welchii type D toxin. J Comp Pathol 85:461–466. doi: 10.1016/0021-9975(75)90034-1. [DOI] [PubMed] [Google Scholar]
- 17.Mete A, Garcia J, Ortega J, Lane M, Scholes S, Uzal FA. 2013. Brain lesions associated with Clostridium perfringens type D epsilon toxin in a Holstein heifer calf. Vet Pathol 50:765–768. doi: 10.1177/0300985813476058. [DOI] [PubMed] [Google Scholar]
- 18.Finnie JW, Manavis J, Chidlow G. 2014. Loss of endothelial barrier antigen immunoreactivity as a marker of Clostridium perfringens type D epsilon toxin-induced microvascular damage in rat brain. J Comp Pathol 151:153–156. doi: 10.1016/j.jcpa.2014.04.010 [DOI] [PubMed] [Google Scholar]
- 19.Zhu C, Ghabriel MN, Blumbergs PC, Reilly PL, Manavis J, Youssef J, Hatami S, Finnie JW. 2001. Clostridium perfringens prototoxin-induced alteration of endothelial barrier antigen (EBA) immunoreactivity at the blood-brain barrier (BBB). Exp Neurol 169:72–82. doi: 10.1006/exnr.2001.7652. [DOI] [PubMed] [Google Scholar]
- 20.Ghabriel MN, Zhu C, Reilly PL, Blumbergs PC, Manavis J, Finnie JW. 2000. Toxin-induced vasogenic cerebral oedema in a rat model. Acta Neurochir Suppl 76:231–236. [DOI] [PubMed] [Google Scholar]
- 21.Morgan KT, Kelly BG. 1974. Ultrastructural study of brain lesions produced in mice by the administration of Clostridium welchii type D toxin. J Comp Pathol 84:181–191. doi: 10.1016/0021-9975(74)90059-0. [DOI] [PubMed] [Google Scholar]
- 22.Worthington RW, Mülders MS. 1975. Effect of Clostridium perfringens epsilon toxin on the blood brain barrier of mice. Onderstepoort J Vet Res 42:25–27. [PubMed] [Google Scholar]
- 23.Finnie JW. 1984. Ultrastructural changes in the brain of mice given Clostridium perfringens type D epsilon toxin. J Comp Pathol 94:445–452. doi: 10.1016/0021-9975(84)90031-8. [DOI] [PubMed] [Google Scholar]
- 24.Uzal FA, Kelly WR, Morris WE, Bermudez J, Baisón M. 2004. The pathology of peracute experimental Clostridium perfringens type D enterotoxemia in sheep. J Vet Diagn Invest 16:403–411. doi: 10.1177/104063870401600506. [DOI] [PubMed] [Google Scholar]
- 25.Soler-Jover A, Dorca J, Popoff MR, Gibert M, Saura J, Tusell JM, Serratosa J, Blasi J, Martín-Satué M. 2007. Distribution of Clostridium perfringens epsilon toxin in the brains of acutely intoxicated mice and its effect upon glial cells. Toxicon 50:530–540. doi: 10.1016/j.toxicon.2007.04.025. [DOI] [PubMed] [Google Scholar]
- 26.Dorca-Arévalo J, Soler-Jover A, Gibert M, Popoff MR, Martín-Satué M, Blasi J. 2008. Binding of epsilon-toxin from Clostridium perfringens in the nervous system. Vet Microbiol 131:14–25. doi: 10.1016/j.vetmic.2008.02.015. [DOI] [PubMed] [Google Scholar]
- 27.Murrell TG, O’Donoghue PJ, Ellis T. 1986. A review of the sheep-multiple sclerosis connection. Med Hypotheses 19:27–39. doi: 10.1016/0306-9877(86)90134-9. [DOI] [PubMed] [Google Scholar]
- 28.Rumah KR, Linden J, Fischetti VA, Vartanian T. 2013. Isolation of Clostridium perfringens Type B in an individual at first clinical presentation of multiple sclerosis provides clues for environmental triggers of the disease. PLoS One 8:e76359. doi: 10.1371/journal.pone.0076359. [DOI] [PMC free article] [PubMed] [Google Scholar]
- 29.Finnie JW. 1993. An unusual form of granular layer necrosis in the cerebellum. Pathology 25:99. doi: 10.3109/00313029309068912. [DOI] [PubMed] [Google Scholar]
- 30.Finnie JW, Blumbergs PC, Manavis J. 1999. Neuronal damage produced in rat brains by Clostridium perfringens type D epsilon toxin. J Comp Pathol 120:415–420. doi: 10.1053/jcpa.1998.0289. [DOI] [PubMed] [Google Scholar]
- 31.Lonchamp E, Dupont JL, Wioland L, Courjaret R, Mbebi-Liegeois C, Jover E, Doussau F, Popoff MR, Bossu JL, de Barry J, Poulain B. 2010. Clostridium perfringens epsilon toxin targets granule cells in the mouse cerebellum and stimulates glutamate release. PLoS One 5:e13046. doi: 10.1371/journal.pone.0013046. [DOI] [PMC free article] [PubMed] [Google Scholar]
- 32.Miyamoto O, Minami J, Toyoshima T, Nakamura T, Masada T, Nagao S, Negi T, Itano T, Okabe A. 1998. Neurotoxicity of Clostridium perfringens epsilon-toxin for the rat hippocampus via the glutamatergic system. Infect Immun 66:2501–2508. [DOI] [PMC free article] [PubMed] [Google Scholar]
- 33.Di Penta A, Moreno B, Reix S, Fernandez-Diez B, Villanueva M, Errea O, Escala N, Vandenbroeck K, Comella JX, Villoslada P. 2013. Oxidative stress and proinflammatory cytokines contribute to demyelination and axonal damage in a cerebellar culture model of neuroinflammation. PLoS One 8:e54722. doi: 10.1371/journal.pone.0054722 [DOI] [PMC free article] [PubMed] [Google Scholar]
- 34.Birgbauer E, Rao TS, Webb M. 2004. Lysolecithin induces demyelination in vitro in a cerebellar slice culture system. J Neurosci Res 78:157–166. doi: 10.1002/jnr.20248. [DOI] [PubMed] [Google Scholar]
- 35.Ivie SE, Fennessey CM, Sheng J, Rubin DH, McClain MS. 2011. Gene-trap mutagenesis identifies mammalian genes contributing to intoxication by Clostridium perfringens epsilon-toxin. PLoS One 6:e17787. doi: 10.1371/journal.pone.0017787. [DOI] [PMC free article] [PubMed] [Google Scholar]
- 36.Fennessey CM, Sheng J, Rubin DH, McClain MS. 2012. Oligomerization of Clostridium perfringens epsilon toxin is dependent upon caveolins 1 and 2. PLoS One 7:e46866. doi: 10.1371/journal.pone.0046866. [DOI] [PMC free article] [PubMed] [Google Scholar]
- 37.Rumah KR, Ma Y, Linden JR, Oo ML, Anrather J, Schaeren-Wiemers N, Alonso MA, Fischetti VA, McClain MS, Vartanian T. 2015. The myelin and lymphocyte protein MAL is required for binding and activity of Clostridium perfringens epsilon-toxin. PLoS Pathog 11:e1004896. doi: 10.1371/journal.ppat.1004896. [DOI] [PMC free article] [PubMed] [Google Scholar]
- 38.Schaeren-Wiemers N, Bonnet A, Erb M, Erne B, Bartsch U, Kern F, Mantei N, Sherman D, Suter U. 2004. The raft-associated protein MAL is required for maintenance of proper axon−glia interactions in the central nervous system. J Cell Biol 166:731–742. doi: 10.1083/jcb.200406092. [DOI] [PMC free article] [PubMed] [Google Scholar]
- 39.Fernandez-Miyakawa ME, Sayeed S, Fisher DJ, Poon R, Adams V, Rood JI, McClane BA, Saputo J, Uzal FA. 2007. Development and application of an oral challenge mouse model for studying Clostridium perfringens type D infection. Infect Immun 75:4282–4288. doi: 10.1128/IAI.00562-07. [DOI] [PMC free article] [PubMed] [Google Scholar]
- 40.Hauer PJ, Clough NE. 1999. Development of monoclonal antibodies suitable for use in antigen quantification potency tests for clostridial veterinary vaccines. Dev Biol Stand 101:85–94. [PubMed] [Google Scholar]
- 41.Songer JG. 1996. Clostridial enteric diseases of domestic animals. Clin Microbiol Rev 9:216–234. [DOI] [PMC free article] [PubMed] [Google Scholar]
- 42.Losada-Eaton DM, Uzal FA, Fernández Miyakawa ME. 2008. Clostridium perfringens epsilon toxin is absorbed from different intestinal segments of mice. Toxicon 51:1207–1213. doi: 10.1016/j.toxicon.2008.02.008. [DOI] [PubMed] [Google Scholar]
- 43.Prineas JW, Kwon EE, Goldenberg PZ, Ilyas AA, Quarles RH, Benjamins JA, Sprinkle TJ. 1989. Multiple sclerosis. Oligodendrocyte proliferation and differentiation in fresh lesions. Lab Invest 61:489–503. [PubMed] [Google Scholar]
- 44.Prineas JW, Parratt JD. 2012. Oligodendrocytes and the early multiple sclerosis lesion. Ann Neurol 72:18–31. doi: 10.1002/ana.23634. [DOI] [PubMed] [Google Scholar]
- 45.Sofroniew MV, Vinters HV. 2010. Astrocytes: biology and pathology. Acta Neuropathol 119:7–35. doi: 10.1007/s00401-009-0619-8. [DOI] [PMC free article] [PubMed] [Google Scholar]
- 46.Kim S, Steelman AJ, Zhang Y, Kinney HC, Li J. 2012. Aberrant upregulation of astroglial ceramide potentiates oligodendrocyte injury. Brain Pathol 22:41–57. doi: 10.1111/j.1750-3639.2011.00501.x. [DOI] [PMC free article] [PubMed] [Google Scholar]
- 47.Chang A, Nishiyama A, Peterson J, Prineas J, Trapp BD. 2000. NG2-positive oligodendrocyte progenitor cells in adult human brain and multiple sclerosis lesions. J Neurosci 20:6404–6412. [DOI] [PMC free article] [PubMed] [Google Scholar]
- 48.Rodriguez EG, Wegner C, Kreutzfeldt M, Neid K, Thal DR, Jürgens T, Brück W, Stadelmann C, Merkler D. 2014. Oligodendroglia in cortical multiple sclerosis lesions decrease with disease progression, but regenerate after repeated experimental demyelination. Acta Neuropathol 128:231–246. doi: 10.1007/s00401-014-1260-8. [DOI] [PMC free article] [PubMed] [Google Scholar]
- 49.Goldschmidt T, Antel J, König FB, Brück W, Kuhlmann T. 2009. Remyelination capacity of the MS brain decreases with disease chronicity. Neurology 72:1914–1921. doi: 10.1212/WNL.0b013e3181a8260a. [DOI] [PubMed] [Google Scholar]
- 50.Prineas JW, Barnard RO, Kwon EE, Sharer LR, Cho ES. 1993. Multiple sclerosis: remyelination of nascent lesions. Ann Neurol 33:137–151. doi: 10.1002/ana.410330203. [DOI] [PubMed] [Google Scholar]
- 51.Frank M, Schaeren-Wiemers N, Schneider R, Schwab ME. 1999. Developmental expression pattern of the myelin proteolipid MAL indicates different functions of MAL for immature Schwann cells and in a late step of CNS myelinogenesis. J Neurochem 73:587–597. [DOI] [PubMed] [Google Scholar]
- 52.Schaeren-Wiemers N, Valenzuela DM, Frank M, Schwab ME. 1995. Characterization of a rat gene, rMAL, encoding a protein with four hydrophobic domains in central and peripheral myelin. J Neurosci 15:5753–5764. [DOI] [PMC free article] [PubMed] [Google Scholar]
- 53.Alonso MA, Weissman SM. 1987. cDNA cloning and sequence of MAL, a hydrophobic protein associated with human T-cell differentiation. Proc Natl Acad Sci U S A 84:1997–2001. doi: 10.1073/pnas.84.7.1997. [DOI] [PMC free article] [PubMed] [Google Scholar]
- 54.Ramnarayanan SP, Tuma PL. 2011. MAL, but not MAL2, expression promotes the formation of cholesterol-dependent membrane domains that recruit apical proteins. Biochem J 439:497–504. doi: 10.1042/BJ20110803. [DOI] [PMC free article] [PubMed] [Google Scholar]
- 55.Zhang SC. 2001. Defining glial cells during CNS development. Nat Rev Neurosci 2:840–843. doi: 10.1038/35097593. [DOI] [PubMed] [Google Scholar]
- 56.Wioland L, Dupont JL, Doussau F, Gaillard S, Heid F, Isope P, Pauillac S, Popoff MR, Bossu JL, Poulain B. 2015. Epsilon toxin from Clostridium perfringens acts on oligodendrocytes without forming pores, and causes demyelination. Cell Microbiol 17:369–388. doi: 10.1111/cmi.12373. [DOI] [PubMed] [Google Scholar]
- 57.Chen Y, Balasubramaniyan V, Peng J, Hurlock EC, Tallquist M, Li J, Lu QR. 2007. Isolation and culture of rat and mouse oligodendrocyte precursor cells. Nat Protoc 2:1044–1051. doi: 10.1038/nprot.2007.149. [DOI] [PubMed] [Google Scholar]
- 58.O’Meara RW, Ryan SD, Colognato H, Kothary R. 2011. Derivation of enriched oligodendrocyte cultures and oligodendrocyte/neuron myelinating co-cultures from post-natal murine tissues. J Vis Exp 54:pii:3324. doi: 10.3791/3324. [DOI] [PMC free article] [PubMed] [Google Scholar]
- 59.Stoppini L, Buchs PA, Muller D. 1991. A simple method for organotypic cultures of nervous tissue. J Neurosci Methods 37:173–182. doi: 10.1016/0165-0270(91)90128-M. [DOI] [PubMed] [Google Scholar]
- 60.Frank M, van der Haar ME, Schaeren-Wiemers N, Schwab ME. 1998. rMAL is a glycosphingolipid-associated protein of myelin and apical membranes of epithelial cells in kidney and stomach. J Neurosci 18:4901–4913. [DOI] [PMC free article] [PubMed] [Google Scholar]
Associated Data
This section collects any data citations, data availability statements, or supplementary materials included in this article.
Supplementary Materials
ε-Toxin kills enriched oligodendrocytes. (A) To evaluate the purity of enriched oligodendrocytes, fixed cells were stained with the astrocyte marker GFAP, microglia marker CD68, and OPC marker NG2. (B) MBP+ oligodendrocytes were probed with proETX-594 to determine ε-toxin binding. (C) Typical micrograph of enriched oligodendrocyte culture live stained with O1 antibody. Top image is of untreated control cells. Bottom image is of cells treated with 100 nm ε-toxin. Cell viability was evaluated by PI exclusion. Arrows point to PI-positive O1+ cells. (D) Quantification of viability of oligodendrocytes compared to that of untreated controls. Viability was calculated by dividing the total percentage of viable oligodendrocytes after 50 nM ε-toxin treatment by the percentage of viable oligodendrocytes after control treatment at indicated time points. Values are means ± standard deviations (SD) (n = 3). Values that are significantly different (P < 0.05) by ANOVA are indicated by an asterisk. Similar results were obtained at least two independent experiments. Download
ε-Toxin does not kill enriched astrocytes. Astrocytes were enriched from mixed primary glial cultures. (A) The purity of the cultures was determined by staining fixed cells with astrocyte marker GFAP, microglia marker CD68, and oligodendrocyte marker MBP. (B) Enriched astrocytes were treated with the indicated doses of ε-toxin (ETX) for 24 h. Cell viability was evaluated by PI exclusion. Representative images from two independent experiments are shown. Bars. ca. 20 µm. Download
ε-Toxin does not kill enriched microglia cells. Microglia cells were enriched from mixed primary glia cultures. (A) The purity of the cultures was determined by staining fixed cells with antibodies against astrocyte marker GFAP, microglia marker CD68, OPC marker NG2, and oligodendrocyte marker MBP. Bar, ca. 20 µm. (B) Live microglia cells were stained with the fluorescently labeled lectin BSL1 and treated with the indicated ε-toxin (ETX) doses for 24 h. Cell death was evaluated by PI exclusion. Bar, ca. 10 µm. (C) Quantification of percent microglial cell death. Percent cell death was calculated by dividing the number of BSL1+ cells that were PI positive by the total number of BSL1+ cells. Values are means ± SD (n = 3). Values that are not significantly different by ANOVA are indicated (ns). Similar results were obtained in two independent experiments. Download
Developmental profile of O1 expression and ε-toxin binding. Brain tissue from P8, P14, P17, P22, and 5-week-old (5WK) mice were evaluated for O1 expression by immunostaining. Stained tissue was probed with Alexa Fluor 598-tagged ε protoxin (proETX-594) to evaluate binding. Download