
FIG 5 .
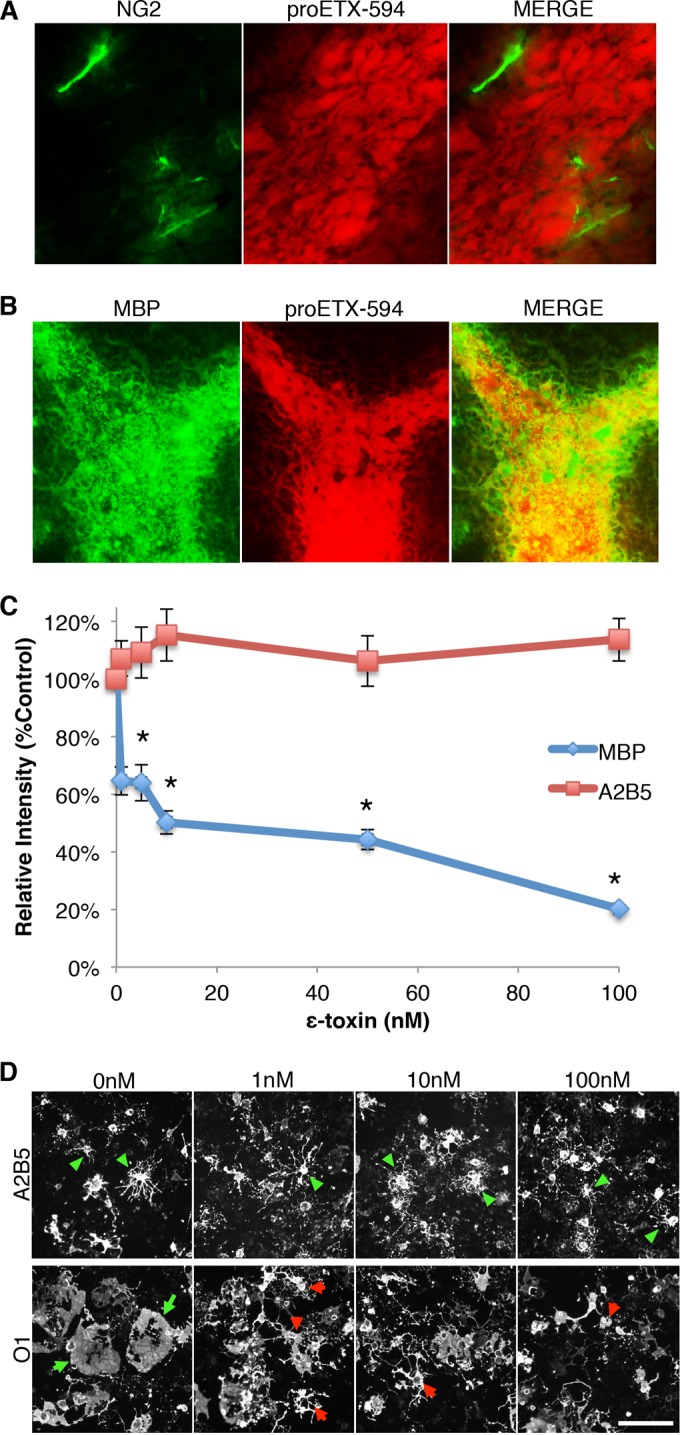
ε-Toxin binding and toxicity depend on oligodendrocyte maturation. (A and B) To determine whether ε-toxin binds to OPCs or mature oligodendrocytes, brain slices from P17 pups were immunostained for NG2 (A) or MBP (B), respectively, and probed with Alexa Fluor 594-labeled ε-protoxin (proETX-594). (C) Quantification of staining intensity for A2B5 or MBP after ε-toxin treatment. Primary mixed glial cultures were grown in media to promote OPC proliferation or oligodendrocyte differentiation. To determine ε-toxin toxicity on immature and mature oligodendrocytes, cultures were treated with the indicated doses of ε-toxin for 24 h. OPC cultures were stained for A2B5, and oligodendrocyte differentiation cultures were stained for MBP. Relative intensity was normalized to untreated controls (100%). Values are means ± SEM (n = 6 to 8). Values that are significantly different (P ≤ 0.05) from the value for A2B5 by Mann-Whitney rank sum test are indicated (*). (D) Primary mixed glial cultures were grown in media to promote OPC proliferation or oligodendrocyte differentiation. To determine the effect of ε-toxin on cell morphology, cultures were treated with the indicated doses of ε-toxin for 24 h. OPC cultures were stained for A2B5 (top row) and oligodendrocyte differentiation cultures were stained for O1 (bottom row). Green arrowheads point to A2B5 cells with healthy processes. Green arrows point to healthy O1+ cells with full, extended membranes. Red arrowheads point to O1+ cells with retracted membranes and processes. Similar results were obtained in two independent experiments. Bar, ca. 100 µm.