Abstract
The energy homeostasis-associated (Enho) gene encodes a secreted protein, adropin, which regulates the expression of hepatic lipogenic genes and adipose tissue peroxisome proliferator-activated receptor γ, a major regulator of lipogenesis. In the present study, the porcine (Sus scrofa) homologue of the Enho gene, which was named pEnho, was amplified by reverse transcriptase polymerase chain reaction (RT-PCR) using oligonucleotide primers derived from in silico sequences. The gene sequence was submitted into the GenBank of NCBI, and the access number is GQ414763. The pEnho encodes a protein of 76 amino acids which shows 75% similarity to Homo sapiens adropin. The expression profile of pEnho in tissues (liver, muscle, anterior jejunum, posterior jejunum, and ileum) was determined by quantitative real-time RT-PCR. pEnho was localized on porcine chromosome 10 and no introns were found. In conclusion, pEnho was cloned and analysed with the aim of increasing knowledge about glucose and lipid metabolism in piglets and helping to promote the health and growth of piglets through adropin regulation.
Keywords: Adropin, Energy homeostasis-associated (Enho) gene, Gene coloning, Piglets, RT-PCR
1. Introduction
Adropin is a peptide hormone, which is encoded by the energy homeostasis-associated (Enho) gene, and is expressed differently in various tissues (Ganesh-Kumar et al., 2008; Lovren et al., 2010; Aydin et al., 2013a; 2013b; Kuloglu and Aydin, 2014). The main function of adropin is to maintain energy homeostasis and insulin response (Ganesh-Kumar et al., 2008). It has been reported that low plasma adropin levels are associated with obesity, obesity-associated insulin resistance, obesity-related non-alcoholic fatty liver disease, atherogenesis, diabetes, aging, child obstructive sleep apnea, and many other metabolic diseases, although some studies have come to inverse conclusions (Lovren et al., 2010; Lian et al., 2011; Butler et al., 2012; Celik A. et al., 2013; Celik E. et al., 2013; Gozal et al., 2013; Topuz et al., 2013; Sayın et al., 2014; Wu et al., 2014; Zhang et al., 2014). However, adropin has been confirmed as a potential, novel blood-based protein biomarker for several diseases (Lian et al., 2011; Aydin et al., 2014; Yildirim et al., 2014; Yu et al., 2014).
It is significant that adropin also influences the regulation of food intake and body weight. Adropin controls the energy store, devoid of Enho-induced increased adiposity and insulin resistance in mice (Ganesh-Kumar et al., 2008; 2012). It also controls energy expenditure by regulating physical activity and motor coordination via the NB-3/Notch signaling pathway (Wong et al., 2014). Adropin regulates muscle substrate preference under different nutritional states and promotes carbohydrate oxidation over fat oxidation (Gao et al., 2014).
Meat is the main source of protein in the human diet and pork accounts for more than one third of meat consumption (Zhang et al., 2012; Henchion et al., 2014). Thus, research into adropin and the energy balance of pigs has practical significance for the quality and quantity of pork production (Qiu et al., 2014). Though the human, mouse, and bovine Enho genes have been cloned, the sequence of the porcine Enho was still unknown. In the present study, the porcine Enho (pEnho) was cloned and its expression profile determined. The results will promote energy balance regulation by adjusting diets via pEnho (Ganesh-Kumar et al., 2008; St-Onge et al., 2014). Pigs are considered to be a suitable animal model for studying human nutrition due to their apparent similarities with humans (van der Laan et al., 2010; He et al., 2012), and the cloning of the pEnho will also benefit the study of human metabolic diseases.
2. Materials and methods
2.1. Animal raising and tissue sample collection
Twenty-four healthy piglets from six litters were purchased from Hunan Ground Biological Science and Technology Co., Ltd. (Changsha, China), and raised in the Laboratory Animal Center of the Institute of Subtropical Agriculture, Chinese Academy of Sciences (Changsha, China). All piglets were freely nursed by sows. At 1, 7, 14, and 21 d of age, all piglets were executed by jugular puncture under general anaesthesia via intravenous injection of 4% sodium pentobarbital solution (40 mg/kg body weight), and then immediately eviscerated (Yao et al., 2008). The small intestines were separated and cleaned several times with ice-cold phosphate-buffered saline. Samples of liver, muscle, anterior jejunum, posterior jejunum, and ileum were collected and immediately frozen in liquid nitrogen, and stored at −70 °C until analysis. All procedures were approved by the Animal Care Committee at the Chinese Academy of Sciences (No. ISA2010007).
2.2. RNA extraction and complementary DNA (cDNA) synthesis
Total RNA was extracted from samples using TRIzol® Reagent (Invitrogen-Life Technologies, CA, USA) following the manufacturer’s suggested protocol and dissolved in diethyl pyrocarbonate (DEPC)-treated water. The quality and concentration of extracted RNA were checked by 1.2% (0.012 g/ml) agarose gel electrophoresis and spectrophotometry using NanoDrop® ND2000 (NanoDrop Technologies Inc., DE, USA), respectively. Then, 1.0 μg of total sample RNA was incubated with DNase I (MBI Fermentas GMBH, St. Leon-Rot, Germany) and reverse-transcribed with mix primers using the Reverse Transcription System (Promega Co., WI, USA). Finally, the cDNAs were stored at −70 °C before further processing (Tan et al., 2011).
2.3. Cloning of the pEnho
Primers to recognize the pEnho cDNA sequence were designed with Primer 5.0 (Premier Biosoft International, CA, USA) based on the conserved nucleotide acid sequence of mouse and human Enho genes. The full-length cDNA of pEnho was amplified using the mixed cDNA from all tissues as a template. The primers used for cloning were 5'-CGGGCTCAACTCAGGCTCAG-3' as forward primer and 5'-CCCTCTCATTATTGCCGTGGA-3' as reverse primer. The polymerase chain reaction (PCR) mixture (25 μl total volume) contained 12.5 μl of 2× Taq PCR master mix (Tiangen, Beijing, China), 8.5 μl of ddH2O, 2 μl of mixed cDNA, and l μl (10 nmol/L) of each primer. The PCR reaction was performed using Eppendorf Mastercycler (Eppendorf, Hamburg, Germany) with the following parameters: initial denaturation at 94 °C for 5 min; 35 cycles of denaturation at 94 °C for 60 s, annealing at 55 °C for 60 s, and elongation at 72 °C for 60 s; and final elongation at 72 °C for 10 min. PCR products (4 μl) were identified by electrophoresis at 12 V/cm for 50 min on a 1% (0.01 g/ml) agarose gel. The amplification products were extracted from the gel using Promega Wizard SV Gel and the PCR Clean-up System (Promega Corporation, WI, USA). Then, the purified PCR products were cloned into the PMD™18-T Vector (TaKaRa, Dalian, China) and sequenced at Invitrogen (Guangzhou, China) (Wang et al., 2009; Geng et al., 2011).
2.4. Real-time quantitative reverse transcriptase-PCR (RT-PCR) expression analysis
The expression profile of pEnho was determined by real-time RT-PCR analysis. Primers were designed with Primer 5.0 (Premier Biosoft International, CA, USA) based on the pEnho cDNA sequence. The primers used for RT-PCR of pEnho were 5'-GCTGCTCTGGGTCATTCTCTG-3' as forward primer and 5'-CTTCATGGCTGGGCTTCTG-3' as reverse primer. GAPDH was used as a reference gene, and primers were 5'-GAAGGTCGGAGTGAACGGAT-3' as forward primer and 5'-CATGGGTAGAATCATACTGGAACA-3' as reverse primer. RT-PCR was performed on the ABI PRISM 7900HT (Life Technologies, Carlsbad, CA, USA) platform using SYBR® Premix Ex Taq™ II (TaKaRa, Dalian, China) following the suggested protocol. The results were analyzed by ABI 7900 SDS software (Version 2.3, Applied Biosystems).
2.5. Bioinformatics analysis
The BLAST program was used to identify homologous sequences in the GenBank database. Sequences were aligned with the multiple alignment program Clustal W 1.83 (http://www.clustal.org). The neighbor-joining method was used to construct a phylogenetic tree using the PHYLIP software package (http://evolution.genetics.washington.edu/phylip). Prediction of transmembrane helices in AA sequence was analyzed by TMHMM Server v. 2.0 (http://www.cbs.dtu.dk/services/TMHMM/). The most likely signal peptide cleavage site of adropin was predicted using neural network (NN) models and hidden Markov models (HMM) from the SignalP 3.0 Server (http://www.cbs.dtu.dk/services/SignalP). Potential cleavage site for mitochondrial pre-sequence was predicted using the Gavel program (Gavel and von Heijne, 1990). Motifs were predicted using the Motif Scan program (http://myhits.isb-sib.ch/cgi-bin/motif_scan). Adropin’s sub-cellular localization was predicted using program NNCN discrimination and the k-NN Prediction program (k=23) (http://psort.hgc.jp). Protein secondary structure prediction was carried out using the Garnier program (https://npsa-prabi.ibcp.fr/cgi-bin/npsa_automat.plpage=npsa_gor4.html). Helix-turn-helix, zinc finger, leucine zipper and helix-loop-helix motifs in porcine adropin were predicted using Helixturnhelix program (Helixturnhelix program).
2.6. Statistical analysis
To determine the changes in pEnho mRNA expression, multiple comparisons of mRNA abundance among anterior jejunum, posterior jejunum, ileum, liver, and dorsal muscle at Days 1, 7, 14, and 21 were carried out using the Duncan test after analysis of variance (ANOVA) using SPSS 20.0 (SPSS Inc., Chicago, IL, USA). Data are presented as mean±standard error of the mean (SEM). Significance was determined at P<0.05 level.
3. Results
3.1. Identification and characterization of pEnho cDNA
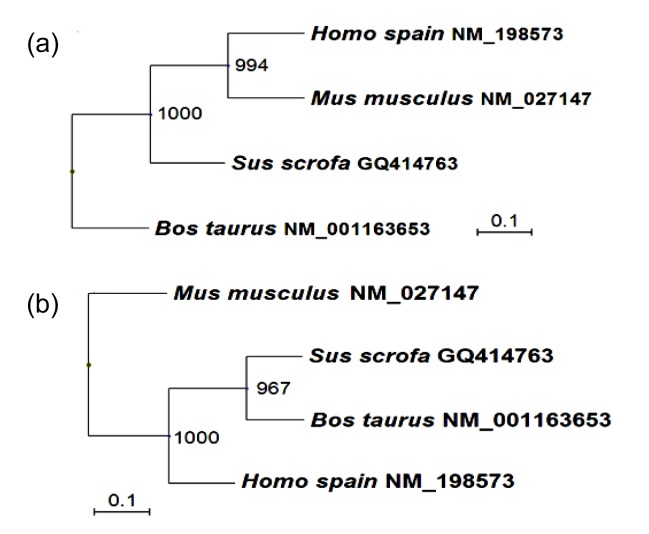
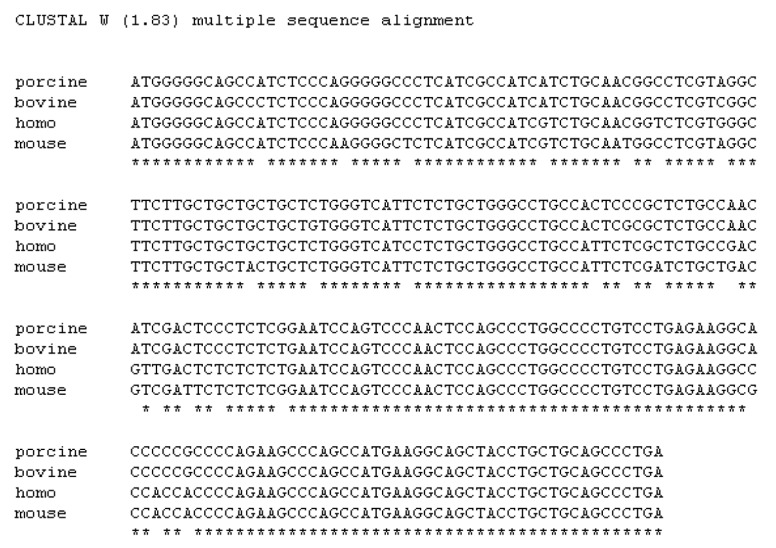
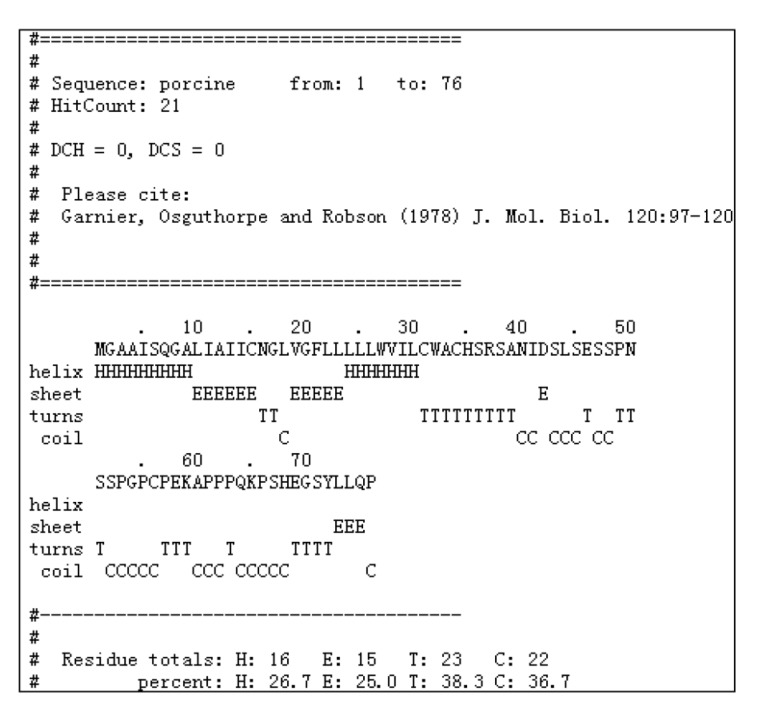
Using PCR, a fragment of approximately 763 base pair (bp) was sequenced. The sequence analysis revealed that the fragment was homologous to none of the known porcine genes. It was then submitted to the GenBank datebase (GenBank accession No. GQ414763). The open reading frame (ORF) of pEnho cDNA of 231 bp encoded a 76-amino acid (AA) polypeptide (Fig. 1). Hydrophobicity analysis of the AA sequence showed there was one putative trans-membrane helix between the 10th and the 32nd AAs (if the AA number of the helix is larger than 18, it is very likely to be a trans-membrane protein or have a signal peptide). The 1st to the 9th AAs lie outside the cell membrane and the 33rd to 76th lie inside the cell membrane (Fig. 1). Signal peptide analysis of the AA sequence showed that the most likely cleavage site was between positions 33 and 34 using NN models, and between positions 38 and 39 using HMM from the SignalP 3.0 Server (Fig. 1). Using the Gavel program, there is a potential cleavage site for mitochondrial presequence at SRS-AN (Fig. 1). Using the Motif Scan program, there are an N-myristoylation patter (MGAAISQ), a casein kinase II phosphorylation site (positions 43–46, SLSE), and a tyrosine kinase phosphorylation site (positions 65–72, KPSHEQSY) (Fig. 1). Program NNCN discrimination and the k-NN Prediction program (k=23) were used to predict adropin’s sub-cellular localization. The results indicated that adropin can enter the nucleus with 94.1% and 100% probability, respectively. Phylogenetic analyses of the gene and AA sequence were performed, and the resulting neighbor-joining tree showed that the pEnho had a closer relationship to the bovine than the human and mouse genes (Fig. 2). Analysis of gene homology indicated that the pEnho was 98% similar to the bovine gene, 94% similar to the human gene, and 93% similar to the mouse gene (Fig. 3). Analysis of protein homology indicated that there was only one AA difference between bovine and pig adropin. Human and mouse adropin share the same AA sequence (Fig. 4). Protein secondary structure prediction was carried out using the Garnier program. The result indicated that human, pig, bovine, and mouse adropin share similar protein secondary structure (Fig. 5).
Fig. 1.
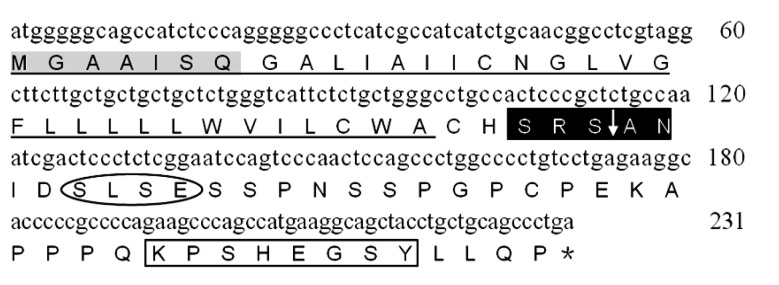
Nucleotide and predicted amino acid sequences of pEnho
The numbers on the right refer to the positions of the nucleotides. The stop codon is indicated by “*”. In the amino acid sequence, the potential N-myristoylation site (light gray boxed area), tyrosine kinase phosphorylation site (empty boxed area), casein kinase II phosphorylation site (ellipse area) and potential cleavage site for mitochondrial preseq (black boxed area) are indicated. A signal peptide sequence or a trans-membrane domain is indicated by “_”
Fig. 2.
Unrooted phylogenetic tree depicting the evolutionary relationship of the vertebrate Enho and adropin
The unrooted tree was constructed using the neighbor-joining (NJ) method based on the alignment of the complete AA sequences (a) and gene sequences (b) of known vertebrate Ehno genes. Bootstrap values (1000 replicates) indicating the occurrence of nodes are reported above each branch in the figure
Fig. 3.
Nucleotide sequence alignment of Homo sapiens, Mus musculus, Bos taurus, and Sus scrofa Enho genes
Multiple sequence alignment was generated using Clustal W 1.83
Fig. 4.

Amino acid alignment of Homo sapiens, Mus musculus, Bos taurus, and Sus scrofa Enho genes
Multiple sequence alignment was generated using Clustal W 1.83. The resulting alignment file was analyzed with Version 3.21 of BOXSHADE
Fig. 5.
Putative second structure of the adropin protein of Sus scrofa
Protein secondary structure prediction was made using the Garnier program
3.2. Relative abundance of pEnho mRNA at different ages and in different tissues
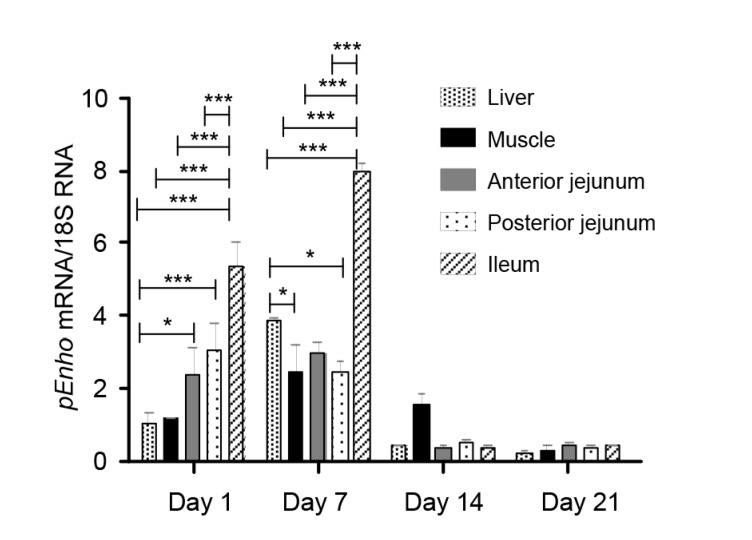
The tissue distribution of pEnho is shown in Table 1. pEnho transcript expression was detected in all tissues including liver, muscle, jejunum, and ileum. To investigate the expression profile of pEnho in the porcine small intestine, the pEnho mRNA levels in three segments were compared by quantitative RT-PCR. The ileum has the highest pEnho expression. The developmental change in the relative abundance of pEnho mRNA is shown in Table 1. The amount of pEnho mRNA in all tissues was highest at Day 7. The abundance of pEnho mRNA at Days 1 and 7 was greater than that at Days 14 and 21 (Fig. 6).
Table 1.
Relative abundance of pEnho mRNA in different tissues on different days
| Tissue | Relative abundance |
SEM | P-value | |||
| Day 1 | Day 7 | Day 14 | Day 21 | |||
| Liver | 1.057b | 3.863a | 0.400c | 0.243c | 0.187 | 0.001 |
| Muscle | 1.143bc | 2.487a | 1.560ab | 0.313c | 0.517 | 0.018 |
| Proximate jejunum | 2.410a | 2.947a | 0.373b | 0.437b | 0.541 | 0.002 |
| Distal jejunum | 3.080a | 2.420a | 0.517b | 0.367b | 0.559 | 0.003 |
| Ileum | 5.337b | 7.967a | 0.347c | 0.367c | 0.516 | 0.001 |
All results were normalized using GAPDH mRNA as an internal control in each real-time PCR. The relative abundances of pEnho transcript expression in liver, muscle, proximate jejunum, distal jejunum, and ileum were analyzed by the 2−ΔΔCT method. Values are expressed as mean and SEM (n=6). Values not sharing common superscript letters are significantly different at P<0.05
Fig. 6.
Relative abundance of pEnho mRNA in different tissues of piglets at Days 1, 7, 14, and 21
All samples were normalized using GAPDH. Data are expressed as mean±SEM (n=6). * P<0.05, ** P<0.01, *** P<0.001
4. Discussion
We cloned the pEnho gene and found it similar in size (231 bp) to Enho genes reported in other animals (Fig. 3). Porcine adropin cloned by the pEnho shows high overall identity (98%–99%) with other known adropins (Fig. 4) and clusters with bovine adropin in the reconstructed phylogenetic tree for either the gene or protein (Fig. 2).
TMHMM 2.0 program analysis revealed a putative trans-membrane or signal peptide in porcine adropin. However, using the NNCN program (Reinhardt’s method for Cytoplasmic/Nuclear discrimination) and the k-NN Prediction program, we found the porcine adropin predictive sub-cellular localization site in the nucleus with 94.1% and 100% reliability, respectively. So, we infer the existence of a nuclear, rather than trans-membrane, localization signal in porcine adropin. After processing and modification, porcine adropin enters the nucleus with the signal peptide, the signal peptide is then cleaved at SRS-AN and the residue of porcine adropin enters the nucleus where it functions. We then used the Helixturnhelix program to predict if helix-turn-helix motifs exist in porcine adropin. The result indicated that there were no helix-turn-helix motifs, nor zinc finger, leucine zipper nor helix-loop-helix motifs in porcine adropin (Fig. 5). This means that porcine adropin may not be a transcription factor (regulating the relative genes’ expression after directly combining with the nucleus). Using the Motif Scan program, we found the presence of N-myristoylation patter MGAAISQ, a casein kinase II phosphorylation site (positions 43–46, SLSE) and a tyrosine kinase phosphorylation site (positions 65–72). Thus, porcine adropin could be a secreted protein with a nuclear localization signal, which could regulate the expression of some genes as an adaptor molecule in some signal paths.
Our results indicated that the abundance of pEnho mRNA was higher in 7-d-old piglets than in 1-d-old piglets in the liver, muscle, and ileum (Table 1). Ganesh-Kumar et al. (2008) found that pEnho transcription in the liver was reduced with fasting and stimulated by food intake. The increase of pEnho transcription in piglets after birth may be associated with milk intake. Qiu et al. (2014) found that adropin concentration was significantly correlated with gestational age at birth and cord blood adropin levels were positively correlated with gestational age. We speculate that age may be another factor for the increase of pEnho mRNA from Day 1 to Day 7 after birth in the tissues of piglets. Milk fat is significantly important for animals in the suckling period, especially in the early newborn period (Neel, 1962), as it provides most of the energy for young animals. Milk, especially colostrum, contains a lot of fat. Many studies have shown that the transcription of pEnho mRNA increases with fat intake (Ganesh-Kumar et al., 2008; Aydin et al., 2013b). The fat in colostrum may increase the expression of adropin in piglets after birth. Also, we observed that the abundance of pEnho mRNA decreased rapidly from Day 7 after birth in all tissues (Table 1). The content of fat in colostrum is higher than in milk, and the percentage of fat in milk gradually decreases during the suckling period (Oosterveer et al., 2009; Aydin et al., 2013b). The reducing milk fat content may be responsible for the significant decrease in the abundance of pEnho mRNA in tissues from Days 7 to 21 after birth. At the same time, adropin levels in the colostrum of healthy mothers were shown to be higher than those in the mature milk (Aydin et al., 2013b), and adropin levels correlate negatively with age (r=−0.263, P=0.003) (Butler et al., 2012). These factors also play important roles in pEnho mRNA abundance and adropin expression.
The tissue distribution of Enho has been examined previously in several adult mammals, but few studies have investigated the distribution of Enho in developing animals, especially during lactation. The tissue distribution of Enho has been examined previously for humans, where Enho mRNA is more abundantly expressed in the liver than in the kidney and brain (Ganesh-Kumar et al., 2008). Surprisingly there are no data about the expression of Enho in intestine. Adropin is synthesized in many tissues, including renal, heart, pancreas (Kuloglu and Aydin, 2014), and liver tissue (Aydin et al., 2013b) as well as milk, cheese whey, plasma (Aydin, 2013), umbilical vein (Lovren et al., 2010), and salivary glands (Butler et al., 2012), but it is primarily synthesized and secreted from the liver where it changes the expression of lipogenesis genes (Ganesh-Kumar et al., 2008). However, our data indicate that pEnho mRNA was higher in the intestine than in the liver for 1-d-old and 7-d-old piglets (Fig. 6). The mRNA can enter colostrum by exocytosis (Izumi et al., 2012), the reason may be that colostrum contains pEnho mRNA at a higher level than in the liver of newborn piglets. Some researches have indicated that normal adropin concentration in human blood varies between (3.1±1.3) ng/ml (Celik E. et al., 2013), 3.4–4.5 ng/ml (Butler et al., 2012), and around 10 ng/ml (Aydin et al., 2013b), and in human milk varies from approximately 9 to 14.5 ng/ml (Aydin et al., 2013b). That means there is more adropin in milk than in blood. Adropin in blood mainly comes from the liver. We infer that the adropin content of milk is more than the amount of hepatic adropin synthesis. Further, pEnho mRNA abundance in milk is much higher than that in liver. The intestine absorbs the pEnho mRNA from colostrum, so, the level of pEnho mRNA is higher in the intestine than in the liver. The adropin content of the milk may be so high because it performs important functions, for example, promoting proliferation, migration, and capillary-like tube formation of endothelial cells (Lovren et al., 2010), regulating the postnatal growth and development of different organs in the newborn (Qiu et al., 2014), or reducing metabolic and oxidative stress in the lactating sow (Ganesh-Kumar et al., 2008; 2012; Celik E. et al., 2013). The pEnho mRNA level in the liver, muscle, and ileum is higher for 7-d-old than 1-d-old piglets perhaps because the liver enhances the expression of pEnho mRNA during the first 7 d of a piglet’s life.
Our results from PCR and quantitative RT-PCR analyses revealed that in 1-d-old piglets Enho abundance was low in the liver and muscle and high in small intestine; in 7-d-old piglets Enho abundance was low in the muscle and jejunum and high in the liver and ileum (Fig. 6). There were no significant differences of pEnho expression among all tissues in 14-d-old and 21-d-old piglets (Fig. 6). Developmental changes in intestinal function occur in the perinatal period of many species. For pigs and other mammals, the period between birth and weaning is characterized by rapid growth of the intestine, with energy utilization rate exceeding that measured at other stages of development. After birth, the developing piglet small intestine faces major changes in the functional demands that are placed on it. Adropin could influence the regulation of metabolic pathways and the postnatal growth and development of different organs in the newborn. The high expression of pEnho in the liver and intestine may contribute to energy homeostasis during the perinatal period and adapt piglets to big environmental and physiological changes.
5. Conclusions
In summary, we have cloned the porcine Enho gene, which encodes a 76-AA protein with one trans-membrane domain or signal peptide. It has a high degree of sequence and structure similarity with bovine Enho. Our data suggest that adropin is a secreted factor involved in energy homeostasis and metabolic adaptation to dietary macronutrients (Ganesh-Kumar et al., 2008) which could provide a promising new lead for developing therapies against the metabolic disorders associated with obesity and weaning stress (Zigman and Elmquist, 2003; Muoio and Newgard, 2006).
Footnotes
Project supported by the National Natural Science Foundation of China (No. 31302003), the Key Program of Hunan Province Scientific and Technology Planning Project (No. 2100CK2006), the Special Fund for Innovative and Entrepreneurship Talents of Changsha City (No. K1307006-21), and the Key Program of Changsha Scientific and Technology Planning Project (No. K1201108-21), China
Compliance with ethics guidelines: Sheng-ping WANG, Yun-ling GAO, Gang LIU, Dun DENG, Rong-jun CHEN, Yu-zhe ZHANG, Li-li LI, Qing-qi WEN, Yong-qing HOU, Ze-meng FENG, and Zhao-hui GUO declare that they have no conflict of interest.
All institutional and national guidelines for the care and use of laboratory animals were followed.
References
- 1.Aydin S. Presence of adropin, nesfatin-1, apelin-12, ghrelins and salusinspeptides in the milk, cheese whey and plasma of dairy cows. Peptides. 2013;43:83–87. doi: 10.1016/j.peptides.2013.02.014. [DOI] [PubMed] [Google Scholar]
- 2.Aydin S, Kuloglu T, Aydin S. Copeptin, adropin and irisin concentrations in breast milk and plasma of healthy women and those with gestational diabetes mellitus. Peptides. 2013;47:66–70. doi: 10.1016/j.peptides.2013.07.001. [DOI] [PubMed] [Google Scholar]
- 3.Aydin S, Kuloglu T, Aydin S, et al. Expression of adropin in rat brain, cerebellum, kidneys, heart, liver, and pancreas in streptozotocin-induced diabetes. Mol Cell Biochem. 2013;380(1-2):73–81. doi: 10.1007/s11010-013-1660-4. [DOI] [PubMed] [Google Scholar]
- 4.Aydin S, Kuloglu T, Aydin S, et al. Elevated adropin: a candidate diagnostic marker for myocardial infarction in conjunction with troponin-I. Peptides. 2014;58:91–97. doi: 10.1016/j.peptides.2014.06.001. [DOI] [PubMed] [Google Scholar]
- 5.Butler AA, Tam CS, Stanhope KL, et al. Low circulating adropin concentrations with obesity and aging correlate with risk factorsfor metabolic disease and increase after gastric bypass surgery in humans. J Clin Endocrinol Metab. 2012;97(10):3783–3791. doi: 10.1210/jc.2012-2194. [DOI] [PMC free article] [PubMed] [Google Scholar]
- 6.Celik A, Balin M, Kobat MA, et al. Deficiency of a new protein associated with cardiac syndrome X; called adropin. Cardiovasc Ther. 2013;31(3):174–178. doi: 10.1111/1755-5922.12025. [DOI] [PubMed] [Google Scholar]
- 7.Celik E, Yilmaz E, Celik O, et al. Maternal and fetal adropin levels in gestational diabetes mellitus. J Perinat Med. 2013;41(4):375–380. doi: 10.1515/jpm-2012-0227. [DOI] [PubMed] [Google Scholar]
- 8.Ganesh-Kumar K, Trevaskis JL, Lam DD, et al. Identification of adropin as a secreted factor linking dietary macronutrient intake with energy homeostasis and lipid metabolism. Cell Metab. 2008;8(6):468–481. doi: 10.1016/j.cmet.2008.10.011. [DOI] [PMC free article] [PubMed] [Google Scholar]
- 9.Ganesh-Kumar K, Zhang JY, Gao S, et al. Adropin deficiency is associated with increased adiposity and insulin resistance. Obesity. 2012;20(7):1394–1402. doi: 10.1038/oby.2012.31. [DOI] [PMC free article] [PubMed] [Google Scholar]
- 10.Gao S, McMillan RP, Jacas J, et al. Regulation of substrate oxidation preferences in muscle by the peptide hormone adropin. Diabetes. 2014;63(10):3242–3252. doi: 10.2337/db14-0388. [DOI] [PMC free article] [PubMed] [Google Scholar]
- 11.Gavel Y, von Heijne G. Cleavage-site motifs in mitochondrial targeting peptides. Protein Eng. 1990;4(1):33–37. doi: 10.1093/protein/4.1.33. [DOI] [PubMed] [Google Scholar]
- 12.Geng MM, Li TJ, Kong XF, et al. Reduced expression of intestinal N-acetylglutamate synthase in suckling piglets: a novel molecular mechanism for arginine as a nutritionally essential amino acid for neonates. Amino Acids. 2011;40(5):1513–1522. doi: 10.1007/s00726-010-0761-6. [DOI] [PubMed] [Google Scholar]
- 13.Gozal D, Kheirandish-Gozal L, Bhattacharjee R, et al. Circulating adropin concentrations in pediatric obstructive sleepapnea: potential relevance to endothelial function. J Pediatr. 2013;163(4):1122–1126. doi: 10.1016/j.jpeds.2013.05.040. [DOI] [PMC free article] [PubMed] [Google Scholar]
- 14.He QH, Ren PP, Kong XF, et al. Comparison of serum metabolite compositions between obese and lean growing pigs. J Nutr Biochem. 2012;23(2):133–139. doi: 10.1016/j.jnutbio.2010.11.007. [DOI] [PubMed] [Google Scholar]
- 15.Izumi H, Kosaka N, Shimizu T, et al. Bovine milk contains microRNA and messenger RNA that are stable under degradative conditions. J Dairy Sci. 2012;95(9):4831–4841. doi: 10.3168/jds.2012-5489. [DOI] [PubMed] [Google Scholar]
- 16.Kuloglu T, Aydin S. Immunohistochemical expressions of adropin andinducible nitric oxide synthase in renal tissues of rats with streptozotocin-induced experimental diabetes. Biotech Histochem. 2014;89(2):104–110. doi: 10.3109/10520295.2013.821713. [DOI] [PubMed] [Google Scholar]
- 17.Lian WL, Gu XS, Qin YW, et al. Elevated plasma levels of adropin in heart failure patients. Intern Med. 2011;50(15):1523–1527. doi: 10.2169/internalmedicine.50.5163. [DOI] [PubMed] [Google Scholar]
- 18.Lovren F, Pan Y, Quan A, et al. Adropin is a novel regulator of endothelial function. Circulation. 2010;122(11 Suppl. 1):S185–S192. doi: 10.1161/CIRCULATIONAHA.109.931782. [DOI] [PubMed] [Google Scholar]
- 19.Muoio DM, Newgard CB. Obesity-related derangements in metabolic regulation. Annu Rev Biochem. 2006;75(1):367–401. doi: 10.1146/annurev.biochem.75.103004.142512. [DOI] [PubMed] [Google Scholar]
- 20.Neel JV. Diabetes mellitus: a ‘thrifty’ genotype rendered detrimental by ‘progress’. Am J Hum Genet. 1962;14(4):353–362. [PMC free article] [PubMed] [Google Scholar]
- 21.Henchion M, McCarthy M, Resconi VC, et al. Meat consumption: trends and quality matters. Meat Sci. 2014;98(3):561–568. doi: 10.1016/j.meatsci.2014.06.007. [DOI] [PubMed] [Google Scholar]
- 22.Oosterveer MH, van Dijk TH, Tietge UJF, et al. High fat feeding induces hepatic fatty acid elongation in mice. PLoS ONE. 2009;4(6):e6066. doi: 10.1371/journal.pone.0006066. [DOI] [PMC free article] [PubMed] [Google Scholar]
- 23.Qiu X, He JR, Zhao MG, et al. Relationship between human cord blood adropin levels and fetal growth. Peptides. 2014;52:19–22. doi: 10.1016/j.peptides.2013.11.013. [DOI] [PubMed] [Google Scholar]
- 24.Sayın O, Tokgoz Y, Arslan N. Investigation of adropin and leptin levels in pediatric obesity-related nonalcoholic fatty liver disease. J Pediatr Endocrinol Metab. 2014;27(5-6):479–484. doi: 10.1515/jpem-2013-0296. [DOI] [PubMed] [Google Scholar]
- 25.St-Onge MP, Shechter A, Shlisky J, et al. Fasting plasma adropin concentrations correlate with fat consumption in human females. Obesity. 2014;22(4):1056–1063. doi: 10.1002/oby.20631. [DOI] [PMC free article] [PubMed] [Google Scholar]
- 26.Tan B, Yin YL, Liu ZQ, et al. Dietary L-arginine supplementation differentially regulates expression of lipid-metabolic genes in porcine adipose tissue and skeletal muscle. J Nutr Biochem. 2011;22(5):441–445. doi: 10.1016/j.jnutbio.2010.03.012. [DOI] [PubMed] [Google Scholar]
- 27.Topuz M, Celik A, Aslantas T, et al. Plasma adropin levels predictendothelial dysfunction like flow-mediated dilatation in patients with type 2 diabetes mellitus. Clin Res. 2013;61(8):1161–1164. doi: 10.231/JIM.0000000000000003. [DOI] [PubMed] [Google Scholar]
- 28.Wang WC, Shi CY, Zhang JS, et al. Molecular cloning, distribution and ontogenetic expression of the oligopeptide transporter PepT1 mRNA in Tibetan suckling piglets. Amino Acids. 2009;37(4):593–601. doi: 10.1007/s00726-008-0178-7. [DOI] [PubMed] [Google Scholar]
- 29.Wong CM, Wang Y, Lee JT, et al. Adropin is a brain membrane-bound protein regulating physical activity via NB-3/Notch signaling pathway in mice. J Biol Chem. 2014;289(37):25976–25986. doi: 10.1074/jbc.M114.576058. [DOI] [PMC free article] [PubMed] [Google Scholar]
- 30.Wu L, Fang J, Chen L, et al. Low serum adropin is associated with coronary atherosclerosis in type 2 diabetic and non-diabetic patients. Clin Chem Lab Med. 2014;52(5):751–758. doi: 10.1515/cclm-2013-0844. [DOI] [PubMed] [Google Scholar]
- 31.van der Laan JW, Brightwell J, McAnulty P, et al. Regulatory acceptability of the minipig in the development of pharmaceuticals, chemicals and other products. J Pharmacol Toxicol Methods. 2010;62(3):184–195. doi: 10.1016/j.vascn.2010.05.005. [DOI] [PubMed] [Google Scholar]
- 32.Yao K, Yin YL, Chu WY, et al. Dietary arginine supplementation increases mTOR signaling activity in skeletal muscle of neonatal pigs. J Nutr. 2008;138(5):867–872. doi: 10.1093/jn/138.5.867. [DOI] [PubMed] [Google Scholar]
- 33.Yildirim B, Celik O, Aydin S. Adropin: a key component and potential gatekeeper of metabolic disturbances in policystic ovarian syndrome. Clin Exp Obstet Gynecol. 2014;41(3):310–312. [PubMed] [Google Scholar]
- 34.Yu HY, Zhao P, Wu MC, et al. Serum adropin levels are decreased in patients with acute myocardial infarction. Regul Pept. 2014;190-191:46–49. doi: 10.1016/j.regpep.2014.04.001. [DOI] [PubMed] [Google Scholar]
- 35.Zhang C, Zhao L, Xu W, et al. Correlation of serum adropin level with coronary artery disease. Natl Med J China. 2014;94(16):1255–1267. (in Chinese) [PubMed] [Google Scholar]
- 36.Zhang YG, Yin YL, Fang J, et al. Pig production in subtropical agriculture. J Sci Food Agric. 2012;92(5):1016–1024. doi: 10.1002/jsfa.4679. [DOI] [PubMed] [Google Scholar]
- 37.Zigman JM, Elmquist JK. Minireview: from anorexia to obesity: the yin and yang of body weight control. Endocrinology. 2003;144(9):3749–3756. doi: 10.1210/en.2003-0241. [DOI] [PubMed] [Google Scholar]


