

Abstract
Summary
Purpose:
About one-third of patients with epilepsy are refractory to medical treatment and may be amenable to surgery. However, in patients with lesions on or near the presumed course of the optic radiation, the potential benefits of resection must be balanced against the risk of a visual field deficit. This study demonstrates the utility of diffusion tensor imaging (DTI) tractography in delineating the course of the optic radiation and its relationship to the epileptogenic lesion prior to epilepsy surgery.
Methods:
Anatomic and DTI scans were acquired on 10 patients with medically refractory epilepsy undergoing presurgical evaluation at the National Hospital for Neurology and Neurosurgery. Five patients underwent surgery and repeat scans postoperatively. The optic radiation was delineated and visualized in relation to the lesions on anatomic images and in three-dimensional (3D) reconstructions. Preoperative and postoperative visual fields were acquired by Goldmann perimetry.
Key Findings:
The entire optic radiation was reliably delineated bilaterally in all patients. The results provide helpful additional information in informing the patient of the risks of surgery and in planning the surgical procedure and approach. Postoperative imaging findings correlated with the visual field data.
Significance:
The optic radiation shows significant anatomic variability, but can be reliably delineated by tractography. Because surgical disruption of the optic radiation has serious consequences for the patient, DTI tractography is a useful technique in this population. Future integration with real-time neuronavigation will minimize the risks of neurosurgery.
Keywords: Epilepsy, Diffusion tensor imaging, Neurosurgery, Visual fields
Epilepsy is a common and serious neurologic condition with a prevalence of 400–800 per 100,000 (Sander & Shorvon, 1996). Approximately 30% of patients with focal epilepsies fail to respond to drug therapy and should be considered for surgical treatment. The majority of these patients have seizures arising from the anteromedial temporal lobe, for which anterior temporal lobe resection is a well-established and effective treatment (Wiebe et al., 2001). The remainder with neocortical epilepsy are most commonly treated by cortical resection (Roper, 2009), particularly if a focal lesion is demonstrated on neuroimaging and confirmed to be the epileptogenic focus. The decision to proceed to surgery must be balanced against the risks of significant neurologic deficits from surgical damage to eloquent gray matter and white matter tracts.
The optic radiation conveying visual information from the lateral geniculate nucleus (LGN) to the primary visual cortex in the occipital cortex has a long course passing through both the temporal and parietal lobes. Fibers carrying visual information from the inferior retina (representing the superior visual field) first pass anteriorly from the LGN into the temporal lobe looping around the temporal horn of the lateral ventricle (Meyer’s loop) before coursing posteriorly. Fibers from the superior retina run directly posteriorly through the parietal lobe to the occipital pole (Fig. 1). Attention has focused on the delineation of Meyer’s loop, as it is particularly susceptible to damage during anterior temporal lobe resection. Postoperative visual field defects are seen in between 52% (Tecoma et al., 1993) and 100% (Barton et al., 2005) of patients, with one fourth failing to meet United Kingdom criteria for driving after surgery (Manji & Plant, 2000). However, the optic radiation is also vulnerable at other points on its course when a neocortical resection is considered.
Figure 1.
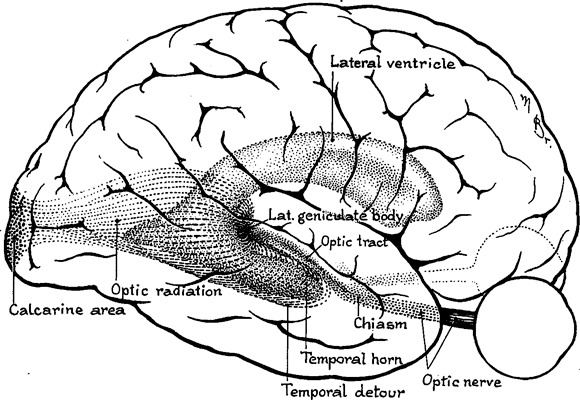
Optic radiation viewed from lateral aspect showing the “temporal detour” (Meyer’s loop). Derived from Cushing’s original drawing in 1921 (Cushing, 1921).
The optic radiation shows significant anatomic variability between subjects (Ebeling & Reulen, 1988) and it cannot be delineated on conventional clinical magnetic resonance imaging (MRI) sequences. Diffusion tensor imaging (DTI) is a specialist imaging technique that measures the directional diffusion of water in tissues and can be used to infer the microstructure of white matter (Basser, 1995). Tractography algorithms can be applied to these data to noninvasively map out white matter pathways, such as the optic radiation (Mori & van Zijl, 2002). In this article, the utility of preoperative tractography in patients with lesions lying near the presumed course of the optic radiation is illustrated. Particular reference is made to optimizing the technique, consideration of the risk of surgery, visualization aiding surgical planning, and the validation of results.
Methods
Subjects
We studied 10 patients (mean age 27.3 years, range 17–40 years, three male) with medically refractory epilepsy who were undergoing presurgical evaluation at the National Hospital for Neurology and Neurosurgery, London, United Kingdom. All patients had structural MRI scans performed at 3 Tesla (3T) (Duncan, 1997) demonstrating lesions lying near the presumed course of the optic radiation. None of the patients had previously used vigabatrin. The most common diagnosis was dysembryoplastic neuroepithelial tumour (DNET, n = 3). One patient apiece had focal cortical dysplasia (FCD), an epidermoid tumor, damage to an infantile head injury, an infarct, a cavernoma, tuberous sclerosis, and a previous otogenic temporal lobe abscess. Five of the patients have subsequently undergone resective surgery.
The study was approved by the National Hospital for Neurology and Neurosurgery and the Institute of Neurology Joint Ethics Committee, and informed written consent was obtained from all subjects. Patient demographics, clinical and imaging diagnoses, and management plans are listed in Table 1.
Table 1.
Patient demographics, clinical and imaging diagnoses, and management plan
| No | Age/gender | Age of onset (years) | Imaging diagnosis | Location of optic radiation | Visual fields | Management plan |
|---|---|---|---|---|---|---|
| 1 | 25/F | 11 | Left parietal FCD | Just inferomedial to lesion | Normal (pre- and post-op) | Intracranial recordings, then resection – FCD IIb (seizure free) |
| 2 | 26/F | 11 | Right inferior parietal DNET | Inferomedial to lesion, but in close proximity | Normal (pre- and post-op) | Resection – DNET (seizure free) |
| 3 | 26/F | 9 | Tuberous sclerosis – right parietal tuber | Well inferomedial to presumptive epileptogenic tuber | L hemianopia (post-op) | Intracranial recordings, chose an extensive resection (seizure free) |
| 4 | 30/F | 15 | Left otogenic temporal abscess | Meyer’s loop confluent with area of abnormality | L sup quadrantanopia (post-op) | Intracranial recordings, then resection – HS (seizure free) |
| 5 | 17/F | 11 | Right fusiform gyrus DNET | Superior to and separate to lesion | R sup quadrantanopia (post-op) | Anterior temporal lobe resection – DNET (seizure free) |
| 6 | 26/F | 12 | Left parietooccipital damage | Just inferior to and involving area of damage | Normal (pre-op) | Declined surgery (low chance of success and risk to vision) |
| 7 | 39/M | 5 | Right occipitotemporal damage | Passes directly through area of damage | Normal (pre-op) | Surgery not advised (lesion too extensive, risk to vision) |
| 8 | 40/M | 7 | Left inferior occipital DNET | Most inferior part courses directly to lesion | Paracentral scotoma (pre-op) | Declined surgery (risk of VFD, already had scotoma) |
| 9 | 18/F | 17 | Left frontotemporal epidermoid | Meyer’s loop closely approaches posterior of lesion | Normal (pre-op) | Advised further medication trials prior to surgery (risk to vision) |
| 10 | 26/M | 22 | Left temporal cavernoma | Displaced over superomedial aspect of cavernoma | Normal (pre-op) | Advised further medication trials prior to surgery (risk to vision) |
Magnetic resonance imaging data
MRI studies were performed on a 3T GE Excite II scanner (General Electric, Waukesha, WI, U.S.A.). Standard imaging gradients with a maximum strength of 40 mT/m and slew rate 150 T/m/s were used. All data were acquired using a body coil for transmission and eight channel phased array coil for reception. Standard clinical sequences were performed including a coronal T1-weighted volumetric acquisition with 170 contiguous 1.1-mm thick slices and a T2-weighted coronal fluid-attenuated inversion recovery (FLAIR) acquisition with 32 contiguous 5-mm thick slices. Both these acquisitions have a matrix size of 256 × 256 (the FLAIR is acquired with a 256 × 224 matrix and zero-filled) giving an in-plane resolution of 0.9375 × 0.9375 mm.
DTI acquisition
DTI data were acquired using a cardiac-triggered single-shot spin-echo planar imaging (EPI) sequence (Wheeler-Kingshott et al., 2002) with TE = 73 ms. Sets of 60 contiguous 2.4-mm thick axial slices were obtained covering the whole brain, with diffusion-sensitizing gradients applied in each of 52 noncollinear directions [b value of 1200 mm2/s (σ = 21 ms, Δ = 29 ms, using full gradient strength of 40 mT/m)] along with six nondiffusion weighted scans. The gradient directions were calculated and ordered as described elsewhere (Cook et al., 2007). The field of view was 24 cm, and the acquisition matrix size was 96 × 96, zero filled to 128 × 128 during reconstruction, giving a reconstructed voxel size of 1.875 × 1.875 × 2.4 mm. The DTI acquisition time for a total of 3,480 image slices was approximately 25 min (depending on subject heart rate).
DTI preprocessing
The scans were transferred to a Linux-based Sun Ultra workstation in DICOM format and converted to a single multivolume Analyze 7.5 format file using locally written software. Eddy current correction of the DTI data was performed using the eddy correct tool in FSL v4.0.1 (http://www.fmrib.ox.ac.uk/fsl/).
A multitensor model was fitted to the eddy-corrected diffusion data using the Camino toolkit version 2 release 767 (http://www.camino.org.uk/) (Cook et al., 2006). Voxels in which a single tensor fitted the data poorly were identified using a spherical-harmonic voxel-classification algorithm (Alexander et al., 2002). In these voxels a two tensor model was fitted, with the principal diffusion directions of the two diffusion tensors providing estimates of the orientations of the crossing fibers. In all other voxels, a single tensor model was fitted.
Tractography
Tractography analysis was carried out using the Probabilistic Index of Connectivity (PICo) algorithm (Parker et al., 2003) implemented in Camino extended to deal with multiple fibers (Parker and Alexander, 2003; Cook et al. )2004. Seed, way, and exclusion masks were defined using MRIcro (http://cabiatl.com/mricro/).
Fractional anisotropy and principal diffusion direction maps were used to identify the LGN by selecting the axial slice at the level of the transition from the posterior limb of the internal capsule to the cerebral peduncle. Voxels anterolateral to the LGN across the base of Meyer’s loop, with principal eigenvectors oriented in an anteromedial to posterolateral orientation, were identified and used to define a seed point in a coronal plane (Fig. 2A,C). Contiguous voxels, with principal directions in an anterior–posterior direction, were also selected in order to cover the entire coronal cross-section of Meyer’s loop, using a standardized seed point volume of 15 voxels (127 mm3). A second seed point was defined in the LGN on two axial slices (Fig. 2D) with a standardized volume of 18 voxels (152 mm3, 3 × 3 × 2 voxels) to ensure delineation of superior portion of the optic radiation. Data from these two seed regions were amalgamated to visualize the entire radiation.
Figure 2.
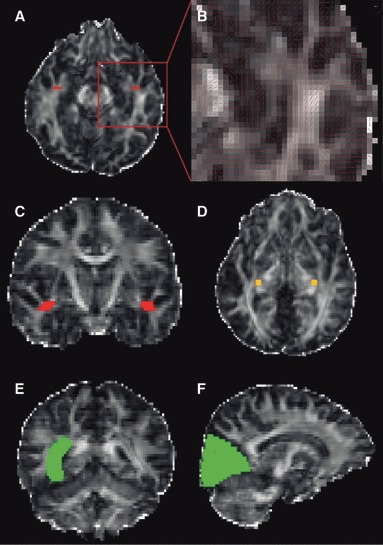
Seed points were defined across Meyer’s loop, red (A– axial slice, B– close up of axial slice with principal diffusion directions showing the high curvature of the loop, C– coronal slice) and in the LGN, orange (D). Way points, green, were defined in the stratum sagittale (lateral wall of the lateral ventricle) (E) and the primary visual cortex (F). Displayed on the fractional anisotropy map.
Tracking from each of the two seed points was performed separately using 50,000 Monte Carlo iterations, an angular threshold of 180 degrees, and a fractional anisotropy threshold of 0.1, in order to ensure that the paths detected would not erroneously enter areas of cerebrospinal fluid and yet had sufficient angular flexibility to allow tracking of Meyer’s loop.
In order to restrict the pathway to anatomically valid tracts, two way points were defined in the lateral wall of the occipital horn of the lateral ventricle at the posterior extent of the corpus callosum (Fig. 2E) and in the primary visual cortex in a sagittal plane 8 voxels lateral to the midline (Fig. 2F). Two exclusion masks were applied. First a midline exclusion mask and then a coronal exclusion mask to remove artifactual connections to adjacent white matter tracts, such as the frontooccipital fasciculus, anterior commissure, and uncinate fasciculus. An objective, iterative process was performed to determine the optimum location for this mask whereby the exclusion mask was moved posteriorly until it began to coincide with Meyer’s loop, identified by a visible thinning of the estimated trajectory of the optic radiation, typically associated with a reduction in tract volume >10% (Yogarajah et al., )2009.
Connectivity distributions were generated from each voxel in a chosen seed point and combined into an overall connectivity map representing the maximum observed connection probability to each voxel within the brain from all the voxels within a seed point. Connectivity maps were generated separately for the two seed regions in each hemisphere and combined into a single connectivity map by taking the maximum from the two connectivity maps on a voxelwise basis. For display on fractional anisotropy maps, the connectivity map was thresholded to include only voxels with a connection probability >5%, representing a compromise between retaining anatomically valid tracts, and removing obviously artifactual connections.
Coregistration and display of tractography data
For each patient, a 12 d.f. affine transform from diffusion space to anatomic space (either T1 or FLAIR) was calculated using FLIRT, the linear image registration tool in FSL. The first b = 0 image to which all other diffusion volumes were registered was used as the source image with a normalized mutual information cost function to account for the differing image contrasts. These transformations were applied to the connectivity maps generated from the tractography, and the result was overlaid on the anatomic images using the image viewing tool in FSL.
In order to display preoperative tractography data on postoperative data, an initial affine registration between the preoperative and postoperative anatomic images using FLIRT was followed by a nonlinear Fast Free-Form Deformation using the Niftyreg toolkit (http://sourceforge.net/projects/niftyreg/) (Modat et al., 2010). This accounts for the brain shift and deformation occurring as a consequence of surgery.
Visual field assessment
Preoperative and postoperative visual fields were assessed by Goldmann perimetry using three isopters (V4e, I4e, I2e).
Results
For each patient, the optic radiations were successfully delineated and the relationship to lesions demonstrated (Table 1).
Validation of tractography with postoperative outcome
Tractography may assist surgical planning by suggesting the optimum approach to a lesion and indicating the proximity of the lesion to the optic radiation. In Patient 1, preoperative tractography identified the optic radiation passing just inferomedial to the left parietal FCD (Fig. 3A–C). This was resected approaching from the superior aspect via an awake craniotomy to preserve language function. Only a single provoked seizure occurred in the 2 years following surgery, and no visual field deficit (VFD) resulted. The area of resection approached but did not involve the optic radiation (Fig. 3D).
Figure 3.
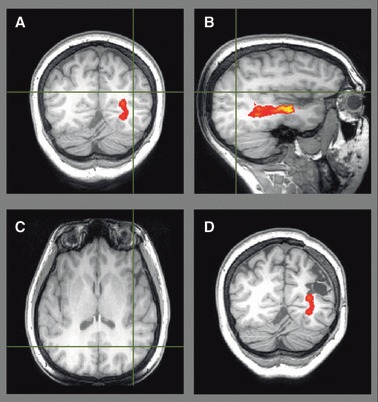
Patient 1. Preoperative tractography (A–C) showing the optic radiation passing inferomedial to the left parietal FCD (crosshair) on a T1-weighted image. Postoperative T1-weighted image with overlaid preoperative tractography (D) showing no damage. Visual fields were normal.
In Patient 2, tractography suggested that the right inferior parietal DNET should be approached superolaterally as the most superior portion of the optic radiation lies just deep to it (Fig. 4A–C). Such an approach rendered the patient seizure free and without a VFD, consistent with postoperative imaging (Fig. 4D).
Figure 4.
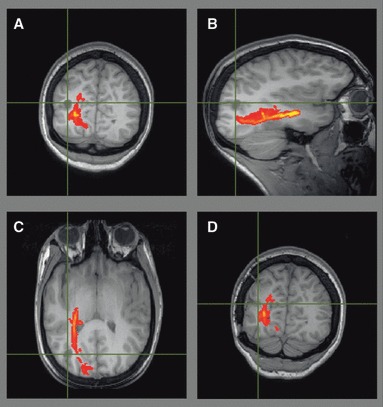
Patient 2. Preoperative tractography (A–C) showing the optic radiation just inferomedial to the right inferior parietal DNET (crosshair) on a T1-weighted volumetric image. Postoperative T1-weighted image with overlaid preoperative tractography (D) showing no damage. Visual fields were normal.
Tractography can also assist in advising the patient about the risks to vision from surgery. In Patient 3, a presumptive epileptogenic tuber well separate from the optic radiation was identified in the right parietal lobe on MRI, magnetoencephalography (MEG), and EEG (Fig. 5A). Intracranial recordings, however, demonstrated rapid spread more posteriorly. The choice between a more conservative resection (low risk to vision) versus an extensive resection (certain hemianopia, but greater chance of seizure freedom) was discussed and the patient opted for the latter. She became seizure free but with a complete hemianopia (Fig. 5B–D).
Figure 5.
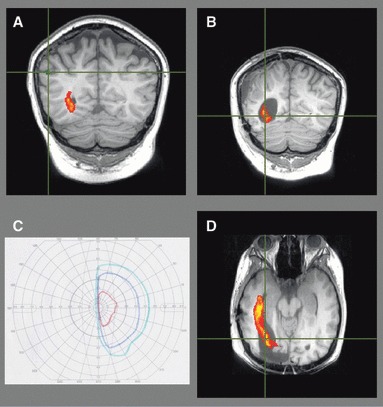
Patient 3. Preoperative tractography (A) showing the optic radiation well separated from the presumptive epileptogenic tuber identified on MEG (crosshair/green). Postoperative imaging of the extensive resection to achieve seizure freedom (B, D) confirms the damage to the optic radiation resulting in a left hemianopia (C, left eye shown).
Patient 4 developed epilepsy at the age of 15 secondary to an otogenic left temporal lobe abscess. MRI revealed left hippocampal sclerosis (HS) and an extensive area of abnormality in the left temporal lobe, extending anteriorly to the level of the amygdala, and with the posterior extent well behind the fourth ventricle. Tractography demonstrated Meyer’s loop abutting the area of abnormality (Fig. 6), so the patient was advised about the high risk of a visual deficit. Intracranial EEG recordings confirmed seizure onset in the hippocampus, and the patient underwent a left anterior temporal lobe resection including the hippocampus and the majority of the area of damage. She is seizure free at 8 months and has a right superior quadrantanopia.
Figure 6.
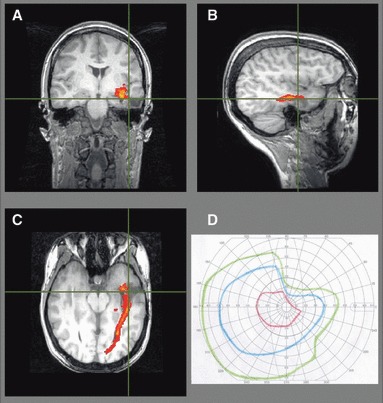
Patient 4. Preoperative imaging showed the optic radiation was involved by the otogenic left temporal lobe abscess (A–C), so surgery resulted in a partial right superior quadrantanopia (D).
Patient 5 had a right fusiform gyrus DNET distinct from the optic radiation (Fig. 7A) but elected for a standard anterior temporal lobe resection to give the greatest chance of seizure freedom. This was achieved but caused a left superior quadrantanopia. Postoperative imaging shows that the resection included a small part of Meyer’s loop (Fig. 7B).
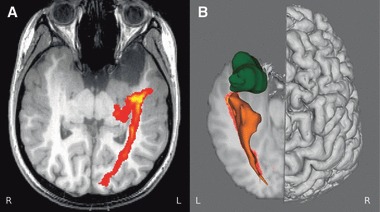
Figure 7.
Patient 5. Three-dimensional rendering of preoperative tractography (A) showing left fusiform gyrus DNET (green) separate from the optic radiation (orange). The patient elected a standard anterior temporal lobe resection, resulting in a left superior quadrantanopia (B). The postoperative T1-weighted image with the overlaid preoperative tractography confirmed involvement of the optic radiation (B).
Tractography assists the decision not to proceed to surgery
In Patient 6, imaging revealed extensive left parietooccipital damage from an infantile head injury and visual fields were normal. As anatomic imaging suggested that the optic radiation may be at risk, tractography was performed confirming that the optic radiation was confluent with the area of damage, so surgical resection would cause a visual deficit (Fig. 8A). The patient declined to pursue surgery due to the low odds of seizure freedom coupled with a postoperative VFD.
Figure 8.
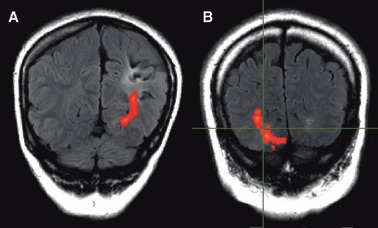
Patient 6 (A). T2 FLAIR image showing involvement of the optic radiation by the area of damage. Surgery was declined. Patient 7 (B). T2 FLAIR image showing optic radiation passing directly through the area of damage from an infarct (crosshair). Surgery was not pursued.
In Patient 7, the optic radiation was shown to pass directly through the area of right occipitotemporal damage from an infarction (Fig. 8B). Surgery was not pursued, as the lesion was so extensive that the required surgery would cause too great a neurologic deficit. Similarly, Patient 8 with a left inferior occipital DNET had a preexisting paracentral scotoma, and tractography confirmed that the optic radiation passed directly toward the lesion. He declined further surgery as this would extend the visual deficit.
Tractography leads to a decision to defer surgery for now
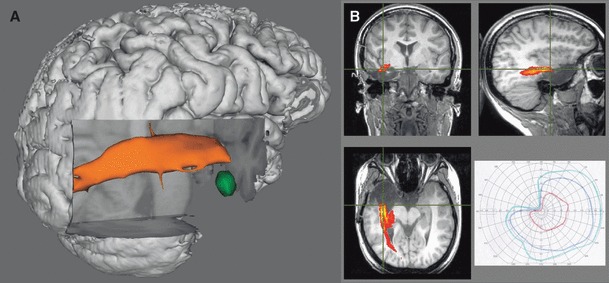
Tractography can help inform the decision whether to pursue further medication trials or surgery depending upon the risk to vision. Patient 9, in whom MRI imaging demonstrated a large frontotemporal epidermoid tumor, was advised that Meyer’s loop would be at risk during a resection, since this has been shown to be very close to the tumor (Fig. 9). Although presumably an extrinsic tumor, surgical access may involve passing through or damage to neocortex. As she had only tried lamotrigine and levetiracetam, serial imaging and further medications trials are planned prior to considering surgery.
Figure 9.
Patient 9. Axial T1-weighted image showing the close approach of Meyer’s loop to the epidermoid tumor (A). This is better appreciated in a 3D rendering (B).
Patient 10 has a 4-year history of complex partial seizures that were previously controlled, but recurred with a bleed from a left temporal cavernoma. The optic radiation has been displaced superiorly over the cavernoma. The visual fields are normal and they would be at high risk in any operation (Fig. 10). The patient is keen to pursue surgery, but in view of the imaging findings has been advised to consider further medication trials first.
Figure 10.

Patient 10. Coronal FLAIR image showing optic radiation passing superomedial over cavernoma (A). Three-dimensional rendering viewed from the left clearly shows the displacement of the tract by the cavernoma (B).
Discussion
We have validated tractography of the optic radiation by comparison of data with postoperative visual fields in five patients. We have also demonstrated how the results of this method may inform surgical decisions. Epilepsy surgery is potentially curative, but damage to white matter tracts can cause serious morbidity. Imaging serves a central role in the work-up for epilepsy surgery, both in the identification of the seizure onset zone [structural magnetic resonance imaging (MRI), positron emission tomography (PET), and ictal single photon emission computed tomography (SPECT)] and of eloquent areas (functional MRI, DTI tractography) (Duncan, 2010).
Delineation of the optic radiation is important for several reasons. Firstly, there is great anatomic variability in the location of the optic radiation, even in healthy subjects, and it may be displaced by pathology. In a postmortem dissection study involving 25 subjects, the distance from the temporal pole to Meyer’s loop varied from 22–37 mm, whereas the breadth of the optic radiation at the posterior limit of the posterior horn of the lateral ventricles varied from 18–32 mm (Ebeling & Reulen, 1988).
Secondly, the most common concern identified by patients with moderately severe epilepsy is driving (Gilliam et al., 1997). A severe VFD can be very disabling, but even a mild VFD may preclude a seizure-free patient from holding a driving licence. In the United Kingdom, “a field of at least 120 degrees on the horizontal” and “no significant defect in the binocular field which encroaches within 20 degrees of fixation above or below the horizontal meridian” is required (Driver and Vehicle Licensing Agency, 2010).
Thirdly, the optic radiation often lies close to the epileptogenic zone. The most common surgical procedure for epilepsy, anterior temporal lobe resection, risks damaging Meyer’s loop of the optic radiation and work thus far has concentrated on this population. The size of resection and the distance from the tip of Meyer’s loop to the temporal pole as shown on DTI is predictive of the postoperative VFD (Yogarajah et al., 2009). Surgery for patients with more posterior lesions is performed less frequently, presurgical evaluation may be more complex, and surgery may result in a VFD involving the inferior field, which is more disabling than deficits involving the superior field.
Numerous methods have been published for the identification of the optic radiation. The majority rely on deterministic tractography algorithms, which are prone to errors in regions of crossing fibers and noise. Probabilistic tractography algorithms, which model the noise inherent in diffusion data and voxels with crossing fibres, are more resistant to such problems and can better delineate complex structures such as the tightly curving fibers of Meyer’s loop (Nilsson et al., 2010). The technique described herein is based on a previously published method designed to reliably identify Meyer’s loop in patients undergoing anterior temporal lobe resection (Yogarajah et al., 2009). However because Meyer’s loop represents only the superior part of the visual fields, it is important also to delineate fibers running directly posteriorly from the LGN. The inclusion of a second seed located in the LGN and the combination of the tractography data from the two seed regions by taking the maximum observed connection probability on a voxelwise basis allows a robust delineation of the entire optic radiation.
The visualization of the optic radiation on anatomic images and in 3D renderings with which the surgeon can interact allows a much better appreciation of the data and the relationship between structures. This can assist all stages of the surgical decision making process. Patients may be better informed about the risk of a VFD than when relying on anatomic imaging alone. This can help the decision of whether to pursue surgery and guide the procedure in those patients choosing to have an operation. A study of the utility of preoperative tractography in brain tumor resection showed that by providing information on the location of the corticospinal tract, optic radiation, and arcuate fasciculus, the surgical approach and/or resection margins were altered in 18 of 28 patients (Romano et al., 2009). In the present series, this was particularly true of Patients 1 and 2.
Because tractography is a relatively recent technique, further validation is necessary. The type of patient described in this series is uncommon, and although this is the largest such series reported to date, only limited postoperative data are available. The probabilistic tractography technique used is less likely to underestimate the size of the tract in comparison to the more common deterministic tractography, and it may still be necessary to add a further safety zone to allow for the limitations of tractography and a surgical margin of error. Such an allowance would also allow for the distortions introduced by the EPI sequence used for diffusion data, although this is less of an issue for lesions that are not at the temporal pole. We are investigating the validation of tractography results by other techniques, including visual-evoked potentials recorded from intracranial electrodes for those patients requiring invasive EEG monitoring prior to surgery.
Work is currently being undertaken in our group to enable preoperatively acquired tractography data to be available to the surgeon in real-time during surgery. A recently installed interventional MRI suite, in which scans can be performed during neurosurgery allows anatomic imaging to identify the completeness of resection. Successful modeling of the complex brain shift resulting from the craniotomy and surgical resection will allow the location of the optic radiation to be superimposed on the intraoperative anatomical imaging and incorporated into the neuronavigation suite. Tractography data could then be used prospectively to further reduce or avoid postoperative visual field deficits.
Acknowledgments
We are grateful to the radiographers at the Epilepsy Society MRI Unit, Philippa Bartlett, Jane Burdett, and Elaine Williams who scanned the patients and to all the patients for their kind participation. The project was funded by a Wellcome Trust Programme Grant (083148). GPW was supported by a Clinical Research Training Fellowship from the Medical Research Council (G0802012). We are grateful to the Big Lottery Fund, Wolfson Trust, and the Epilepsy Society for supporting the Epilepsy Society MRI scanner. This work was undertaken at UCLH/UCL, which received a proportion of funding from the Department of Health’s NIHR Biomedical Research Centres funding scheme.
Disclosures
John Duncan has received Institutional grant support from Eisai, UCB Pharma, GSK, Janssen Cilag, Medtronic, and GE Healthcare. Andrew McEvoy has received support from UCB, Baxter, and Cyberonics. The remaining authors have no conflicts of interest. We confirm that we have read the Journal’s position on issues involved in ethical publication and affirm that this report is consistent with those guidelines.
References
- Alexander DC, Barker GJ, Arridge SR. Detection and modeling of non-Gaussian apparent diffusion coefficient profiles in human brain data. Magn Reson Med. 2002;48:331–340. doi: 10.1002/mrm.10209. [DOI] [PubMed] [Google Scholar]
- Barton JJ, Hefter R, Chang B, Schomer D, Drislane F. The field defects of anterior temporal lobectomy: a quantitative reassessment of Meyer’s loop. Brain. 2005;128:2123–2133. doi: 10.1093/brain/awh544. [DOI] [PubMed] [Google Scholar]
- Basser PJ. Inferring microstructural features and the physiological state of tissues from diffusion-weighted images. NMR Biomed. 1995;8:333–344. doi: 10.1002/nbm.1940080707. [DOI] [PubMed] [Google Scholar]
- Cook PA, Alexander DC, Parker GJ. Proc. IEEE International Symposium on Biomedical Imaging. 2004. 335 pp. Modelling noise-induced fibre-orientation error in diffusion-tensor MRI, Piscataway, NJ, pp. 332–.
- Cook PA, Bai Y, Nedjati-Gilani S, Seunarine KK, Hall MG, Parker GJ, Alexander DC. 14th Scientific Meeting of the International Society for Magnetic Resonance in Medicine. 2006. Camino: open-source diffusion-MRI reconstruction and processing, Seattle, WA, USA, pp. 2759.
- Cook PA, Symms M, Boulby PA, Alexander DC. Optimal acquisition orders of diffusion-weighted MRI measurements. J Magn Reson Imaging. 2007;25:1051–1058. doi: 10.1002/jmri.20905. [DOI] [PubMed] [Google Scholar]
- Cushing H. Distortions of the visual fields in the case of brain tumours: the field defects produced by temporal lobe lesions. Trans Am Neurol Assoc. 1921;47:374–420. [Google Scholar]
- Driver and Vehicle Licensing Agency. At a glance. Guide to the current medical standards of fitness to drive. Driver and Vehicle Licensing Agency; 2010. , Swansea, U.K. Available at http://www.dft.gov.uk/dvla/~/media/pdf/medical/at_a_glance.ashx. [Google Scholar]
- Duncan JS. Imaging and epilepsy. Brain. 1997;120:339–377. doi: 10.1093/brain/120.2.339. [DOI] [PubMed] [Google Scholar]
- Duncan JS. Imaging in the surgical treatment of epilepsy. Nat Rev Neurol. 2010;6:537–550. doi: 10.1038/nrneurol.2010.131. [DOI] [PubMed] [Google Scholar]
- Ebeling U, Reulen HJ. Neurosurgical topography of the optic radiation in the temporal lobe. Acta Neurochir (Wien) 1988;92:29–36. doi: 10.1007/BF01401969. [DOI] [PubMed] [Google Scholar]
- Gilliam F, Kuzniecky R, Faught E, Black L, Carpenter G, Schrodt R. Patient-validated content of epilepsy-specific quality-of-life measurement. Epilepsia. 1997;38:233–236. doi: 10.1111/j.1528-1157.1997.tb01102.x. [DOI] [PubMed] [Google Scholar]
- Manji H, Plant GT. Epilepsy surgery, visual fields, and driving: a study of the visual field criteria for driving in patients after temporal lobe epilepsy surgery with a comparison of Goldmann and Esterman perimetry. J Neurol Neurosurg Psychiatry. 2000;68:80–82. doi: 10.1136/jnnp.68.1.80. [DOI] [PMC free article] [PubMed] [Google Scholar]
- Modat M, Ridgway GR, Taylor ZA, Lehmann M, Barnes J, Hawkes DJ, Fox NC, Ourselin S. Fast free-form deformation using graphics processing units. Comput Methods Programs Biomed. 2010;98:278–284. doi: 10.1016/j.cmpb.2009.09.002. [DOI] [PubMed] [Google Scholar]
- Mori S, van Zijl PC. Fiber tracking: principles and strategies – a technical review. NMR Biomed. 2002;15:468–480. doi: 10.1002/nbm.781. [DOI] [PubMed] [Google Scholar]
- Nilsson DT, Rydenhag B, Malmgren K, Starck G, Ljungberg M. Anatomical accuracy and feasibility of probabilistic and deterministic tractography of the optic radiation. Epilepsia. 2010;51(Suppl. 4):91. [Google Scholar]
- Parker GJ, Alexander DC. Probabilistic Monte Carlo based mapping of cerebral connections utilising whole-brain crossing fibre information. Inf Process Med Imaging. 2003;18:684–695. doi: 10.1007/978-3-540-45087-0_57. [DOI] [PubMed] [Google Scholar]
- Parker GJ, Haroon HA, Wheeler-Kingshott CA. A framework for a streamline-based probabilistic index of connectivity (PICo) using a structural interpretation of MRI diffusion measurements. J Magn Reson Imaging. 2003;18:242–254. doi: 10.1002/jmri.10350. [DOI] [PubMed] [Google Scholar]
- Romano A, D’Andrea G, Minniti G, Mastronardi L, Ferrante L, Fantozzi LM, Bozzao A. Pre-surgical planning and MR-tractography utility in brain tumour resection. Eur Radiol. 2009;19:2798–2808. doi: 10.1007/s00330-009-1483-6. [DOI] [PubMed] [Google Scholar]
- Roper SN. Surgical treatment of the extratemporal epilepsies. Epilepsia. 2009;50(Suppl. 8):69–74. doi: 10.1111/j.1528-1167.2009.02239.x. [DOI] [PubMed] [Google Scholar]
- Sander JW, Shorvon SD. Epidemiology of the epilepsies. J Neurol Neurosurg Psychiatry. 1996;61:433–443. doi: 10.1136/jnnp.61.5.433. [DOI] [PMC free article] [PubMed] [Google Scholar]
- Tecoma ES, Laxer KD, Barbaro NM, Plant GT. Frequency and characteristics of visual field deficits after surgery for mesial temporal sclerosis. Neurology. 1993;43:1235–1238. doi: 10.1212/wnl.43.6.1235. [DOI] [PubMed] [Google Scholar]
- Wheeler-Kingshott CA, Hickman SJ, Parker GJ, Ciccarelli O, Symms MR, Miller DH, Barker GJ. Investigating cervical spinal cord structure using axial diffusion tensor imaging. Neuroimage. 2002;16:93–102. doi: 10.1006/nimg.2001.1022. [DOI] [PubMed] [Google Scholar]
- Wiebe S, Blume WT, Girvin JP, Eliasziw M. A randomized, controlled trial of surgery for temporal-lobe epilepsy. N Engl J Med. 2001;345:311–318. doi: 10.1056/NEJM200108023450501. [DOI] [PubMed] [Google Scholar]
- Yogarajah M, Focke NK, Bonelli S, Cercignani M, Acheson J, Parker GJ, Alexander DC, McEvoy AW, Symms MR, Koepp MJ, Duncan JS. Defining Meyer’s loop – temporal lobe resections, visual field deficits and diffusion tensor tracto–graphy. Brain. 2009;132:1656–1668. doi: 10.1093/brain/awp114. [DOI] [PMC free article] [PubMed] [Google Scholar]