Abstract
The screen-film system is replaced by computed radiography system for recording the images of the patients during X-ray radiography examinations. The change in imaging system requires the re-establishment of the institutional diagnostic reference levels (DRLs) for different types of X-ray examinations conducted at the hospital. For this purpose, patient specific parameters [age, height, weight, body mass index (BMI), object to image distance (OID)] and machine specific parameters (kVp, mAs, distance and field sizes) of 1875 patients during 21 different types of X-ray examinations were recorded for estimating the entrance skin dose (ESD). The ESD for each of these patients were estimated using measured X-ray beam output and the standard value of the back scatter factor. Five number summary was calculated for all the data for their presentation in the Box-Whisker plot, which provides the statistical distribution of the data. The data collected indicates that majorly performed examinations are cervical spine AP, Chest PA and Knee Lat with percentage contributions of 16.05, 16 and 8.27% respectively. The lowest contribution comes from Hip Lat which is about 1.01%. The ratio of measured ESD (maximum to minimum) for these examinations is found to be highest for the cervical spine AP with a value of 50 followed by Thoracic spine AP of 32.36. The ESD ratio for Chest PA, Knee Lat and Lumbar Spine AP are 30.75, 30.4 and 30.2 respectively. The lowest ESD ratio is for Hip Lat which is 2.68. The third quartile values of ESDs are established as the institutional DRLs. The ESD values obtained for 21 different X-ray projections are either comparable or lesser than the reported national/international values.
Keywords: Patient dose, entrance skin dose, diagnostic reference level, computed radiography, CR imaging system, X-ray machine, X-ray imaging
Introduction
In diagnostic radiology, screen-film system is replaced by computed radiography system to incorporate the concept of filmless radiology practice.[1,2] Radiation doses resulting from X-ray examinations depend on the X-ray imaging technology and the exposure setting employed for recording the images on these imaging devices. The use of these imaging system seems to be growing rapidly due to their superiority over screen-film system such as linear dynamic range and digital image acquisition.[2,3] The X-ray imaging is the largest contributor to population dose because a large number of X-ray examinations are conducted every year globally.[4] Patient dose measurements play a very important role in X-ray imaging as it helps in estimation of realistic radiation dose to patients and by doing so one can set up the institutional diagnostic reference levels (DRLs). When this study is conducted at all the medical institutions across the country, it leads to the establishment of the national DRLs. International Basic Safety Standards (BSS) for Protection against Ionizing Radiation and for the Safety of Radiation Sources published by the International Atomic Energy Agency (IAEA) in 1996 recommended the establishment of Dose Guidance Levels (DGLs/DRLs) for medical exposures to ensure protection of the patients and maintain appropriate level of good practice.[5] DRLs determined using the third quartile value (the 75th percentile value of the ESD distribution for a given projection) is a well-established technique and in the present study this concept has been incorporated in establishing the DRLs for a number of diagnostic projections.[6] Recording of patient doses in medical X-ray examinations is not a routine procedure in India. However, several attempts have been made in this direction at national level by measuring the patient doses using different methodologies.[7,8,9,10]
The technique factors specific to X-ray technology and patient parameters mainly affect the patient doses and image quality. The patient dose resulting from an X-ray examination depends on a number of parameters such as energy of the X-ray beam, beam current, exposure duration, type of image recording system, technique of examination and the type of X-ray generator.[9] Therefore, it is necessary to record these parameters while measuring the doses using indirect methodology. Several studies reported the wide variations in patient dose levels e.g. up to a factor of 100 for the same X-ray examination.[11,12] A study carried out in the Irish hospitals has shown that the measured ESD values for individual patients varied up to a factor of 75 for the Lumbar spine AP examination.[13] In view of this, international organizations have recommended the use of DRLs in diagnostic radiology.[14] Radiation doses of patients were measured during various X-ray examinations routinely carried out using CR imaging system in our hospital. This paper reports the statistical analysis of the measured dose data and the institutional DRLs established for the CR based X-ray imaging system.
Materials and Methods
This study analyzed the dose data of 1875 patients who have undergone 21 different types of X-ray examinations using CR based X-ray imaging system at our hospital. The X-ray machine employed in this study do not have AEC (automatic exposure control) system and all the machine parameters were selected manually while examining the patient. For the ease in representing the data within available space, 21 different types of X-ray examinations have been indicated by capital letters B to V rather than indicating the full name of a given examination. The radiation beam output of the machine (mGy) in air was measured using Si PIN photodiode based radiation dosimeter by varying the exposure parameters. The exposure parameters (kVp, mAs, focus to skin distance, field sizes) and physical parameters [age, height, weight, body mass index (BMI), object to image distance (OID)] of these patients were recorded. The entrance skin doses (ESDs) of these patients involving 21 different types of radiographic examinations were estimated using exposure parameters and the standard value of the back scatter factor. Five number summary was used to plot the Box-Whisker plot. A box plot contains a central rectangle (box) with lines (whiskers) that extend from both ends and it provides the information about the smallest value, first quartile (Q1), median (or second quartile, Q2), third quartile (Q3), and the largest value.
Imaging system
The patient dose data were measured for those patients who were examined by Shimadzu Flexi Vision X-ray machine (Shimadzu Medical India Pvt. Ltd. Mumbai, India) of our hospital. The X-ray machine uses a high frequency generator with low ripple factor. Fuji computed radiography (CR) plate was used as image recording system in the X-ray examinations. Fuji FCR computed radiography system (Fujifilm India Pvt. Ltd. Gurgaon, India) was used for read out of the CR cassettes, image recording, display and analysis. For measurement of the radiation output and QA test parameters of the X-ray machine we have used the Si PIN photodiode based radiation dosimeter (Piranha, RTI, Sweden). This dosimeter is having kVp measuring range from 35–125 kVp with an accuracy of ±1.5% and dose measuring range from 15 nGy to 1000 Gy with an accuracy of ±5% in radiography mode.
Quality assurance
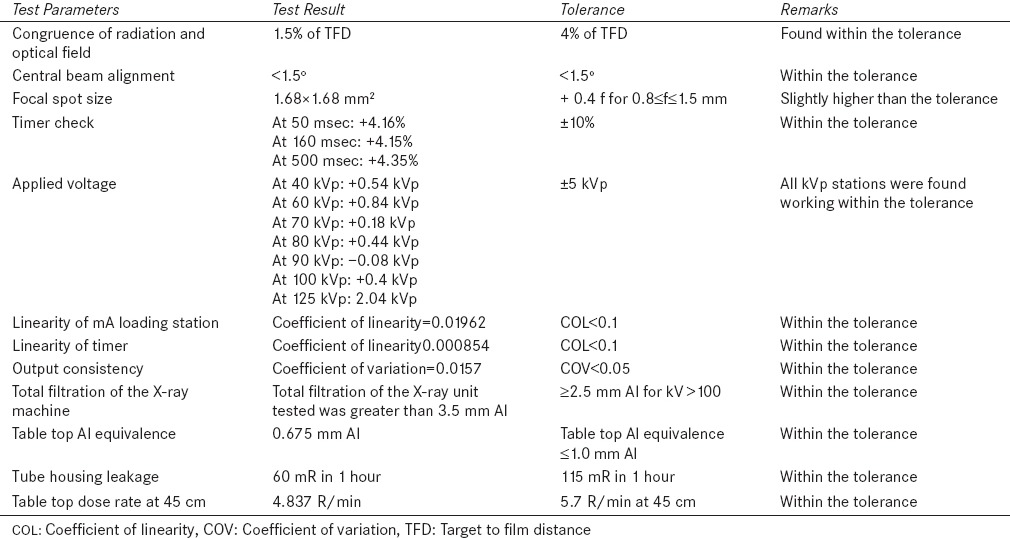
Before initiating the patient dose studies on the X-ray machine, comprehensive quality assurance (QA) tests were carried out on it. Also the QA tests were repeated on quarterly basis for the period of two years while collecting the patient dose data for this study. The details of QA test parameters and their tolerance values are listed in Table 1. As can be seen from this table several performance parameters of the X-ray machine such as kVp accuracy, mA and timer linearity, output consistency, beam alignment, congruence of optical and radiation fields, half value layer (HVL) and spatial image resolution were periodically evaluated during the course of this study.
Table 1.
QA test parameters measured for the X-ray machine used during the course of the present study
Patient and machine specific parameters
As the patient dosimetry measurement should be performed in realistic conditions, it was important to record the patient related parameters. The patient related parameters such as body thickness, OID (object to image distance in cm) along the central beam axis for the part of the body which was under examination, Age (years), height (m), Weight (kg), BMI = [Weight (kg)/Height2 (m)] were recorded for all the patients.
ESD measurement relies on the technical parameters selected on X-ray machine for examining the patient in each radiography examinations. Therefore machine specific parameters such as tube voltage (kVp), the tube current (mA), Exposure time (msec), Focus to skin distance (FSD in cm), Field size (both X and Y direction in cms) for all 1875 adult patients were recorded.
Estimation of ESD
ESD for a given X-ray examination was calculated using the following equation

where, FDD is focus to detector distance (cm), FSD is focus to skin distance (cm) and BSF is the back scatter factor.
Output of the X-ray machine in terms of mGy was measured using Si PIN photodiode based detector at various kVp settings ranging from 40–125 kVp at an increment of 10 kVp and fixed value of 20 mAs. All the measurements were carried out at fixed focus to detector distance of 100 cm (FDD = d = 100 cm). It is well known that output of the X-ray machine can be given by the following equation

Where, K is the slope of the curve plotted between mGy/mAs and kVp2 at a fixed d (100 cm). The value of ‘n’ (power of kVp) depends on the type of generator used in X-ray machine. Measured output values at 80 and 120 kVp and corresponding exposure parameters were used to estimate the value of ‘n’ using equation 2. On solving two equations for the output at 80 and 120 kVp, we get n = 2.0 for the medical X-ray machine used in this work.
The backscatter factor mainly depends upon the field size, OID and kVp used.[14] The backscatter factor value ranges from 1.2–1.4 corresponding to the different X-ray spectra and beam sizes used.[15] In the present study, backscatter factor of 1.4 was taken as beam energy (clinical kVp) was ranging from 40 to 100 kVp for all the radiographic examinations.[14]
The ESD was calculated for each and every X-ray examinations carried out on the patient by using appropriate values of the parameters given in equation 1.
Results and Discussion
Figure 1 shows the variation of X-ray machine output (mGy/mAs) at various kVp settings ranging from 40–125 kVp at an increment of 10 kVp and 20 mAs at a fixed FDD of 100 cm. Table 2 shows the range of values of patient and machine specific parameters recorded for 1875 patients during 21x-ray projections. It is observed from Table 2 that patient specific parameters [age = 18-87 years, height = 1.25–1.94 meter, weight =34–106 kg, BMI = 15.55–36.26 kg/m2 and OID = 3.5–66 cm] as well as the machine specific parameters [beam energy =40–91 kVp, product of beam current and time = 4–250 mAs, exposure time = 8–900 msec, and FSD = 62–212 cm] have a wide variability to represent a suitable sample size for establishing the institutional DRLs. Figure 2 presents the relative contribution of different X-ray examinations conducted at our hospital. It is observed here that majorly performed X-ray examinations of our hospital are cervical spine AP, Chest PA and Knee Lat with percentage contributions of 16.05, 16 and 8.27% respectively. However, the lowest contribution comes from Hip Lat which is about 1.01%.
Figure 1.
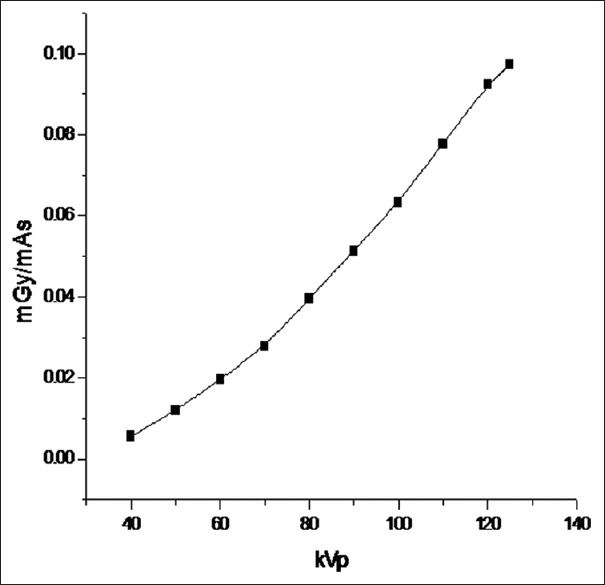
Output (mGy/mAs) of the X-ray machine measured at different kVp stations
Table 2.
Range of values of the patient specific and machine specific parameters of the 21 different types of radiography projections
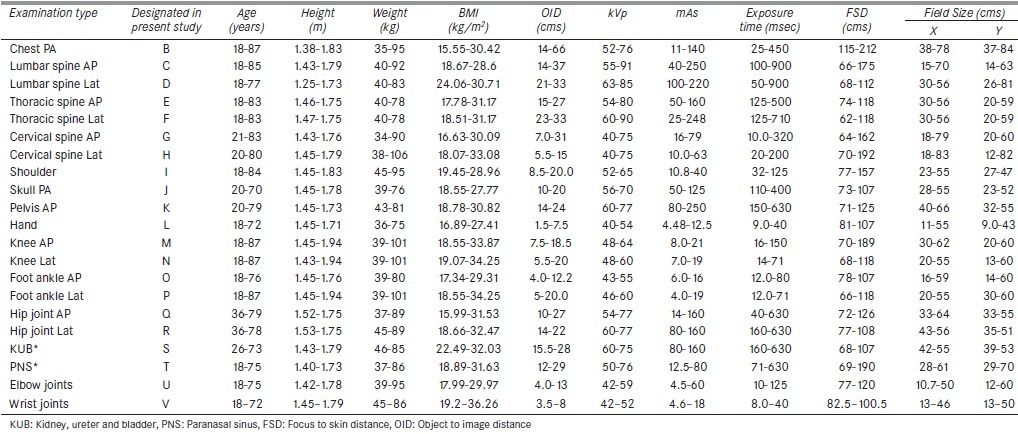
Figure 2.
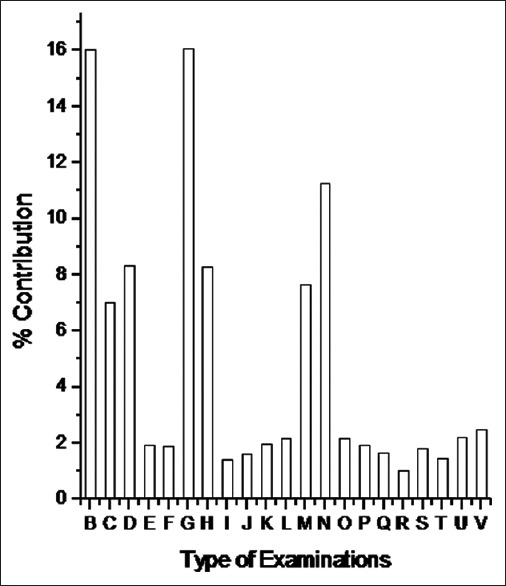
Percentage contribution for 21 X-ray examinations performed in the hospital
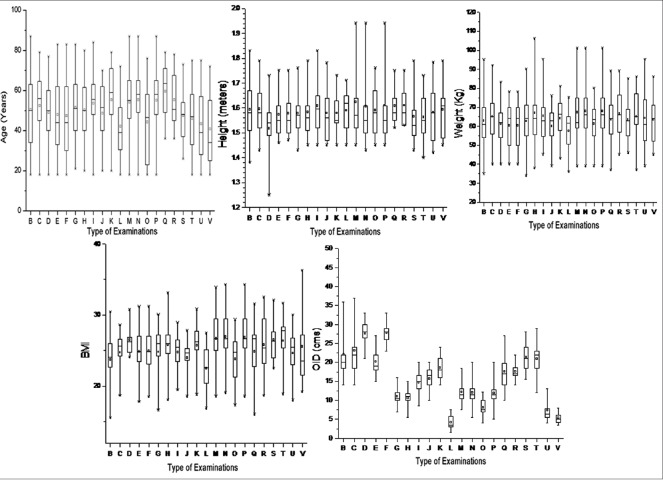
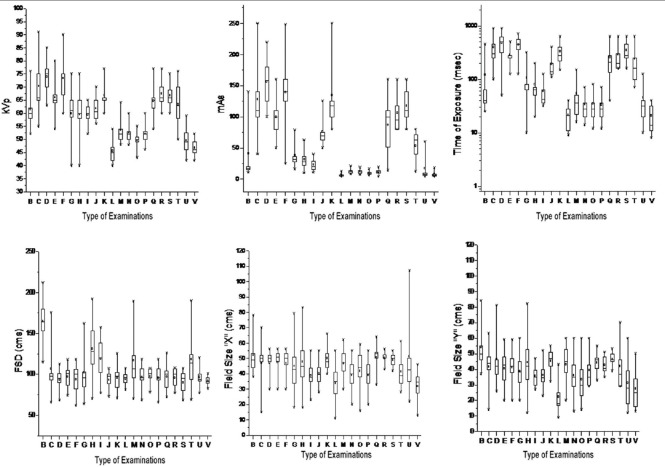
Table 3 shows the ratio of measured maximum ESD to minimum ESD for 21 different types of X-ray examinations. The maximum value of this ratio is 50 for cervical spine AP and the minimum value is 2.68 for the Hip joint Lateral. This ratio for Thoracic Spine AP, Chest PA, Knee Lat and Lumbar Spine AP are 32.36, 30.75, 30.4 and 30.2 respectively. The reason for the wide variation in the ratio of maximum ESD to minimum ESD is multifactorial which includes variation in patient body thickness and operator specific selection of exposure technique and exposure parameters. Figure 3 shows the Box and Whisker plot for the measured patient specific parameters [age (year), height (meter), weight (kg), BMI (kg/m2) and OID (cm)] for all the 21 X-ray examinations. Figure 4 shows the Box and Whisker plot for the measured X-ray machine parameters which are kVp, mAs, Time, FSD and field sizes used to radiograph the 1875 patients. Figure 5 shows the Box and Whisker plot for the measured ESDs in the present study. These figures are based upon the five number summaries as explained earlier.
Table 3.
Statistical distribution of ESD values measured for 21 different types of radiography projections
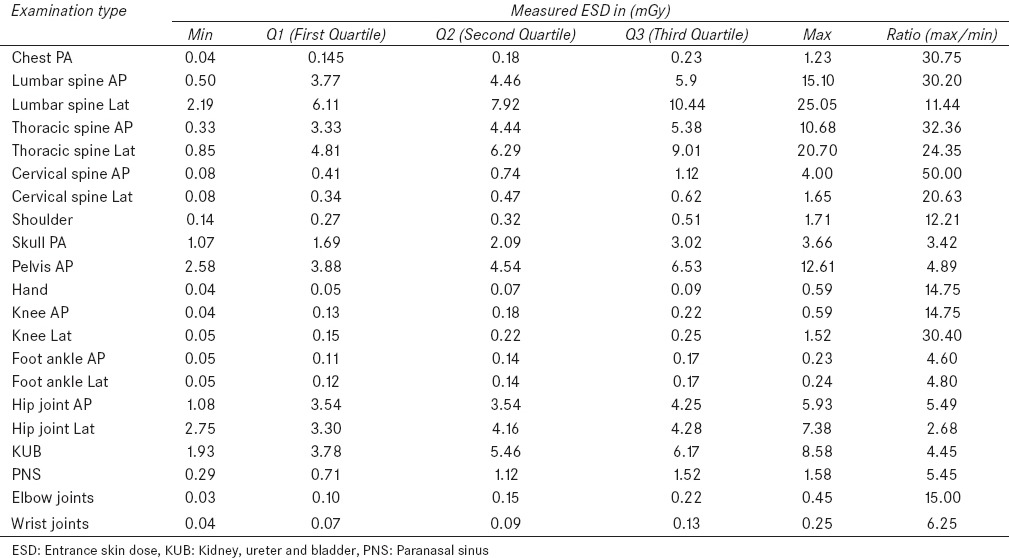
Figure 3.
The Box and Whisker plot for patient specific parameters measured for 21 X-ray projections
Figure 4.
The Box and Whisker plot for X-ray machine parameters employed for 21 X-ray projections
Figure 5.
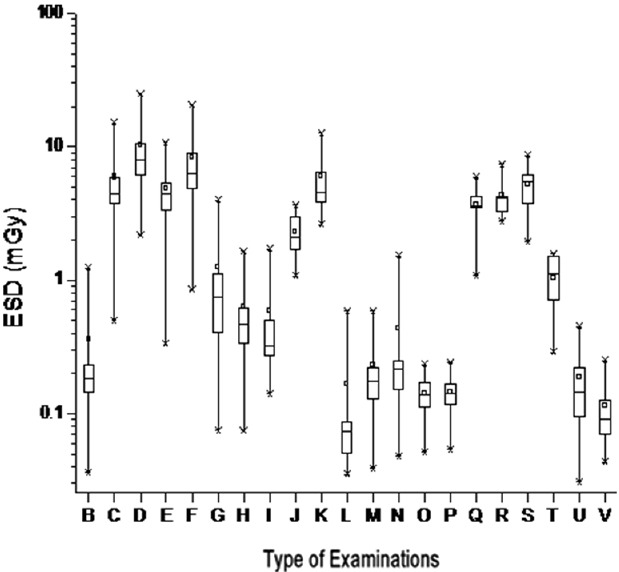
The Box and Whisker plot for measured ESDs of 21 different types of X-ray projections
Table 4 presents the third quartile data distribution of the present study which indicates that the age, height and weight of the patients studied lie between 51.5–71 years, 1.58–1.67 meter and 65–77 kg respectively for all 21X-ray projections. BMI ranges from 25.1–29.5 kg/m2 and OID range is 5.75–30 cm. In case of machine parameters selected for all the 21X-ray examinations, the third quartile values for the applied kVp ranges from 47–77 kVp. For mAs it ranges from 7.05–180 and for the time of exposure it ranges from 28–630 msec. The third quartile value of FSD ranges from 96–180 cm and the filed sizes in X and Y directions ranges from 38–55 and 25–55 cm respectively. The third quartile value of the measured ESD ranges from 0.09–10.44 mGy for all the 21X-ray examinations.
Table 4.
Measured third quartile value (75th percentile) related to patient, machine parameters and ESD for 21 different types of radiographic examinations
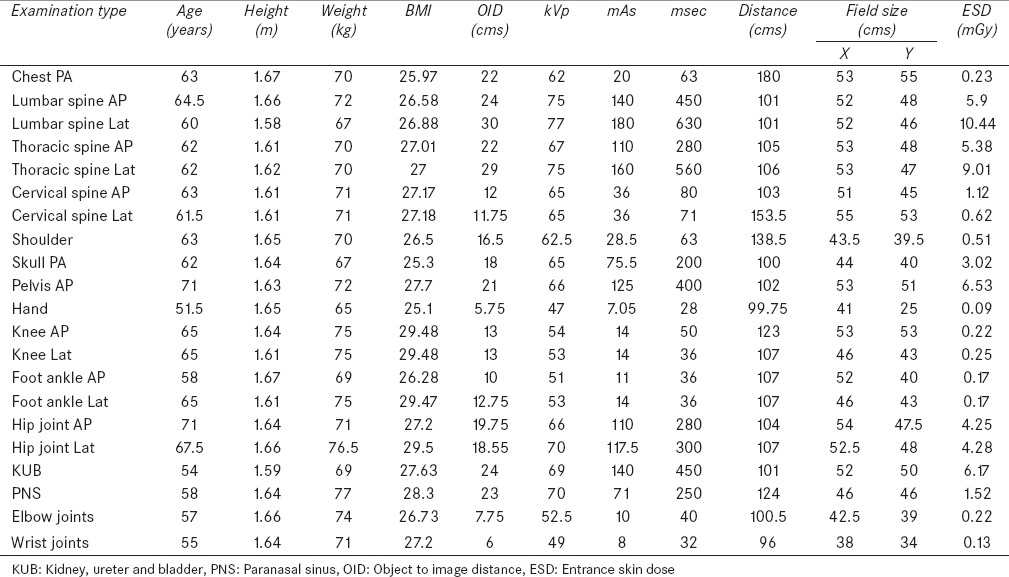
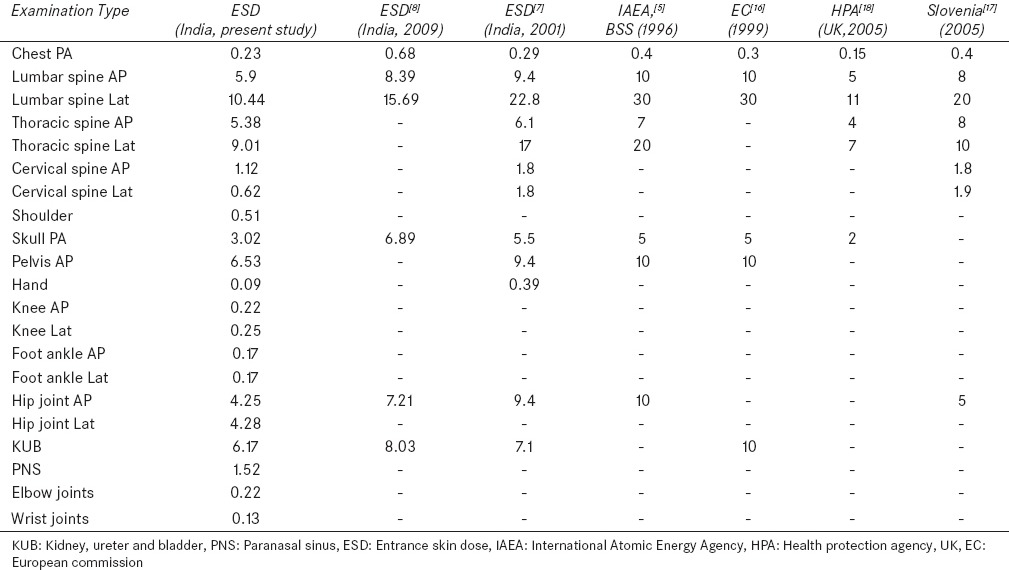
Table 5 presents the third quartile value of the measured patient dose distribution for 21 X-ray radiography projections and its comparison with the established national and international DRLs by the different agencies worldover. In this comparision, the ESD values obtained for 21 X-ray projections are found to be comparable or lesser than the earlier established values.[7,8,16,17,18] This may be due to the fact that the present ESD values are derived for CR imaging system which comprises a recent model of diagnostic X-ray machine as exposure device and photostimulable phosphor (PSP) plate as image recording device while other DRLs are based on a variety of X-ray machines and screen-film as imaging recording system. The third quartile ESD value measured for X-ray projection of Cervical Spine Lat are lesser than the cervical spine AP which is in contrast to the results reported for Slovenia.[17] The main reason for the contrasting observation in case of cervical spine is the difference in FSD used for these examinations in our study [Table 4]. Although the third quartile value for used kVp and mAs are the same for these two examinations but the FSD used for Cervical Spine Lat is 153.5 cm and for Cervical Spine AP it is only 103 cm.
Table 5.
Comparison of measured ESD (mGy) values (75th percentile) with established DRLs at national and international levels
Conclusions
The entrance surface dose values for 1875 patients who have undergone 21 different types of X-ray examinations using CR based X-ray imaging system were estimated using indirect patient dose estimation method. The data so acquired show the large variation in the measured ESD values. The reason for large variation in ESD was multifactorial that is variation in patient body thickness and operator specific selection of exposure technique and parameters. The 3rd quartile values of the ESDs were recommended as the institutional DRLs for different diagnostic projections. The variation in make and model of the diagnostic X-ray machine is excluded in this study as only a single machine was used for examining all the patients. Considering this large variation in the ESD values it is recommended that every hospital should prepare a technique chart for various X-ray projections specific to the X-ray machine so that machine set parameters and X-ray technician variability can be excluded. Also the collected patient information is significant as this information can be very useful while modeling the patient dose studies theoretically.
Acknowledgment
Authors wish to express their gratitude to Dr. D.N. Sharma, Director, Health, Safety and Environment Group (HS and EG), Bhabha Atomic Research Centre, Mumbai for his encouragement and support.
Footnotes
Source of Support: Nil
Conflict of Interest: None declared.
References
- 1.Lu ZF, Nickoloff EL, So JC, Dutta AK. Comparison of computed radiography and film screen combination using a contrast-detail phantom. J Appl Clin Med Phys. 2003;4:91–8. doi: 10.1120/jacmp.v4i1.2548. [DOI] [PMC free article] [PubMed] [Google Scholar]
- 2.Rowlands JA. The physics of computed radiography. Phys Med Biol. 2002;47:R123–66. doi: 10.1088/0031-9155/47/23/201. [DOI] [PubMed] [Google Scholar]
- 3.Aldrich JE, Duran E, Dunlop P, Mayo JR. Optimization of dose and image quality for computed radiography and digital radiography. J Digit Imaging. 2006;19:126–31. doi: 10.1007/s10278-006-9944-9. [DOI] [PMC free article] [PubMed] [Google Scholar]
- 4.United Nations scientific committee on the effects of atomic radiation. Sources and effects of ionizing radiation. UNSCEAR Report. 2008 [Google Scholar]
- 5.International Atomic Energy Agency. International Basic Safety Standards for protection against ionizing radiation and for the safety of radiation sources. IAEA Safety Series No. 115. Vienna. 1996 [Google Scholar]
- 6.Ng KH, Rassiah P, Wang HB, Hambali AS, Muthuvellu P, Lee HP. Doses to patients in routine X-ray examinations in Malaysia. Br J Radiol. 1998;71:654–60. doi: 10.1259/bjr.71.846.9849390. [DOI] [PubMed] [Google Scholar]
- 7.Sasane JB, Sawant SG, Shirva VK. Patient exposure from diagnostic radiological procedures in India. Proceedings of the IAEA International Conference on Radiological Protection of Patients in Diagnostic and Interventional Radiology, Nuclear Medicine and Radiotherapy, Malaga, Spain. 2001:424–8. [Google Scholar]
- 8.Sonawane AU, Shirva VK, Pradhan AS. Estimation of skin entrance doses (SEDs) for common medical X-ray diagnostic examinations in India and proposed diagnostic reference levels (DRLs) Radiat Prot Dosimetry. 2009;138:129–36. doi: 10.1093/rpd/ncp235. [DOI] [PubMed] [Google Scholar]
- 9.Sharma SD, Sharma R, Mulchandani U, Chaubey A, Chourasia G, Mayya YS. Measurement of entrance skin dose for diagnostic X-ray radiographic examinations and establishment of local diagnostic reference levels. In: Long M, editor. World Congress on Medical Physics and Biomedical Engineering. IFMBE Proceedings. Vol. 39. 2012. pp. 860–63. [Google Scholar]
- 10.Sharma R. Entrance surface doses in majorly performed diagnostic X-ray examinations. J Med Phys. 2006;31:123–4. [Google Scholar]
- 11.Shrimpton PC, Wall BF, Jones DG, Fisher ES, Hillier MC, Kendall GM. London: NRPB-R200; 1986. A national survey of doses to patients undergoing a selection of routine X-ray examinations in English hospitals. [DOI] [PubMed] [Google Scholar]
- 12.Faulkner K, Corbett RH. Reference doses and image quality in medical imaging. Br J Radiol. 1998;71:1001–2. doi: 10.1259/bjr.71.850.10211057. [DOI] [PubMed] [Google Scholar]
- 13.Johnston DA, Brennan PC. Reference dose levels for patients undergoing common diagnostic X-ray examinations in Irish hospitals. Br J Radiol. 2000;73:396–402. doi: 10.1259/bjr.73.868.10844865. [DOI] [PubMed] [Google Scholar]
- 14.Oxford: Pergamon Press; 1990. International commission on radiological protection. ICRP 60. [Google Scholar]
- 15.Petoussi-Henss N, Zankl M, Drexler G, Panzer W, Regulla D. Calculation of backscatter factors for diagnostic radiology using Monte Carlo methods. Phys Med Biol. 1998;43:2237–50. doi: 10.1088/0031-9155/43/8/017. [DOI] [PubMed] [Google Scholar]
- 16.European Commission Guidance on diagnostic reference levels (DRLs) for medical exposures, Report of Directorate General of Environment, Nuclear Safety and Civil Protection. Radiat Prot. 1999;109:14–5. [Google Scholar]
- 17.Damijan K. Diagnostic reference levels for X-ray examinations in Slovenia. Radiol Oncol. 2006;40:189–95. [Google Scholar]
- 18.Hart D, Miller MC, Wall BF. Doses to patients from radiographic and fluoroscopic x-rat imaging procedures in the U.K.-2005 review, HPA-RPD-029. 2007 [Google Scholar]


