

Abstract
Objectives
To determine if combined measurements from dynamic contrast enhanced magnetic resonance imaging (DCE-MRI) and diffusion weighted MRI (DW-MRI), obtained before and after the first cycle of neoadjuvant chemotherapy (NAC), are superior to single parameter measurements for predicting pathological complete response (pCR) in breast cancer patients.
Materials and Methods
Patients with Stage II/III breast cancer were enrolled in an IRB-approved study in which 3T DCE- and DW-MRI data were acquired before (n = 37) and after one cycle (n = 33) of NAC. Estimates of Ktrans, ve, vp, and kep (= Ktrans/ve) were generated from the DCE-MRI data using the Extended Tofts-Kety (ETK) model. The apparent diffusion coefficient (ADC) was estimated from the DW-MRI data. The derived parameter kep/ADC was compared to single parameter measurements for its ability to predict pCR after the first cycle of NAC.
Results
kep/ADC after the first cycle of NAC discriminated patients who went on to achieve a pCR (P < 0.001), and achieved a sensitivity, specificity, positive predictive value, and area under the receiver operator curve (AUC) of 0.92, 0.75, 0.69, and 0.86, respectively. These values were superior to the single parameters kep (AUC = 0.77) and ADC (AUC = 0.81). The AUCs between kep/ADC and kep were significantly different based on the bootstrapped 95% CIs (0.0062, 0.20), while the AUCs between kep/ADC and ADC trended towards significance (−0.12, 0.24).
Conclusions
A combined analysis of DCE-MRI and DW-MRI parameters was superior to single-parameter measurements for predicting pCR after the first cycle of NAC.
Keywords: Combined DCE- and DW-MRI, breast cancer, treatment response
INTRODUCTION
Dynamic contrast enhanced magnetic resonance imaging (DCE-MRI) and diffusion weighted MRI (DW-MRI) have matured to the point where they are able to provide quantitative, and complimentary information on tumor status (1). DCE-MRI involves the serial acquisition of T1-weighted MR images of a tissue of interest before and after an intravenous injection of a paramagnetic contrast agent (CA). As the CA accumulates and then is eliminated, it changes the native relaxation rate of tissue water, and therefore the measured MR signal intensity. By fitting the resulting signal intensity time course to an appropriate pharmacokinetic model, physiological parameters can be extracted that relate to the volume transfer rate (Ktrans, related to tissue perfusion and permeability), blood plasma volume fraction (vp), extravascular extracellular volume fraction (ve), and the efflux rate constant (kep = Ktrans/ve). DW-MRI allows for the in vivo measurement of the motion of water in tissue. By applying two or more diffusion-sensitizing gradients with different amplitudes, the apparent diffusion coefficient (ADC) can be estimated from the resulting DW-MRI data to describe the rate of water diffusion in cellular tissues. In well-controlled studies it has been shown that the ADC varies inversely with cell (2).
There have been many efforts employing DCE-MRI as a surrogate biomarker for assessing and predicting the response of breast tumors to neoadjuvant chemotherapy (3-9). For example, Ah-See et al (7) calculated the changes in pharmacokinetic parameters estimated from DCE-MRI data before and after two cycles of treatment and reported that change in Ktrans was the best predictor of pathologic non-response, while Padhani et al (8) found both tumor size and change in the range of histograms in Ktrans after two cycles of treatment were equally able to predict eventual response. There also have been studies investigating DW-MRI and some have found that the ADC is able to separate responders from non-responders after neoadjuvant chemotherapy (9-11), while some other studies showed that there is no correlation between ADC and treatment response (12,13). In some recent studies (6,14,15), both DCE- and DW-MRI data have been evaluated. However, those previous studies reported the ability of both data to monitor or assess treatment response separately and did not show the performance of the combination of DCE- and DW-MRI. The objective of this study was to determine if a multiparametric combination of DCE- and DW-MRI data can increase accuracy for predicting pathologic complete response (pCR) in breast cancer patients undergoing neoadjuvant chemotherapy. In particular, we hypothesized that the derived measurement kep/ADC would have superior predictive accuracy than single parameter measurements in isolation. The eventual clinical goal is to be able to predict, after the first cycle of neoadjuvant chemotherapy, which patients will go on to achieve pCR.
METHODS
Patient Eligibility and Enrollment
Patients undergoing NAC for locally advanced breast cancer were eligible for this prospective, IRB-approved study. All patients had histologically documented invasive breast cancer at least 1 cm in the longest dimension with a sufficient risk of recurrence, based on pre-treatment clinical parameters of size, grade, age and nodal status, to warrant the use of NAC. Patients provided written informed consent before participating in this study.
Schema
MRI was performed prior to initiating chemotherapy (t1), after one cycle (t2), and after all cycles (t3) of chemotherapy. The NAC regimen was left to the discretion of the treating oncologist based on patient factors such as menopausal status and age as well as tumor characteristics, including size, grade, nodal status and receptor status.
Pathologic Assessment of Response
pCR was defined as the absence of any invasive cancer in breast or lymph nodes. Patients with any residual invasive cancer in the breast or lymph nodes or patients who progressed prior to surgery were defined as non responders (non-pCR). Determination of pCR and non-pCR status was determined at the time of definitive surgery by a breast pathologist.
MRI Data Acquisition
MRI examinations were performed on a Philips 3T Achieva MR scanner (Philips Healthcare, Best, The Netherlands) and included both DCE-MRI and DW-MRI acquisitions. Prior to the DCE-MRI acquisition, data for constructing a T1 map were acquired with an RF-spoiled 3D gradient echo multi-flip angle approach with ten flip angles from 2 to 20 degrees in 2° increments. For both the T1 map and DCE scans, TR = 7.9 ms, TE = 4.6 ms, and the acquisition matrix was 192×192×20 (full-breast) over a sagittal square field of view (22 cm2) with slice thickness of 5 mm. The flip angle for DCE scans was 20 degrees. For the DCE study, each 20-slice set was collected in 16 seconds at 25 time points for just under seven minutes of dynamic scanning. A catheter placed within an antecubital vein delivered 0.1 mmol/kg (9 – 15 mL, depending on patient weight) of gadopentetate dimeglumine, Gd-DTPA, (Magnevist, Wayne, NJ) at 2 mL/sec (followed by a saline flush) via a power injector (Medrad, Warrendale, PA) after the acquisition of the first three dynamic scans (baseline).
DW-MRI was acquired with a single-shot spin echo (SE) echo planar imaging (EPI) sequence in three orthogonal diffusion encoding directions (x, y, and z). For 14 patients, b = 0 and 500 s/mm2, TR/TE = 2500 ms/45 ms, Δ = 21.4 ms, δ = 10.3 ms and 10 signal acquisitions were acquired. For 19 patients, b = 0 and 600 s/mm2, TR/TE = “shortest” (range = 1800 - 3083 ms/43 - 60 ms) Δ = 20.7 - 29 ms, δ = 11.4 - 21 ms and 10 signal acquisitions were acquired. For four patients, b = 50 and 600 s/mm2 for two patients), TR/TE = “shortest” (range = 1840 - 3593 ms/43 - 60 ms) Δ = 20.6 - 29 ms, δ = 11.5 - 21 ms and 10 signal acquisitions were acquired. The acquisition matrix was 144×144×12 over a (19.2 cm2) field of view with a slice thickness of 5 mm and was obtained in 4 minutes and 40 seconds.
We note that subsets of this patient cohort have been included in a number of previous publications which focused on technical DCE-MRI or DW-MRI data acquisition methods ((16-22), and integrating such data into a predictive mathematical model of tumor growth ((23)).
Quantitative Image Analysis
For each patient at each time point, a region of interest (ROI) was manually drawn to completely surround the enhancing tumor as seen on each DCE-MRI tumor slice. The tumor was then defined as the voxels in each ROI displaying a signal intensity increase of greater than 80% after contrast injection. The threshold was calculated as , where is the averaged post-contrast signal intensity and is the average of the three pre-contrast time points. The threshold of 80% was selected as, in a previous study, it yielded the largest concordance correlation coefficient between the longest dimension of the tumor measured on the surgical specimen and the longest dimension measured on the DCE-MRI data just prior to surgery as reported previously (16). The DW-MRI data was rigidly registered (24) to the DCE-MRI data and the tumor ROIs as defined on the DCE-MRI data were then copied to the registered DW-MRI data so that tumor voxels on both data sets were co-aligned.
The Extended Tofts-Kety model (ETK) was used to estimate four physiological parameters from the DCE-MRI data: the volume transfer rate (Ktrans), blood volume fraction (vp), extravascular extracellular volume fraction (ve), and the efflux rate constant (kep = Ktrans/ve). The arterial input function (AIF) was a population-averaged AIF constructed from 50 individual AIFs obtained through a semi-automatic AIF tracking algorithm (25). Voxels for which the ETK model did not converge, or converged to non-physical values (i.e., Ktrans > 5.0 min−1, ve > 1.0, vp > 1.0, or any parameter below 0.0) were set equal to zero and not included in subsequent analyses.
ADC maps were calculated with the following equation: ADC = ln(S1/S2)/(b2 – b1), where S1 and S2 denote the signal acquired with b-values of b1 and b2, respectively. Voxels for which the model could not fit the data or converged to non-physical values (i.e., ADC > 3.0 × 10⁻³ mm2/s or ADC < 0.01 × 10⁻³ mm2/s) were set to zero and not included in subsequent analyses.
At the first two time points, longest dimension (LD), mean DCE-MRI parameters, and mean ADC values were computed for each patient and the changes of each parameter between t1 and t2 were calculated. The mean and change of the derived parameter kep/ADC were also obtained. The LD was measured from the tumor ROI estimated from the DCE-MRI data; for each slice with tumor voxels, the distance between any two voxels was calculated and the maximum distance in all slices was determined as the LD.
Statistical Analysis
All statistical analyses were performed using MATLAB R2012a (The Mathworks, Natick, MA). Receiver operator characteristic (ROC) curve analysis was performed to test the ability of each single parameter measurement as well as the derived parameter kep/ADC to predict pCR (26). “Optimal” cut-off points, sensitivities, specificities, and positive predictive values (PPV) were calculated to satisfy the Youden index; i.e., the point on the ROC curve that is furthest from chance and minimizes the overall rate of misclassification (27). The areas under the curve (AUC) were estimated using the trapezoidal rule. The non-parametric Wilcoxon rank sums test (28) was also used to detect if the parameters between the two response groups were significantly different.
To investigate if the AUC of kep/ADC was significantly different from the AUC of kep or ADC, the bootstrap method (29) was performed to generate the differences in AUC between kep/ADC and kep, and between kep/ADC and ADC with 1,000 replicates. The bootstrapped 95% confidence intervals (CI) for the AUC differences were then estimated.
RESULTS
Patient and Tumor Characteristics
Thirty-seven patients completed scanning at t1 and 33 patients completed scanning at t2. The median age of the patients was 45 years old (range, 28 – 67 years). The median time between t1 and t2 was 14 days (range, 7 – 29 days). The median time between the first cycle of treatment administration and the post-1 cycle MRI was 1 day (range, 0 – 11 days). Table 1 summarizes the salient features of the study population, the receptor status, and the corresponding treatment regimens for all patients.
Table 1.
Clinical features of the study population.
| Patient # |
Age (yr) |
Treatment Regimens | Receptor status |
Tumor grade |
Excised tumor size |
Pathologic response |
Surgery | ||
|---|---|---|---|---|---|---|---|---|---|
| ER | PR | HER2 | |||||||
| 1 | 50 | dd AC × 4 → Taxol × 12 | + | + | − | 3 | 0.5 | Residual disease | mastectomy |
| 2 | 52 | dd Taxotere × 4 | + | − | + | 3 | 1.5 | Residual disease | mastectomy |
| 3 | 60 | dd AC × 2 → Taxol-Herceptin × 12 | + | + | + | 1 | 2.9 | Residual disease | mastectomy |
| 4 | 36 | cisplatin/taxol +/− RAD001 × 12 | − | − | − | 2 | 2.9 | Residual disease | mastectomy |
| 5 | 48 | dd AC × 4 → Taxol × 4 | + | + | − | 1 | 1.3 | Residual disease | mastectomy |
| 6 | 43 | dd AC × 4 → Taxol × 4 | + | + | − | 2 | 2.6 | Residual disease | mastectomy |
| 7 | 59 | dd AC × 4 → Taxol × 4 | + | + | − | 2 | 4.2 | Residual disease | mastectomy |
| 8 | 53 | cisplatin/taxol +/− RAD001 × 12 | − | − | − | 2 | 1.3 | Residual disease | mastectomy |
| 9 | 35 | Trastuzumab +Carboplatin+ Ixabepilone × 6 |
+ | + | + | 3 | 1.4 | Residual disease | mastectomy |
| 10 | 28 | cisplatin/taxol +/− RAD001 × 12 | − | − | − | 3 | 0.8 | Residual disease | mastectomy |
| 11 | 33 | AC × 4 → Taxol × 12 | + | + | − | 3 | 1.2 | Residual disease | mastectomy |
| 12 | 39 | AC × 4 → Taxol × 12 | + | + | − | 1 | 2.5 | Residual disease | mastectomy |
| 13 | 57 | AC × 4 → Taxol × 12 | − | − | − | 3 | N/AΔ | Residual disease | progressed with brain mets |
| 14 | 67 | AC × 4 → Taxol/Herceptin × 12 | − | − | + | 3 | 1.8 | Residual disease | mastectomy |
| 15 | 45 | cisplatin/taxol +/− RAD001 × 12 | − | − | − | 3 | 0.5 | Residual disease | mastectomy |
| 16 | 46 | Taxotere/Carboplatin/Herceptin × 6 | + | + | + | 3 | 0.3 | Residual disease | mastectomy |
| 17 | 47 | Taxotere × 3 →dd AC × 4 | + | + | − | 1 | 8.0 | Residual disease | mastectomy |
| 18 | 36 | ddAC × 4 → Taxol × 12 | + | + | + | 2 | 1.0 | Residual disease | mastectomy |
| 19 | 43 | cisplatin/taxol +/− RAD001 × 12 | − | − | + | 3 | 0.7 | Residual disease | mastectomy |
| 20 | 55 | ddAC × 4 → Taxol × 10 | + | + | − | 2 | 3.5 | Residual disease | mastectomy |
| 21 | 58 | cisplatin/taxol +/− RAD001 × 12 | − | + | − | 2 | 1.7 | Residual disease | mastectomy |
| 22 | 36 | ddAC × 4 → Taxol × 12 | + | + | − | 2 | 2.1 | Residual disease | mastectomy |
| 23 | 43 | cisplatin/taxol +/− RAD001 × 12 | − | − | − | 3 | 1.4 | Residual disease | mastectomy |
| 24 | 42 | cisplatin/taxol +/− RAD001 × 6 | + | + | − | 2 | 3.5 | Residual disease | mastectomy |
| 25 | 53 | dd AC × 4 → Taxol-Herceptin × 7 | − | − | + | 3 | 0 | pCR | mastectomy |
| 26 | 46 | ddTaxotere→AC | − | + | − | 3 | 0 | pCR | mastectomy |
| 27 | 46 | dd AC × 4 → Taxol-Herceptin × 12 | − | − | + | 2 | 0 | pCR | mastectomy |
| 28 | 33 | ddAC × 4 → Taxol × 12 | − | − | − | 3 | 0 | pCR | mastectomy |
| 29 | 39 | Trastuzumab and Lapatinib × 12 | − | − | + | 2 | 0 | pCR | mastectomy |
| 30 | 46 | ddAC × 4 → Taxol × 12 | + | − | − | 3 | 0 | pCR | mastectomy |
| 31 | 42 | cisplatin/taxol +/− RAD001 × 12 | − | − | − | 3 | 0 | pCR | mastectomy |
| 32 | 34 | ddTaxotere→AC | − | − | − | 3 | 0 | pCR | mastectomy |
| 33 | 44 | Trastuzumab and Lapatinib × 12 | − | − | + | 3 | 0 | pCR | mastectomy |
| 34 | 37 | cisplatin/taxol +/− RAD001 × 11 | − | − | − | 3 | 0 | pCR | mastectomy |
| 35 | 39 | ddAC × 4 → Taxol × 10 | − | − | − | 3 | 0 | pCR | mastectomy |
| 36 | 48 | Taxotere/Carboplatin/Herceptin × 5 | − | − | + | 3 | 0 | pCR | mastectomy |
| 37 | 51 | ddAC × 4 → Taxol × 12 | − | − | − | 3 | 0 | pCR | mastectomy |
The study is ongoing and we are blinded to the randomization.
This patient was transferred to another hospital and the tumor size is not available.
Pathological Response
At completion of neoadjuvant chemotherapy, 13 patients (35.1%) were defined as having achieved pCR. In the patients who did not achieve pCR, the median size of the residual tumor was 1.5 cm (range: 0.3 - 8 cm).
Representative Imaging Data
Figure 1 displays the Ktrans, kep, ve, vp, and ADC maps, respectively, superimposed on anatomical T1-weighted images for a representative patient achieving pCR. The numbers under the panels indicate the mean values for each parameter at each time point. For this complete responder, both the mean Ktrans and the mean kep decreased after one cycle of therapy (the changes are −11% and −26%, respectively), while the mean values of ve, vp, and ADC increased (16%, 2%, and 30%, respectively). Figure 2 displays similar data for a non-pCR patient for which the mean Ktrans, kep, and ve increased by 22%, 15%, and 4%, respectively, after one cycle of treatment, while vp and ADC decreased by 20% and 23%, respectively.
Figure 1.

The averaged post-contrast MR images with Ktrans, kep, ve, vp, and ADC maps superimposed at three time points (three columns) for one pathological complete responder. The numbers under panels are the mean values for Ktrans, kep, ve, vp, and ADC at different time points. For this complete responder, both the mean Ktrans and the mean kep were decreased after one cycle of therapy, while the mean values of ve, vp, and ADC were increased.
Figure 2.

The averaged post-contrast MR images with Ktrans, kep, ve, vp, and ADC maps superimposed at three time points (three columns) for one non-pCR. The numbers under panels are the mean values for Ktrans, kep, ve, vp, and ADC at different time points.
Predictive Performance of DCE- and DW-MR Data at t1
Table 2 displays the ROC analysis of the pre-treatment data (i.e., LD, the DCE-MRI parameters, the ADC, and the parameter kep/ADC) to predict pathologic response. In this table, the cutoff point, sensitivity, specificity, PPV, and AUC, are listed for all the parameters. The table shows that the LD and DCE-MRI parameters (Ktrans, kep, ve, vp, kep/ADC) all resulted in an AUC less than 0.7. The ADC data yielded a moderate AUC of 0.75, with sensitivity, specificity, and PPV of 1.00, 0.54, and 0.54, respectively, at the cutoff point of 1.2 ×10⁻³ mm2/s.
Table 2.
ROC analysis of the parameters at t1.
| Parameter | Cutoff | Sensitivity | Specificity | PPV | AUC |
|---|---|---|---|---|---|
| LD | 1.92 (cm) | 1.00 | 0.33 | 0.45 | 0.66 |
| ADC | 1.2 (×10−3
mm2/s) |
1.00 | 0.54 | 0.54 | 0.75 |
| Ktrans | 0.15 (min−1) | 0.77 | 0.50 | 0.48 | 0.59 |
| kep | 0.45 (min−1) | 0.85 | 0.32 | 0.42 | 0.49 |
| ve | 0.41 | 0.62 | 0.55 | 0.44 | 0.52 |
| vp | 0.07 | 0.92 | 0.32 | 0.44 | 0.55 |
| kep/ADC | 5.18 (1/mm2) | 0.77 | 0.55 | 0.50 | 0.59 |
Predictive Performance of Changes in DCE- and DW-MRI from t1 to t2
33 patients were available for analyzing the changes of both the DCE-MRI and ADC data between the pre-therapy and post one cycle of therapy time points. The LD yielded an AUC of 0.68, with a sensitivity, specificity, and PPV of 0.92, 0.48, and 0.50, respectively. Among the four DCE-MRI parameters, the change of kep yielded the best AUC of 0.68, with a sensitivity, specificity, and PPV of 0.83, 0.63, and 0.59, respectively, at the cutoff point of −18.8%. The derived parameter kep/ADC yielded an AUC, sensitivity, specificity, and PPV of 0.72, 0.83, 0.63, and 0.59, respectively, at the cutoff point of −20.9%. These data are summarized in Table 3.
Table 3.
ROC analysis of parameter changes from t1 to t2.
| Parameter | Cutoff | Sensitivity | Specificity | PPV | AUC |
|---|---|---|---|---|---|
| LD | −1.0% | 0.92 | 0.48 | 0.50 | 0.68 |
| ADC | 5.5% | 0.50 | 0.76 | 0.55 | 0.62 |
| Ktrans | 12.7% | 1.00 | 0.37 | 0.50 | 0.57 |
| kep | −18.8% | 0.83 | 0.63 | 0.59 | 0.68 |
| ve | 92.4% | 1.00 | 0.11 | 0.41 | 0.41 |
| vp | 75.0% | 1.00 | 0.26 | 0.46 | 0.55 |
| kep/ADC | −20.9% | 0.83 | 0.63 | 0.59 | 0.72 |
Predictive Performance of DCE- and DW-MRI at t2
Both the DCE-MRI data and the ADC data after the first cycle of chemotherapy were available for 33 patients. Figure 3 displays the ROC curves and the optimal cut-off points for kep, ADC, and kep/ADC, respectively. The dotted line shows the ROC curve of kep alone, with the optimal cut-off point of 0.28 min−1 (marked as a triangle) and the dashed line shows the ROC curve for ADC alone, with the optimal point of 1.4 mm2/s × 10−3 (marked as a star). The solid line displays the ROC curve for kep/ADC, with the optimal point of 3.32 1/mm2 (marked as a star). kep yielded an AUC, sensitivity, specificity, and PPV of 0.77, 0.83, 0.65, and 0.59, respectively. ADC yielded an AUC, sensitivity, specificity, and PPV of 0.81, 0.83, 0.67, and 0.59, respectively. The derived parameter kep/ADC achieved an AUC, sensitivity, specificity, and PPV of 0.86, 0.92, 0.75, and 0.69, respectively. The LD yielded an AUC of only 0.58, with the sensitivity, specificity, and PPV of 0.92, 0.38, and 0.46, respectively. These data are summarized in Table 4.
Figure 3.

ROC for kep (dotted line), ADC (dashed line), and kep/ADC (solid line). kep and ADC alone yielded an AUC of 0.77 and 0.81 with the optimal cut-off point of 0.28 min−1 and 1.4 mm2/s × 10−3 (marked as a triangle and a square), respectively, while kep/ADC had an AUC of 0.86 with the optimal cut-off point of 3.32 1/mm2 (marked as a dot). The sensitivity, specificity, and PPV at the cut-off points are 0.83, 0.65, and 0.59 for kep, 0.83, 0.67, and 0.59 for ADC, and 0.92, 0.75, and 0.69 for kep/ADC, respectively.
Table 4.
ROC analysis of the parameters at t2.
| Parameter | Cutoff | Sensitivity | Specificity | PPV | AUC |
| LD | 1.91 (cm) | 0.92 | 0.38 | 0.46 | 0.58 |
| ADC | 1.4 (×10−3
mm2/s) |
0.83 | 0.67 | 0.59 | 0.81 |
| Ktrans | 0.1 (min−1) | 0.67 | 0.75 | 0.62 | 0.68 |
| kep | 0.28 (min−1) | 0.83 | 0.65 | 0.59 | 0.77 |
| ve | 0.65 | 0.17 | 0.95 | 0.67 | 0.52 |
| vp | 0.04 | 0.50 | 0.80 | 0.60 | 0.62 |
| kep/ADC | 3.32 (1/mm2) | 0.92 | 0.75 | 0.69 | 0.86 |
Figure 4 shows boxplots of kep, ADC, and kep/ADC for pCRs and non-pCRs. The lines within the boxes denote the median and the bottom and top edges of the boxes denote the 25th and 75th percentiles, respectively. The medians of kep for non-pCRs and pCRs were 0.32 min−1 and 0.23 min−1 (P = 0.013), respectively, while they were 1.24 mm2/s × 10−3 and 1.59 mm2/s × 10−3 for ADC (P = 0.0037), and 4.27 1/mm2 and 2.63 1/mm2 for kep/ADC (P = 0.00087), respectively.
Figure 4.
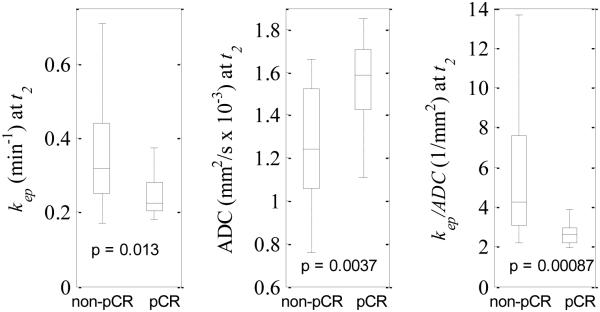
Boxplots of kep (left panel), ADC (middle panel), and kep/ADC (right panel) at t2 for non-pCRs and pCRs. The central marks show the median and the edges of the box are the 25th and 75th percentiles. Outliers are not shown in the figure. The medians of kep for non-pCRs and pCRs were 0.32 min−1 and 0.23 min−1, respectively, while they were 1.24 mm2/s × 10−3 and 1.59 mm2/s × 10−3 for ADC, and 4.27 1/mm2 and 2.63 1/mm2 for kep/ADC, respectively.
Figure 5 shows the distributions of the AUC differences between kep/ADC and kep, and between kep/ADC and ADC generated by the bootstrap method. The bootstrapped 95% CIs of the AUC differences between kep/ADC and kep were (0.0062, 0.20), indicating that the AUCs between kep/ADC and kep were significantly different. Although the 95% bootstrap CIs of the AUC differences between kep/ADC and ADC included zero (−0.12, 0.24), the figure clearly shows a trend approaching significance.
Figure 5.

The figure displays density distributions of the AUC differences between kep/ADC and kep (dotted line), and between kep/ADC and ADC (solid line) after one cycle of NAC. The 95% CIs of the AUC differences between kep/ADC and kep were (0.0062, 0.20), while the 95% CIs of the AUC differences between kep/ADC and ADC were (−0.12, 0.24). The areas outside the 95% CIs are shadowed for both distributions.
DISCUSSION
To our knowledge, this is the first report of a derived multiparametric quantitative MRI measurement predicting pCR following breast cancer NAC. We chose to study the derived parameter kep/ADC for statistical and physiological reasons. The hypothesis is that in the case of positive response kep would decrease and ADC would increase, whereas in the case of negative response (i.e., progressive disease) kep would increase and ADC would decrease. Thus, the ratio kep/ADC has the potential to increase the statistical separation between patients going on to achieve pCR versus those who do not (see Figure 4). For this practical reason, the ratio kep/ADC is a reasonable parameter to consider; indeed, such derived parameters have been utilized before, even in the particular case of assessing therapeutic response of breast cancer in the neoadjuvant setting (see, e.g., 30).
Our results show that the combined parameter kep/ADC was able to predict pCR with greater accuracy (AUC = 0.86) than either kep (AUC = 0.77) or ADC (AUC = 0.81) in isolation. The bootstrap method showed that the AUCs between kep/ADC and kep were significantly different and the AUCs between kep/ADC and ADC showed a trend approaching significance. Although these results may be considered preliminary due to our small sample size, we consider them encouraging signs of the potentials of multiparametric MR imaging to depict tumor biology and assess tumor response to therapy early in the course of treatment (31). Thus, we believe this study contributes to the growing body of knowledge in this developing area.
A secondary finding in this study is that data obtained after the first cycle of therapy was the most statistically robust for predicting eventual treatment response. Many previous studies have focused on either pre-treatment data or the change between pre-treatment data and data acquired after one or two cycles of chemotherapy (6-8). Only the study by Fangberget et al (14) reported that the mean ADC values after four cycles of NAC showed a significant difference between the patients in the pCR and non-pCR groups, while the percent change of ADC did not. In our study, we found that the mean parameters of both the DCE- and DW-MRI data after one cycle of therapy yielded a better performance (as measured by ROC analysis) than either the pre-treatment data or the percent change of the parameters.
There are a number of limitations of this study. First, the temporal resolution of 16 s is not optimal for characterizing the arterial input function and this can confound a quantitative DCE-MRI analysis. This temporal resolution was chosen as a compromise between temporal and spatial resolution and field of view coverage (please refer to (16) for an in-depth discussion). Second, a population AIF was used to estimate the DCE-MRI parameters. In practice, it is difficult to estimate reliable AIFs at each scanning session for each patient. Hence, we used a population AIF as an alternative approach. Third, the treatment regimens used in this study were left to the discretion of the treating physicians, and were therefore quite varied. It is certainly possible that the imaging biomarkers could vary by both the biology of the disease as well as by the agents utilized. When this is combined with the modest sample size (data was available on 37 patients before NAC, while we were able to acquire data on 33 patients both before and after one cycle of NAC), our findings are preliminary in nature and will need to be validated in larger prospective trials.
In summary, our study shows that combining DCE- and DW-MRI data into a single derived multiparametric measurement kep/ADC can increase the ability to predict breast cancer response to NAC at a very early time point. It may allow clinicians to tailor therapy on an individual basis. Future work includes investigating multivariate analysis of DCE- and DW-MRI on a larger cohort of patients.
Acknowledgments
Grant Support: NCI 1U01CA142565, NCI 1U01CA174706, NCI 1P50 098131, NCI P30 CA068485, NCRR/NIH UL1 RR024975-01 (Vanderbilt CTSA grant)
References
- 1.Yankeelov TE, Arlinghaus LR, Li X, Gore JC. The role of magnetic resonance imaging biomarkers in clinical trials of treatment response in cancer. Semin Oncol. 2011;38:16–25. doi: 10.1053/j.seminoncol.2010.11.007. [DOI] [PMC free article] [PubMed] [Google Scholar]
- 2.Guo Y, Cai YQ, Cai ZL, Gao YG, An NY, Ma L, Mahankali S, Gao JH. Differentiation of clinically benign and malignant breast lesions using diffusion-weighted imaging. J Magn Reson Imaging. 2002;16:172–178. doi: 10.1002/jmri.10140. [DOI] [PubMed] [Google Scholar]
- 3.Cheung YC, Chen SC, Su MY, See LC, Hsueh S, Chang HK, Lin YC, Tsai CS. Monitoring the size and response of locally advanced breast cancers to neoadjuvant chemotherapy (weekly paclitaxel and epirubicin) with serial enhanced MRI. Breast Cancer Res Treat. 2003;78:51–58. doi: 10.1023/a:1022153327339. [DOI] [PubMed] [Google Scholar]
- 4.Chou CP, Wu MT, Chang HT, Lo YS, Pan HB, Degani H, Furman-Haran E. Monitoring breast cancer response to neoadjuvant systemic chemotherapy using parametric contrast-enhanced MRI: a pilot study. Acad Radiol. 2007;14:561–573. doi: 10.1016/j.acra.2007.02.005. [DOI] [PubMed] [Google Scholar]
- 5.Martincich L, Montemurro F, De Rosa G, Marra V, Ponzone R, Cirillo S, Gatti M, Biglia N, Sarotto I, Sismondi P, Regge D, Aglietta M. Monitoring response to primary chemotherapy in breast cancer using dynamic contrast-enhanced magnetic resonance imaging. Breast Cancer Res Treat. 2004;83:67–76. doi: 10.1023/B:BREA.0000010700.11092.f4. [DOI] [PubMed] [Google Scholar]
- 6.Yankeelov TE, Lepage M, Chakravarthy A, Broome EE, Niermann KJ, Kelley MC, Meszoely I, Mayer IA, Herman CR, McManus K, Price RR, Gore JC. Integration of quantitative DCE-MRI and ADC mapping to monitor treatment response in human breast cancer: initial results. Magn Reson Imaging. 2007;25:1–13. doi: 10.1016/j.mri.2006.09.006. [DOI] [PMC free article] [PubMed] [Google Scholar]
- 7.Ah-See ML, Makris A, Taylor NJ, Harrison M, Richman PI, Burcombe RJ, Stirling JJ, d'Arcy JA, Collins DJ, Pittam MR, Ravichandran D, Padhani AR. Early changes in functional dynamic magnetic resonance imaging predict for pathologic response to neoadjuvant chemotherapy in primary breast cancer. Clin Cancer Res. 2008;14:6580–6589. doi: 10.1158/1078-0432.CCR-07-4310. [DOI] [PubMed] [Google Scholar]
- 8.Padhani AR, Hayes C, Assersohn L, Powles T, Makris A, Suckling J, Leach MO, Husband JE. Prediction of clinicopathologic response of breast cancer to primary chemotherapy at contrast-enhanced MR imaging: initial clinical results. Radiology. 2006;239:361–374. doi: 10.1148/radiol.2392021099. [DOI] [PubMed] [Google Scholar]
- 9.Pickles MD, Gibbs P, Lowry M, Turnbull LW. Diffusion changes precede size reduction in neoadjuvant treatment of breast cancer. Magn Reson Imaging. 2006;24:843–847. doi: 10.1016/j.mri.2005.11.005. [DOI] [PubMed] [Google Scholar]
- 10.Sharma U, Danishad KK, Seenu V, Jagannathan NR. Longitudinal study of the assessment by MRI and diffusion-weighted imaging of tumor response in patients with locally advanced breast cancer undergoing neoadjuvant chemotherapy. NMR Biomed. 2009;22:104–113. doi: 10.1002/nbm.1245. [DOI] [PubMed] [Google Scholar]
- 11.Belli P, Costantini M, Ierardi C, Bufi E, Amato D, Mule A, Nardone L, Terribile D, Bonomo L. Diffusion-weighted imaging in evaluating the response to neoadjuvant breast cancer treatment. Breast J. 2011;17:610–619. doi: 10.1111/j.1524-4741.2011.01160.x. [DOI] [PubMed] [Google Scholar]
- 12.Woodhams R, Kakita S, Hata H, Iwabuchi K, Kuranami M, Gautam S, Hatabu H, Kan S, Mountford C. Identification of residual breast carcinoma following neoadjuvant chemotherapy: diffusion-weighted imaging--comparison with contrast-enhanced MR imaging and pathologic findings. Radiology. 2010;254:357–366. doi: 10.1148/radiol.2542090405. [DOI] [PubMed] [Google Scholar]
- 13.Nilsen L, Fangberget A, Geier O, Olsen DR, Seierstad T. Diffusion-weighted magnetic resonance imaging for pretreatment prediction and monitoring of treatment response of patients with locally advanced breast cancer undergoing neoadjuvant chemotherapy. Acta Oncol. 2010;49:354–360. doi: 10.3109/02841861003610184. [DOI] [PubMed] [Google Scholar]
- 14.Fangberget A, Nilsen LB, Hole KH, Holmen MM, Engebraaten O, Naume B, Smith HJ, Olsen DR, Seierstad T. Neoadjuvant chemotherapy in breast cancer-response evaluation and prediction of response to treatment using dynamic contrast-enhanced and diffusion-weighted MR imaging. Eur Radiol. 2011;21:1188–1199. doi: 10.1007/s00330-010-2020-3. [DOI] [PMC free article] [PubMed] [Google Scholar]
- 15.Wu LM, Hu JN, Gu HY, Hua J, Chen J, Xu JR. Can diffusion-weighted MR imaging and contrast-enhanced MR imaging precisely evaluate and predict pathological response to neoadjuvant chemotherapy in patients with breast cancer? Breast Cancer Res Treat. 2012;135:17–28. doi: 10.1007/s10549-012-2033-5. [DOI] [PubMed] [Google Scholar]
- 16. Blinded1.
- 17. Blinded2.
- 18. Blinded3.
- 19. Blinded4.
- 20. Blinded5.
- 21. Blinded6.
- 22. Blinded7.
- 23. Blinded8.
- 24.Maes F, Collignon A, Vandermeulen D, Marchal G, Suetens P. Multimodality image registration by maximization of mutual information. IEEE Trans Med Imaging. 1997;16:187–198. doi: 10.1109/42.563664. [DOI] [PubMed] [Google Scholar]
- 25.Li X, Welch EB, Chakravarthy AB, Lei X, Arlinghaus LR, Farley J, Loveless ME, Mayer I, Kelley M, Meszoely I, Means-Powell J, Abramson V, Grau A, Gore JC, Yankeelov TE. A Novel AIF Detection Method and a Comparison of DCE-MRI Parameters Using Individual and Population Based AIFs in Human Breast Cancer. Phys Med Biol. 2011;56:5753–5769. doi: 10.1088/0031-9155/56/17/018. [DOI] [PMC free article] [PubMed] [Google Scholar]
- 26.Hanley JA, McNeil BJ. The meaning and use of the area under a receiver operating characteristic (ROC) curve. Radiology. 1982;143:29–36. doi: 10.1148/radiology.143.1.7063747. [DOI] [PubMed] [Google Scholar]
- 27.Perkins NJ, Schisterman EF. The inconsistency of "optimal" cutpoints obtained using two criteria based on the receiver operating characteristic curve. Am J Epidemiol. 2006;163:670–675. doi: 10.1093/aje/kwj063. [DOI] [PMC free article] [PubMed] [Google Scholar]
- 28.Lehmann EL. Parametric versus nonparametrics: two alternative methodologies. Journal of Nonparametric Statistics. 2009;21:397–405. [Google Scholar]
- 29.Efron B, Tibshirani RJ. An Introduction of the Bootstrap. Chapman and Hall/CRC; New York: 1993. [Google Scholar]
- 30.Cerussi AE, Tanamai VW, Hsiang D, Butler J, Mehta RS, Tromberg BJ. Diffuse optical spectroscopic imaging correlates with final pathological response in breast cancer neoadjuvant chemotherapy. Phil. Trans. R. Soc. A. 2011;369:4512–4530. doi: 10.1098/rsta.2011.0279. [DOI] [PMC free article] [PubMed] [Google Scholar]
- 31.Padhani AR, Miles KA. Multiparametric imaging of tumor response to therapy. Radiology. 2010;256:348–364. doi: 10.1148/radiol.10091760. [DOI] [PubMed] [Google Scholar]