

High-resolution, real-time, three-dimensional fluorescence microscopy imaging shows the absence of clathrin-coated pits and vesicles at the ventral surfaces of lamellipodia and lamellae at the front of migrating cells. In addition, the data support the model invoking net membrane deposition at the cell front of migrating cells due to an imbalance between endocytic and exocytic membrane flow.
Abstract
Clathrin/AP2-coated vesicles are the principal endocytic carriers originating at the plasma membrane. In the experiments reported here, we used spinning-disk confocal and lattice light-sheet microscopy to study the assembly dynamics of coated pits on the dorsal and ventral membranes of migrating U373 glioblastoma cells stably expressing AP2 tagged with enhanced green fluorescence (AP2-EGFP) and on lateral protrusions from immobile SUM159 breast carcinoma cells, gene-edited to express AP2-EGFP. On U373 cells, coated pits initiated on the dorsal membrane at the front of the lamellipodium and at the approximate boundary between the lamellipodium and lamella and continued to grow as they were swept back toward the cell body; coated pits were absent from the corresponding ventral membrane. We observed a similar dorsal/ventral asymmetry on membrane protrusions from SUM159 cells. Stationary coated pits formed and budded on the remainder of the dorsal and ventral surfaces of both types of cells. These observations support a previously proposed model that invokes net membrane deposition at the leading edge due to an imbalance between the endocytic and exocytic membrane flow at the front of a migrating cell.
INTRODUCTION
Clathrin-coated pits and coated vesicles account for the largest fraction of endocytic traffic originating from the cell surface of mammalian cells (see reviews in Watts and Marsh, 1992; Kirchhausen, 2009; Bitsikas et al., 2014). Clathrin and its AP2 adaptor complex are the main coat components on the cytosolic side of the membrane bilayer of endocytic coated pits and vesicles. Assembly of clathrin into cage-like structures provides the molecular scaffold for membrane deformation, wherein AP2 is the principal cargo-recognition molecule linking the clathrin coat with the membrane (reviewed in Kirchhausen et al., 2014). The kinetics of coated pit and coated vesicle formation have been studied by following the incorporation into assembling coats of fluorescently tagged clathrin, AP2, cargo, and other coat components using live-cell fluorescence imaging with high spatial and temporal resolution (see, e.g., Keen et al., 1999; Merrifield et al., 2002; Ehrlich et al., 2004; Kirchhausen, 2009; Kirchhausen et al., 2014; Taylor et al., 2011; Cocucci et al., 2012; Aguet et al., 2013). Canonical coated pits and vesicles with lifetimes from 35 to 90 s correspond to tightly curved coated pits and form throughout the ventral and dorsal surfaces of cells (Ehrlich et al., 2004; Perrais and Merrifield, 2005; Saffarian and Kirchhausen, 2008; Saffarian et al., 2009; Cocucci et al., 2012; Aguet et al., 2013). Larger and long-lived structures correspond to lower-curvature coated plaques (Saffarian et al., 2009; Grove et al., 2014) and are found mostly at the ventral surface of adherent cells (for reviews, see Kirchhausen, 2009; Kirchhausen et al., 2014).
Fluorescence images obtained from nonmigrating cells show an even distribution of clathrin- and AP2-containing coated pits throughout the ventral membrane surfaces (Ehrlich et al., 2004; Perrais and Merrifield, 2005; Boucrot and Kirchhausen, 2007; Aguet et al., 2013). This is in stark contrast to the uneven distribution of coated pits and vesicles reported for rapidly migrating cells using electron microscopy (Davis et al., 1982) or fluorescence microscopy (Nishimura et al., 2003; Rappoport and Simon, 2003; Samaniego et al., 2007; Tojima et al., 2010; Fletcher et al., 2012; Mutch et al., 2014). A rapidly migrating T-lymphocyte has a broad and relatively thin lamellipodium at the front and a uropod at the back. Electron microscopy showed there are no coated pits and vesicles in the flattened lamellipodia of these cells (Davis et al., 1982). This asymmetric distribution of endocytic clathrin structures was confirmed using fluorescence microscopy and was found to be consistent with the relatively low endocytic activity at the lamellipodium and active endocytosis at the uropod (Samaniego et al., 2007). Other studies of clathrin-based endocytosis during directed migration included fluorescence microscopy imaging of clathrin or AP2 at the ventral surfaces of migrating MDCK, Vero, or MDA-MB-231 cells (Nishimura et al., 2003; Rappoport and Simon, 2003; Fletcher et al., 2012; Mutch et al., 2014) and of growth cones in neurons (Tojima et al., 2010). Although not reported in these studies, there is a notable absence of clathrin or AP2 fluorescent spots at the leading edge of the migrating cells (Nishimura et al., 2003; Fletcher et al., 2012; Mutch et al., 2014) or growth cones (Tojima et al., 2010) in the published figures. From the coplanarity of the spots in the remaining portion of the cells attached to the glass surface, we surmise that the coated pits and vesicles were forming at the optical sections corresponding to the ventral surfaces of the cells. At variance with all these data, however, one study obtained using total internal reflection microscopy reported that clathrin structures were present on the leading bottom surfaces of migrating MDCK cells but completely absent at the backs of the same cells (Rappoport and Simon, 2003). But the same authors later published images in which clathrin pits were absent from the ventral leading edges of the same kind of cells (figure S4 in Fletcher et al., 2012).
To resolve these conflicting observations and to characterize more completely the spatial asymmetry of coated pit formation at the surface of motile cells, we describe here studies using high-resolution, real-time, three-dimensional (3D) fluorescence imaging. We chose U373 human glioblastoma cells as a model of cell motility because of their active migration (Ulrich et al., 2009). Rapidly migrating cells are polarized in the direction of migration, with upward-pointing, ruffling lamellipodia at the leading edges, followed by flat and relatively thin lamellae adjacent to the trailing cell bodies (Salmon et al., 2002; Planchon et al., 2011). The lamellipodium has faster retrograde actin flow than the lamella (Ponti et al., 2004).
Our 3D-imaging and particle-tracking approach (Kural et al., 2012) allowed us to separate, for the first time, events at the ventral and dorsal surfaces of the same cell. We found that formation of a very large number of coated pits initiated at the leading edges of migrating U373 cells. These pits were then swept back with retrograde flow along the dorsal surfaces of the lamellipodia. They continued to assemble as they moved, ending with membrane budding, coated vesicle formation, and clathrin/AP2 coat disassembly, often at the approximate boundary between the lamellipodium and lamella. A second population of coated pits initiated at this boundary. These pits were also swept back along the dorsal lamella as they matured to become coated vesicles. Coated pits and vesicles were virtually absent from the ventral surface of the corresponding lamellipodium and lamella but reappeared as soon as the motile cell became stationary. Over the rest of the cell surface, coated pits initiated and matured into coated vesicles without much lateral motion, regardless of overall cell movement.
We also tracked the formation of coated pits and vesicles on small protrusions at the edge of nonmigrating SUM159 human breast carcinoma cells. Using lattice light-sheet microscopy (Chen et al., 2014) to help resolve the events in the small volume of the protrusions, we observed initiation of coated pits at the leading edge of the protrusions and their maturation, coupled with movement along the dorsal surface toward the cell body. While absent from the ventral surface of the protrusion, stationary coated pits formed normally along the remaining dorsal and ventral membranes of the same cells.
RESULTS
Absence of clathrin/AP2-coated structures at the ventral surface of lamellipodium and lamella of migrating U373 glioblastoma cells
We established a cell line derived from U373 human glioblastoma cells stably expressing AP2 fluorescently tagged by fusion of its σ2 subunit to enhanced green fluorescence protein (AP2-EGFP), following the same strategy used previously with BSC1 cells (Ehrlich et al., 2004; Cocucci et al., 2012). Using spinning-disk confocal microscopy, we visualized the AP2 fluorescent spots corresponding to endocytic coated pits and vesicles at the cell surfaces of migrating glioblastoma cells. We found different behaviors according to location (Figures 1 and 2 and Supplemental Movie 1). We observed an almost complete absence of AP2 spots at the ventral surfaces of the lamellipodia and lamellae of migrating cells (Figure 1A, AP2 front, and Figure 2A, ventral), while AP2 spots were apparent in both the remaining ventral surfaces and all the dorsal surfaces of the same cells (Figure 1A, AP2 back, and Figure 2A, dorsal + ventral). A similar absence of clathrin/AP2 fluorescent spots was observed for the ventral and dorsal surfaces of motile U373 cells stably expressing fluorescently tagged AP2 together with transient expression of clathrin light chain A fused at its N-terminus to Tomato (Tomato-LCa; Massol et al., 2006; Saffarian et al., 2009; Figure 1B). Quantification of the membrane density of AP2 spots for the five migrating cells represented in Figure 2A showed an almost complete absence on the ventral lamellipodium and lamella (0.02 ± 0.01 spots/μm2). In contrast, AP2 spots were similarly distributed in the dorsal surfaces of the lamellipodium and lamella (0.26 ± 0.08 spots/μm2) and the remaining ventral (0.27 ± 0.07 spots/μm2) and dorsal (0.19 ± 0.05 spots/μm2) surfaces toward the back of the same cells.
FIGURE 1:

Asymmetric formation of clathrin/AP2-coated pits and vesicles at the front of migrating U373 glioblastoma cells. (A) Absence of clathrin/AP2-containing coated structures at the ventral surfaces of lamellipodia and lamellae. Single optical section obtained by spinning-disk confocal microscopy from the ventral (attached) surfaces of three different migrating U373 cells. AP2 was fluorescently tagged by stable expression of σ2-EGFP. The images highlight the ubiquitous absence of AP2-containing structures in the ventral surfaces of lamellipodia and lamellae and their presence in the back toward the rear of the same cells. See associated Supplemental Movie 1. Yellow arrowheads highlight AP2 spots at the boundary between the lamella and the rest of the cell body; white arrows indicate the direction of migration; stippled yellow lines demarcate the leading edges of the cells. Scale bar: 10 μm. (B) Presence of clathrin/AP2-containing coated structures at the dorsal surface of lamellipodium and lamella. Representative spinning-disk confocal image from the ventral surface and a dorsal projection obtained by combining images from the dorsal surface of a migrating U373 cell. The ventral image was from a single optical section, while the dorsal image corresponds to the maximum z-projection from six consecutive optical sections spaced 280 nm apart. Clathrin was labeled by transient expression of Tomato-LCa, and AP2 was fluorescently tagged by stable expression of σ2-EGFP. The images highlight the absence of clathrin and AP2 spots at the ventral surface of the lamellipodium and lamella and their presence at the corresponding dorsal surface. White arrows indicate direction of migration; stippled yellow lines demarcate the leading edge of the cell. Scale bar: 10 μm.
FIGURE 2:

Surface density of AP2-containing coated pits and vesicles at the front and back of migrating U373 cells. (A) Representative images obtained from the ventral surface and maximum z-projection from 30 optical sections spaced 700 nm apart from the corresponding dorsal surface of the same migrating U373 cell stably expressing AP2 fluorescently tagged with σ2-EGFP. The imaged region highlights the absence of AP2 structures at the ventral surface of the lamellipodium and associated lamella and their presence in the corresponding dorsal surface; AP2 structures were also present on the adjacent ventral and dorsal surfaces. White arrow indicates direction of migration; stippled yellow lines demarcate the leading edge of the cell. Scale bar: 10 μm. (B) Schematic representation of a migrating U373 cell and demarcation of regions used for analysis of the surface density of AP2 structures; front includes the lamellipodium and lamella. Bar plots compare the surface density of AP2 spots at the front and back ends of the same five migrating U373 cells. Data expressed as mean ± SD from 1124 ventral spots and 1380 dorsal spots.
The absence of clathrin/AP2-coated pits and vesicles on the ventral surface of the lamellipodia and lamellae of migrating glioblastoma cells was fully reversible (Figure 3A and Supplemental Movie 2). The AP2 spots rapidly reappeared as soon as cell migration halted (Figure 3B), and their lifetimes spanned the same range as coated pits and vesicles on other parts of the same cell (Figure 3C). The similarity of lifetime distribution suggested similar endocytic activity, since lifetimes determined with the relatively low sensitivity of the spinning-disk confocal microscope primarily represent the successful (long-lived and larger) coated pits that mature and convert into coated vesicles (Ehrlich et al., 2004; Cocucci et al., 2012; Aguet et al., 2013). These lifetimes were similar to those previously determined for canonical, diffraction-limited, clathrin/AP2-coated pits and vesicles on the ventral surfaces of nonmigrating BSC1 cells (Ehrlich et al., 2004; Cocucci et al., 2012; Kural et al., 2012; Aguet et al., 2013). Inspection of the lifetime distribution indicated that a small fraction of the AP2 spots were long-lived (>200 s), as expected for coated plaques (Saffarian et al., 2009).
FIGURE 3:

AP2-containing coated pit and vesicles reappear at the ventral surface of lamellipodium and lamella as soon as migration halts. (A) Images acquired at the indicated times from a time series obtained from the ventral surface of the lamellipodium and lamella of a U373 glioblastoma cell. Images show the reappearance of AP2 spots shortly after cessation of cell migration. See associated Supplemental Movie 2. White arrows indicates direction of migration; stippled yellow lines demarcate the leading edge of the cell. Scale bar: 10 μm. (B) Time course showing the increase in surface density of AP2 spots at the ventral surfaces of lamellipodia and lamellae from five cells as they halted migration. (C) Comparison of lifetimes of canonical AP2 structures on the ventral surface of lamellipodium and lamella of the five cells that ceased migration (analyzed in B ) and the ventral surface of nonmigrating cells. AP2 spots with lifetimes > 200 s represent long-lived plaques.
Coated pits continue assembly at the dorsal surface of the lamellipodium and lamella while being swept toward the rear of the cell
We used our 3D single-particle tracking protocol (Kural et al., 2012; Kural and Kirchhausen, 2012), which enables determination of position of diffraction-limited coated pits and vesicles with subdiffraction-limit axial and lateral accuracy, to track the AP2 structures as they formed on the dorsal surfaces at the front of migrating astrocytes (Figure 4). By taking advantage of the 100-nm axial precision of the tracking protocol, we could establish unambiguously that AP2 spots continue to grow on the dorsal surface of the lamellipodium and lamella (Figure 4, A and B). Most AP2 pits initiated at the leading edge of the cell (Figure 4C). As they continued their assembly, they moved toward the rear of the migrating cells following a retrograde direction along the dorsal surfaces of the lamellipodia (Figures 4B and 5, A and B; Kural and Kirchhausen, 2012). Loss of the AP2 signal, indicating disassembly of the coat surrounding abortive pits and/or fully formed coated vesicles, occurred near the boundary between the lamellipodium and lamella (Figure 5, A and B). A second group of coated pits initiated formation at approximately this boundary and were also swept toward the cell bodies as they matured (Figure 5, A and B). Cell migration speed reached up to 30 nm/s and was inversely related to the retrograde speed of the AP2 spots (Figure 5C). Actin arcs form at the lamella, reach the dorsal membrane, and undergo retrograde flow (Cramer, 1997) mediated by coupling to actomyosin contraction (Ponti et al., 2004; Burnette et al., 2014). The similarity between the retrograde speed of AP2 spots at the leading edges of motile U373 cells (Figure 5C) and the retrograde speed of the actin arcs visualized by transient expression of LifeAct-Cherry (Figure 5, D and E, and Supplemental Movie 3) is consistent with a strong interaction between the endocytic clathrin-coated pits and the actin mesh.
FIGURE 4:

Three-dimensional tracking of AP2-containing coated pits and vesicles appearing at the dorsal surfaces on the leading edges of migrating U373 cells. (A) Maximum intensity projection of the ventral and dorsal surfaces of the lamellipodia and lamellae obtained from a time series obtained from eight different migrating glioblastoma cells (1–8). The number of consecutive z-planes imaged with 40-ms exposures for each cell, including the distance between planes, the interval between stacks, and the duration of the time series, are indicated in the table at the bottom of the figure. White arrows indicate direction of migration. Scale bars: 10 μm. (B) Three-dimensional traces color coded for the z-position of AP2 spots as they formed on the dorsal surface of the lamellipodium and lamella of the migrating glioblastoma cells. Stippled white lines indicate the approximate boundaries between lamellipodia and lamellae. Scale bars: 10 μm. (C) Each dot marks the location at which each AP2 spot from the data in B started to form, color coded according to their local surface density, as determined by the number of neighboring initiation events in a spherical volume of 2.5-μm radius. Scale bars: 10 μm.
FIGURE 5:

Retrograde flow of AP2-containing coated pits and vesicles along the dorsal surface of lamellipodium and lamella of a migrating U373 cell. (A) Three-dimensional tracking of AP2 spots as they formed at the dorsal surface of lamellipodium and lamella of a migrating U373 cell. The AP2 spots, color coded for position along the z-axis, display retrograde flow (orange arrow) toward the cell body in the opposite direction of cell migration (white arrow). Stippled white line indicates approximate boundary between lamellipodium and lamella. The plots in the insets highlight the time dependence for the location along the z-axis of representative AP2 spots between initiation and internalization. The data are from four consecutive z-planes spaced 350 nm apart, imaged with 50-ms exposures acquired every 1.6 s for 320 s. Scale bar: 10 μm. (B) Schematic representation of the region imaged in A indicating direction of cell movement, location of AP2 structures color coded for their z-position as they form on the dorsal surface of lamellipodium and lamella, and direction of their retrograde flow. (C) Dependence between the average retrograde velocities of AP2 spots on the dorsal surface of a migrating cell and the migrating velocity of the leading edge of the same cell. Each data point represents mean ± SD of AP2 spots from each of seven cells; a total of 808 spots were analyzed. (D and E) Retrograde movement of actin arcs at the lamellipodia of migrating U373 cells. The kymographs are from a time series obtained along the blue and red dashed lines of two migrating U373 cells transiently expressing LifeAct-Cherry. Black arrowheads track the retrograde movements of each of the two selected actin arcs. The average retrograde speed of the actin arcs in D and E was 13.5 ± 3.5 and 10.2 ± 2 nm/s for cells migrating at 20.6 and 22.8 nm/s, respectively.
Tracking of AP2 structures that formed in the remaining dorsal surfaces of migrating U373 cells (Figure 4B) showed assembly of pits at relatively stationary sites, similar to the stationary assembly previously described for nonmigrating cells (Ehrlich et al., 2004; Cocucci et al., 2012; Kural et al., 2012; Aguet et al., 2013).
Asymmetric distribution of coated pits and vesicles on the dorsal and ventral surfaces of cell protrusions
We also investigated the behavior of coated pits and vesicles in the relatively small protrusions that formed at the peripheries of mostly stationary SUM159 human breast carcinoma cells. In this case, we visualized fluorescently tagged AP2 complexes in SUM159 cells gene-edited to express σ2-EGFP instead of σ2 (SUM-AP2.1). We imaged coated pits and vesicles, using lattice light-sheet microscopy (Chen et al., 2014) to resolve the dorsal from the ventral surfaces of the protrusions (Figure 6, A–C, and Supplemental Movie 4). Just as at the leading edges of migrating U373 cells, we saw retrograde flow of fluorescent AP2 spots, which initiated at the leading dorsal surfaces of the protrusions (Figure 6, A and C). The ventral regions of the protrusions lacked AP2, while their density was normal on the remaining ventral surfaces of the same cells (Figure 6, A and C). Other than on the protrusions, there was no significant heterogeneity in the spatial distribution of AP2 spots on the ventral or dorsal surfaces of these cells (unpublished data).
FIGURE 6:
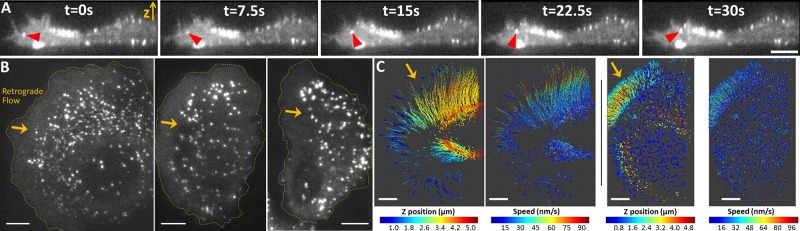
Formation of AP2-containing coated pits and vesicles in small protrusions at the periphery of nonmigrating SUM159 cells. (A) AP2-containing endocytic coated pits and vesicles imaged using lattice light-sheet microscopy at the ventral and dorsal surfaces of nonmigrating SUM-AP2.1 cell number 6 gene-edited to express AP2 tagged with σ2-EGFP. Single-plane x,z side views from a time series of volumes consisting of 80 planes spaced 205 nm apart imaged with a 2.18-s interval between stacks. Images were acquired with 25-ms exposure and the duration of the time series was 216 s. A small protrusion is apparent in the left side of the cell. Most AP2 spots are relatively stationary throughout all the ventral and dorsal surfaces, except for those within the retrograde flow at the dorsal surface of the small protrusions (see, e.g., the AP2 spot highlighted by the red arrowhead). This example also shows the scarcity of AP2 spots at the ventral surface of the protrusion. Scale bar: 5 μm. (B) Single-plane top views corresponding to the ventral surface from the gene-edited SUM-AP2.1 cell numbers 1, 2, and 3, respectively. The images show the absence of AP2 spots at the leading fronts of the protrusions, which in general were narrower than the lamellipodia and lamellae of migrating glioblastoma cells. Orange arrows indicate direction of retrograde movement of AP2 at the dorsal surfaces of the protrusions (not shown). Scale bars: 5 μm. (C) Three-dimensional tracking of AP2 spots forming at the dorsal surfaces of protrusions illustrates their retrograde movement toward the cell bodies (orange arrows). The AP2 traces are color coded according to their z-position with respect to the ventral membrane and according to their retrograde velocity in the gene-edited SUM-AP2.1 number 4 and 5 cells. Scale bars: 5 μm.
DISCUSSION
We have shown for the first time, by live-cell 3D fluorescence microscopy imaging of U373 glioblastoma cells migrating on a two-dimensional surface, that clathrin/AP2-containing endocytic coated pits form at the leading edge and complete their assembly while being swept toward the cell body along the dorsal surface of the lamellipodium. The coated pits bud as coated vesicles and subsequently uncoat by the time they reach the boundary between the lamellipodium and lamella; abortive pits also dissolved at the boundary. We detected a second pool of coated pits that initiated at this boundary. They were also formed while being swept with retrograde flow toward the cell body. In contrast, coated pits and vesicles were noticeably absent from the ventral membranes of the lamellipodium and lamella. The retrograde flow of pits on the dorsal surfaces of the lamellipodia and lamellae of motile U373 cells ended as soon as the cells stopped migrating, and new pits with normal assembly dynamics appeared on the corresponding ventral surfaces. We found a similar asymmetric distribution of coated pits and vesicles at the dorsal and ventral surfaces of small protrusions forming around the edge of nonmigrating SUM159 breast cancer cells and on the lamellipodia and lamellae of MEF cells stably expressing AP2-σ2-EGFP (unpublished data).
Our live-cell imaging data are consistent with early results from electron microscopy showing absence of coated pits and vesicles in the extended dorsal and ventral surfaces of the lamellipodia and normal amounts in the cell bodies and trailing uropods of rapidly migrating T-cells (Davis et al., 1982). They are likewise consistent with more recent data clearly showing lack of endocytosis in the lamellipodium and normal uptake in the cell body and uropod (Samaniego et al., 2007). Published images and movies from studies of neuronal growth-cone extension (Tojima et al., 2010) likewise show nearly complete absence of endocytic coated pits tagged with fluorescent clathrin or with dynamin on the ventral surface. One of the movies from Tojima et al. (2010; their Supplemental Movie 1) also shows clear examples of a coated pit undergoing retrograde flow; it is likely that this was actin-dependent retrograde flow at the dorsal surface, since its rate was similar to that of F-actin and it decreased in the presence of blebbistatin, a myosin II inhibitor that slows F-actin flow (Tojima et al., 2010). Accumulation of long-lived coated plaques (Kirchhausen, 2009; Saffarian et al., 2009; Grove et al., 2014) on the adherent ventral surfaces of the cell bodies and trailing edges of migrating cells have confounded interpretation of observations in some papers (Nishimura and Kaibuchi, 2007; Fletcher et al., 2012; Mutch et al., 2014). These papers considered colocalization of cargo with the large clathrin spots as direct indication of efficient endocytosis, even though the endocytic efficiency of these larger structures is low compared with the endocytic capacity of the more active and abundant canonical coated pits and vesicles (Saffarian et al., 2009). Careful interpretation of the published images, however, shows clear absence of clathrin or AP2 fluorescent spots at the leading ventral edges of what appear to be migrating Hela, MDCK, and MDA-MB-231cells, respectively (Nishimura and Kaibuchi, 2007; Fletcher et al., 2012; Mutch et al., 2014). All these studies are consistent with the asymmetric formation of coated pits on the dorsal and ventral surfaces at the leading edge of motile cells. An open question is whether a similar membrane flux is present at the leading edges of migrating cells in the more complex, 3D geometry they confront in living tissues.
What could the molecular signals that determine preferential coated pit initiation at the leading edge be? Phosphatidylinositol 4,5-bisphosphate [PI(4,5)P2] is essential for coated pit initiation (for a recent review, see Kirchhausen et al., 2014), and a simple mechanism could be a polarized distribution of PI(4,5)P2. Branched-actin dynamics mediated by Arp2/3 also requires membrane-bound PI(4,5)P2 (for reviews, see Wang et al., 2003; Zhang et al., 2012). In COS-7 cells, Arp2/3 is strongly enriched at the lamellipodia but significantly depleted from the ventral surfaces of the adjacent lamellae (see figure 5F in Zoncu et al., 2007). Migrating neutrophils immunostained with an antibody specific for PI(4,5)P2 likewise showed abundant accumulation at the lamellipodia and minimal signal at the ventral surface of the lamellae (Sharma et al., 2008). Currently, it is not clear why the density of coated pits initiating at the leading edge is higher than at other locations in the cell. Because the leading edge is a site of polarized exocytosis (Hopkins et al., 1994; Gauthier et al., 2009; Osmani et al., 2010), it is possible that activation of clathrin pit formation observed at this region is a response to increased membrane deposition. Such a response was previously shown in HeLa cells exposed to perforin, a pore-forming protein that elicited a membrane-repair response in which lysosomes and endosomes provided their membranes to reseal the damaged membrane (Thiery et al., 2010).
Polarized assembly of actin at the leading edge of migrating cells drives forward movement (Ponti et al., 2004). An early proposal, that membrane deposition by exocytosis would be favored at the front of migrating cells (Abercrombie et al., 1970a,b; Bretscher and Thomson, 1983), lost support from somewhat later observations that rearward migration of beads adsorbed to the extracellular dorsal surfaces at the front of migrating cells was explained by attachment of the beads to membrane proteins interacting with actin polymers moving centripetally (Sheetz et al., 1989). Similarly, engulfed beads could be driven backward by cytosolic flow (Caspi et al., 2001). Membrane deposition at the leading edge is supported, however, by observations that lipid-attached beads moved along the extracellular surfaces of axons from the growth cones to the cell bodies of growing neurons (Dai and Sheetz, 1995).
Cells balance endocytic and exocytic vesicular traffic to achieve stringent control of surface area during interphase (Boucrot and Kirchhausen, 2007; Tacheva-Grigorova et al., 2013). The polarized absence of coated pits at the front of migrating cells, or at specialized protruding regions such as growth cones in neurons and lamellipodia in migrating T-cell lymphocytes, if coupled with local exocytosis (e.g., preferential deposition of transferrin receptor at the leading edge of migrating A431 cells; Hopkins et al., 1994), the preferential delivery of Cdc42-containing vesicles to the leading edges of migrating astrocytes (Osmani et al., 2010) or of up to 50% of the plasma membrane by GPI-anchored protein compartments in spreading cells (Gauthier et al., 2009) would ensure, in a simple way, the net arrival of membrane required to accommodate forward movement. The asymmetry of membrane deposition during migration appears to be mainly driven by a regulated increase of exocytosis, as a simple local block of all forms of endocytosis would not suffice. Extension of a lamellipodium for 10 s at a rate of 10 nm/s with a 10-μm width would require a net deposition of 106 nm2. This amount is equivalent to ∼30 coated vesicles of 100 nm in diameter. During the same period, a patch of membrane of the same size would have generated only 0.07 coated vesicles, assuming a formation rate of ∼0.4 coated vesicles/106 nm2-min. This estimate holds even if one assumes that the clathrin endocytic pathway provides the main entry route and ignores the contribution of other forms of endocytosis, including the endophilin-dependent and clathrin-independent carriers associated with local membrane deformation and tubule generation (Kirkham et al., 2005; Howes et al., 2010; Boucrot et al., 2014; Renard et al., 2014), and other less precisely defined processes linked to the formation of the larger membrane invaginations associated with macropinocytosis (Liberali et al., 2008).
A more balanced endocytic and exocytic membrane flow in the remaining parts of these cells (including the cell body and the dorsal surface of the protrusion) can establish overall polarity, as proposed in models invoking net membrane deposition at the leading edge (for a recent review, see Bretscher, 2014). Polarized absence of endocytosis at the leading edge does not appear to be sufficient, however, to provide the membrane needed for forward motion. Instead, polarized activation of exocytosis seems to be required. Our real-time observations, demonstrating the relatively small contribution of coated vesicles to the membrane flow at the leading edge, provide further support to such models.
Our use of real-time 3D visualization with high spatial and temporal resolution allowed us to establish unequivocally the strong asymmetry of coated pit formation at the closely apposed dorsal and ventral surfaces at the leading edges of migrating cells. We envisage expanded use of the 3D imaging, capitalizing on the enhanced spatial and temporal resolution of the lattice light-sheet microscope to study subcellular events such as those described here in the more natural 3D environment of organoids and multicellular organisms.
MATERIALS AND METHODS
Reagents, cell culture, and transfections
U373 human glioblastoma cells stably expressing σ2-EGFP were grown in DMEM containing 10% fetal calf serum (FCS), penicillin, and streptomycin. Transient expression of rat Tomato-LCa (Massol et al., 2006; Saffarian et al., 2009) and LifeAct-mCherry was carried out by transfection with Lipofectamine 2000 (Invitrogen) in Optimem (Life Technologies, Grand Island, NY) according to the manufacturers' instructions. SUM159 human breast carcinoma cells were gene-edited to replace both alleles of the σ2 subunit of AP2 with σ2 fused at its C-terminus to EGFP using a transcription activator-like effector nuclease (TALEN)-based protocol (Sanjana et al., 2012; Cocucci et al., 2014). Here we used clone D8, herewith named SUM-AP2.1 (unpublished data). Cells were analyzed 24 h after transfection.
Live-cell spinning-disk confocal microscopy imaging
Approximately 1 × 10⁵ U373 cells were plated 16 h before imaging on 25-mm (diameter) no. 1.5 glass coverslips. The imaging medium was phenol red–free DMEM supplemented with 10% FCS and 20 mM HEPES (pH 7.4). For imaging (Kural et al., 2012), the coverslips were placed on a temperature-controlled 5% CO2 humidified chamber (20/20 Technology, Wilmington, NC) mounted on the piezo-electric driven stage of a Mariana imaging system (Intelligent Imaging Innovations, 3I, Denver, CO) based on an Axiovert 200M inverted microscope (Carl Zeiss, Thornwood, NY), a CSU-X1 spinning-disk confocal unit (Yokogawa Electric Corporation, Tokyo, Japan), a spherical aberration-correction device (SAC; Infinity Photo-Optical, Boulder, CO), and a 63× objective lens (Plan-Apochromat, NA 1.4, Carl Zeiss). The SAC was placed between the oil-based objective lens and the camera to resolve the spherical aberration introduced by the refractive index mismatch between living cells and the glass optics. Three-dimensional time series were obtained using Slidebook 5 (Intelligent Imaging Innovations).
Live-cell lattice light-sheet microscopy imaging
Cells were plated ∼5 h before imaging on 5-mm (diameter) no. 1.5 glass coverslips and were imaged at 37°C in phenol red–free DMEM supplemented with 10% FCS and 20 mM HEPES (pH 7.4) in the absence of CO2. Three-dimensional lattice light-sheet microscopy was performed using the instruments described in Chen et al. (2014). Cells were scanned incrementally through a 15-μm-long light-sheet in 210-nm steps using a fast piezoelectric flexure stage equivalent to ∼210 nm with respect to the detection objective and were imaged using an sCMOS camera (Orca Flash 4.0; Hamamatsu, Bridgewater, NJ). Composite volumetric data (Figure 6) for cells 1 and 2 were from time series of 500 and 343 s in duration obtained using 15- and 30-ms exposures/frame and stacks of 101 and 85 planes acquired every 3.5 s. Composite volumetric data for cells 3–6 were from time series of 210 s in duration obtained using 20-ms (cells 3–5) or 25-ms (cell 6) exposures/frame and stacks of 79–91 planes acquired every 2.1 s.
Migration speed of the leading edge and 3D tracking
The migration speed of the leading edge of a lamellipodium was determined using Matlab 7 (Mathworks, Natick, MA) from the change in location of the median position of the lamellipodium along the direction of migration; the lamellipodium was visualized in kymographs representing the maximum projection of the images corrected by the background fluorescence. The average migration speed of the lamellipodium was calculated from three kymographs obtained from different locations along its width.
The 3D location of diffraction-limited fluorescence spots corresponding to coated pits and vesicles was determined from their locations along the x and y axes and along the z-axis (from the z-stacks) for each time point in the movies (Kural et al., 2012; Kural and Kirchhausen, 2012).
Supplementary Material
Acknowledgments
We thank Eric Marino for maintaining the Imaging Resource used in this study, Patrick Reeves for generating the expression plasmid for LifeAct, and members of our laboratory for helpful discussions. C.K. was a recipient of a Helen Hay Whitney Foundation Fellowship. This work was supported in part by National Institutes of Health grants GM-075252 (to T.K.) and U54 AI057159 (New England Regional Center of Excellence in Biodefense and Emerging Infectious Disease, Core Imaging Facility). B.-C.C., W.R.L, and E.B. were funded by the Howard Hughes Medical Institute. T.K. gratefully acknowledges support from the Janelia Visitor Program.
Abbreviations used:
- 3D
three-dimensional
- FCS
fetal calf serum
- SAC
spherical aberration-correction device
- Tomato-LCa
clathrin light chain A fused at its N-terminus to Tomato.
Footnotes
This article was published online ahead of print in MBoC in Press (http://www.molbiolcell.org/cgi/doi/10.1091/mbc.E15-01-0055) on April 7, 2015.
*Present address: Research Center for Applied Sciences, Academia Sinica, Taipei 11529, Taiwan.
REFERENCES
- Abercrombie M, Heaysman JE, Pegrum SM. The locomotion of fibroblasts in culture. I. Movements of the leading edge. Exp Cell Res. 1970a;59:393–398. doi: 10.1016/0014-4827(70)90646-4. [DOI] [PubMed] [Google Scholar]
- Abercrombie M, Heaysman JE, Pegrum SM. The locomotion of fibroblasts in culture. III. Movements of particles on the dorsal surface of the leading lamella. Exp Cell Res. 1970b;62:389–398. doi: 10.1016/0014-4827(70)90570-7. [DOI] [PubMed] [Google Scholar]
- Aguet F, Antonescu CN, Mettlen M, Schmid SL, Danuser G. Advances in analysis of low signal-to-noise images link dynamin and AP2 to the functions of an endocytic checkpoint. Dev Cell. 2013;26:279–291. doi: 10.1016/j.devcel.2013.06.019. [DOI] [PMC free article] [PubMed] [Google Scholar]
- Bitsikas V, Corrêa IR, Nichols BJ. Clathrin-independent pathways do not contribute significantly to endocytic flux. Elife. 2014;3:e03970. doi: 10.7554/eLife.03970. [DOI] [PMC free article] [PubMed] [Google Scholar]
- Boucrot E, Ferreira APA, Almeida-Souza L, Debard S, Vallis Y, Howard G, Bertot L, Sauvonnet N, McMahon HT. Endophilin marks and controls a clathrin-independent endocytic pathway. Nature. 2014;517:460–465. doi: 10.1038/nature14067. [DOI] [PubMed] [Google Scholar]
- Boucrot E, Kirchhausen T. Endosomal recycling controls plasma membrane area during mitosis. Proc Natl Acad Sci USA. 2007;104:7939–7944. doi: 10.1073/pnas.0702511104. [DOI] [PMC free article] [PubMed] [Google Scholar]
- Bretscher MS. Asymmetry of single cells and where that leads. Annu Rev Biochem. 2014;83:275–289. doi: 10.1146/annurev-biochem-060713-035813. [DOI] [PubMed] [Google Scholar]
- Bretscher MS, Thomson JN. Distribution of ferritin receptors and coated pits on giant HeLa cells. EMBO J. 1983;2:599–603. doi: 10.1002/j.1460-2075.1983.tb01469.x. [DOI] [PMC free article] [PubMed] [Google Scholar]
- Burnette DT, Shao L, Ott C, Pasapera AM, Fischer RS, Baird MA, Der Loughian C, Delanoe-Ayari H, Paszek MJ, Davidson MW, et al. A contractile and counterbalancing adhesion system controls the 3D shape of crawling cells. J Cell Biol. 2014;205:83–96. doi: 10.1083/jcb.201311104. [DOI] [PMC free article] [PubMed] [Google Scholar]
- Caspi A, Yeger O, Grosheva I, Bershadsky AD, Elbaum M. A new dimension in retrograde flow: centripetal movement of engulfed particles. Biophys J. 2001;81:1990–2000. doi: 10.1016/S0006-3495(01)75849-3. [DOI] [PMC free article] [PubMed] [Google Scholar]
- Chen B-C, Legant WR, Wang K, Shao L, Milkie DE, Davidson MW, Janetopoulos C, Wu XS, Hammer JA, Liu Z, et al. Lattice light-sheet microscopy: imaging molecules to embryos at high spatiotemporal resolution. Science. 2014;346:1257998. doi: 10.1126/science.1257998. [DOI] [PMC free article] [PubMed] [Google Scholar]
- Cocucci E, Aguet F, Boulant S, Kirchhausen T. The first five seconds in the life of a clathrin-coated pit. Cell. 2012;150:495–507. doi: 10.1016/j.cell.2012.05.047. [DOI] [PMC free article] [PubMed] [Google Scholar]
- Cocucci E, Gaudin R, Kirchhausen T. Dynamin recruitment and membrane scission at the neck of a clathrin-coated pit. Mol Biol Cell. 2014;25:3595–3609. doi: 10.1091/mbc.E14-07-1240. [DOI] [PMC free article] [PubMed] [Google Scholar]
- Cramer LP. Molecular mechanism of actin-dependent retrograde flow in lamellipodia of motile cells. Front Biosci. 1997;2:d260–d270. doi: 10.2741/a189. [DOI] [PubMed] [Google Scholar]
- Dai J, Sheetz MP. Axon membrane flows from the growth cone to the cell body. Cell. 1995;83:693–701. doi: 10.1016/0092-8674(95)90182-5. [DOI] [PubMed] [Google Scholar]
- Davis BH, Walter RJ, Pearson CB, Becker EL, Oliver JM. Membrane activity and topography of F-Met-Leu-Phe-treated polymorphonuclear leukocytes. Acute and sustained responses to chemotactic peptide. Am J Pathol. 1982;108:206–216. [PMC free article] [PubMed] [Google Scholar]
- Ehrlich M, Boll W, van Oijen A, Hariharan R, Chandran K, Nibert ML, Kirchhausen T. Endocytosis by random initiation and stabilization of clathrin-coated pits. Cell. 2004;118:591–605. doi: 10.1016/j.cell.2004.08.017. [DOI] [PubMed] [Google Scholar]
- Fletcher SJ, Poulter NS, Haining EJ, Rappoport JZ. Clathrin-mediated endocytosis regulates occludin, and not focal adhesion, distribution during epithelial wound healing. Biol Cell. 2012;104:238–256. doi: 10.1111/boc.201100004. [DOI] [PubMed] [Google Scholar]
- Gauthier NC, Rossier OM, Mathur A, Hone JC, Sheetz MP. Plasma membrane area increases with spread area by exocytosis of a GPI-anchored protein compartment. Mol Biol Cell. 2009;20:3261–3272. doi: 10.1091/mbc.E09-01-0071. [DOI] [PMC free article] [PubMed] [Google Scholar]
- Grove J, Metcalf DJ, Knight AE, Wavre-Shapton ST, Sun T, Protonotarios ED, Griffin LD, Lippincott-Schwartz J, Marsh M. Flat clathrin lattices: stable features of the plasma membrane. Mol Biol Cell. 2014;25:3581–3594. doi: 10.1091/mbc.E14-06-1154. [DOI] [PMC free article] [PubMed] [Google Scholar]
- Hopkins CR, Gibson A, Shipman M, Strickland DK, Trowbridge IS. In migrating fibroblasts, recycling receptors are concentrated in narrow tubules in the pericentriolar area, and then routed to the plasma membrane of the leading lamella. J Cell Biol. 1994;125:1265–1274. doi: 10.1083/jcb.125.6.1265. [DOI] [PMC free article] [PubMed] [Google Scholar]
- Howes MT, Kirkham M, Riches J, Cortese K, Walser PJ, Simpson F, Hill MM, Jones A, Lundmark R, Lindsay MR, et al. Clathrin-independent carriers form a high capacity endocytic sorting system at the leading edge of migrating cells. J Cell Biol. 2010;190:675–691. doi: 10.1083/jcb.201002119. [DOI] [PMC free article] [PubMed] [Google Scholar]
- Keen JH, Gaidarov I, Santini F, Warren RA. Spatial control of coated-pit dynamics in living cells. Nat Cell Biol. 1999;1:1–7. doi: 10.1038/8971. [DOI] [PubMed] [Google Scholar]
- Kirchhausen T. Imaging endocytic clathrin structures in living cells. Trends Cell Biol. 2009;19:596–605. doi: 10.1016/j.tcb.2009.09.002. [DOI] [PMC free article] [PubMed] [Google Scholar]
- Kirchhausen T, Owen D, Harrison SC. Molecular structure, function, and dynamics of clathrin-mediated membrane traffic. Cold Spring Harb Perspect Biol. 2014;6:a016725. doi: 10.1101/cshperspect.a016725. [DOI] [PMC free article] [PubMed] [Google Scholar]
- Kirkham M, Fujita A, Chadda R, Nixon SJ, Kurzchalia TV, Sharma DK, Pagano RE, Hancock JF, Mayor S, Parton RG. Ultrastructural identification of uncoated caveolin-independent early endocytic vehicles. J Cell Biol. 2005;168:465–476. doi: 10.1083/jcb.200407078. [DOI] [PMC free article] [PubMed] [Google Scholar]
- Kural C, Kirchhausen T. Live-cell imaging of clathrin coats. Methods Enzymol. 2012;505:59–80. doi: 10.1016/B978-0-12-388448-0.00012-7. [DOI] [PMC free article] [PubMed] [Google Scholar]
- Kural C, Tacheva-Grigorova SK, Boulant S, Cocucci E, Baust T, Duarte D, Kirchhausen T. Dynamics of intracellular clathrin/AP1- and clathrin/AP3-containing carriers. Cell Rep. 2012;2:1111–1119. doi: 10.1016/j.celrep.2012.09.025. [DOI] [PMC free article] [PubMed] [Google Scholar]
- Liberali P, Kakkonen E, Turacchio G, Valente C, Spaar A, Perinetti G, Böckmann RA, Corda D, Colanzi A, Marjomaki V, Luini A. The closure of Pak1-dependent macropinosomes requires the phosphorylation of CtBP1/BARS. EMBO J. 2008;27:970–981. doi: 10.1038/emboj.2008.59. [DOI] [PMC free article] [PubMed] [Google Scholar]
- Massol RH, Boll W, Griffin AM, Kirchhausen T. A burst of auxilin recruitment determines the onset of clathrin-coated vesicle uncoating. Proc Natl Acad Sci USA. 2006;103:10265–10270. doi: 10.1073/pnas.0603369103. [DOI] [PMC free article] [PubMed] [Google Scholar]
- Merrifield CJ, Feldman ME, Wan L, Almers W. Imaging actin and dynamin recruitment during invagination of single clathrin-coated pits. Nat Cell Biol. 2002;4:691–698. doi: 10.1038/ncb837. [DOI] [PubMed] [Google Scholar]
- Mutch LJ, Howden JD, Jenner EPL, Poulter NS, Rappoport JZ. Polarised clathrin-mediated endocytosis of EGFR during chemotactic invasion. Traffic. 2014;15:648–664. doi: 10.1111/tra.12165. [DOI] [PMC free article] [PubMed] [Google Scholar]
- Nishimura T, Fukata Y, Kato K, Yamaguchi T, Matsuura Y, Kamiguchi H, Kaibuchi K. CRMP-2 regulates polarized Numb-mediated endocytosis for axon growth. Nat Cell Biol. 2003;5:819–826. doi: 10.1038/ncb1039. [DOI] [PubMed] [Google Scholar]
- Nishimura T, Kaibuchi K. Numb controls integrin endocytosis for directional cell migration with aPKC and PAR-3. Dev Cell. 2007;13:15–28. doi: 10.1016/j.devcel.2007.05.003. [DOI] [PubMed] [Google Scholar]
- Osmani N, Peglion F, Chavrier P, Etienne-Manneville S. Cdc42 localization and cell polarity depend on membrane traffic. J Cell Biol. 2010;191:1261–1269. doi: 10.1083/jcb.201003091. [DOI] [PMC free article] [PubMed] [Google Scholar]
- Perrais D, Merrifield CJ. Dynamics of endocytic vesicle creation. Dev Cell. 2005;9:581–592. doi: 10.1016/j.devcel.2005.10.002. [DOI] [PubMed] [Google Scholar]
- Planchon TA, Gao L, Milkie DE, Davidson MW, Galbraith JA, Galbraith CG, Betzig E. Rapid three-dimensional isotropic imaging of living cells using Bessel beam plane illumination. Nat Methods. 2011;8:417–423. doi: 10.1038/nmeth.1586. [DOI] [PMC free article] [PubMed] [Google Scholar]
- Ponti A, Machacek M, Gupton SL, Waterman-Storer CM, Danuser G. Two distinct actin networks drive the protrusion of migrating cells. Science. 2004;305:1782–1786. doi: 10.1126/science.1100533. [DOI] [PubMed] [Google Scholar]
- Rappoport JZ, Simon SM. Real-time analysis of clathrin-mediated endocytosis during cell migration. J Cell Sci. 2003;116:847–855. doi: 10.1242/jcs.00289. [DOI] [PubMed] [Google Scholar]
- Renard H-F, Simunovic M, Lemière J, Boucrot E, Garcia-Castillo MD, Arumugam S, Chambon V, Lamaze C, Wunder C, Kenworthy AK, et al. Endophilin-A2 functions in membrane scission in clathrin-independent endocytosis. Nature. 2014;517:493–496. doi: 10.1038/nature14064. [DOI] [PMC free article] [PubMed] [Google Scholar]
- Saffarian S, Cocucci E, Kirchhausen T. Distinct dynamics of endocytic clathrin-coated pits and coated plaques. PLoS Biol. 2009;7:e1000191. doi: 10.1371/journal.pbio.1000191. [DOI] [PMC free article] [PubMed] [Google Scholar]
- Saffarian S, Kirchhausen T. Differential evanescence nanometry: live-cell fluorescence measurements with 10-nm axial resolution on the plasma membrane. Biophys J. 2008;94:2333–2342. doi: 10.1529/biophysj.107.117234. [DOI] [PMC free article] [PubMed] [Google Scholar]
- Salmon WC, Adams MC, Waterman-Storer CM. Dual-wavelength fluorescent speckle microscopy reveals coupling of microtubule and actin movements in migrating cells. J Cell Biol. 2002;158:31–37. doi: 10.1083/jcb.200203022. [DOI] [PMC free article] [PubMed] [Google Scholar]
- Samaniego R, Sanchez-Martin L, Estecha A, Sanchez-Mateos P. Rho/ROCK and myosin II control the polarized distribution of endocytic clathrin structures at the uropod of moving T lymphocytes. J Cell Sci. 2007;120:3534–3543. doi: 10.1242/jcs.006296. [DOI] [PubMed] [Google Scholar]
- Sanjana NE, Cong L, Zhou Y, Cunniff MM, Feng G, Zhang F. A transcription activator-like effector toolbox for genome engineering. Nat Protoc. 2012;7:171–192. doi: 10.1038/nprot.2011.431. [DOI] [PMC free article] [PubMed] [Google Scholar]
- Sharma VP, DesMarais V, Sumners C, Shaw G, Narang A. Immunostaining evidence for PI(4,5)P2 localization at the leading edge of chemoattractant-stimulated HL-60 cells. J Leukoc Biol. 2008;84:440–447. doi: 10.1189/jlb.0907636. [DOI] [PMC free article] [PubMed] [Google Scholar]
- Sheetz MP, Turney S, Qian H, Elson EL. Nanometre-level analysis demonstrates that lipid flow does not drive membrane glycoprotein movements. Nature. 1989;340:284–288. doi: 10.1038/340284a0. [DOI] [PubMed] [Google Scholar]
- Tacheva-Grigorova SK, Santos AJM, Boucrot E, Kirchhausen T. Clathrin-mediated endocytosis persists during unperturbed mitosis. Cell Rep. 2013;4:659–668. doi: 10.1016/j.celrep.2013.07.017. [DOI] [PMC free article] [PubMed] [Google Scholar]
- Taylor MJ, Perrais D, Merrifield CJ. A high precision survey of the molecular dynamics of mammalian clathrin-mediated endocytosis. PLoS Biol. 2011;9:e1000604. doi: 10.1371/journal.pbio.1000604. [DOI] [PMC free article] [PubMed] [Google Scholar]
- Thiery J, Keefe D, Saffarian S, Martinvalet D, Walch M, Boucrot E, Kirchhausen T, Lieberman J. Perforin activates clathrin- and dynamin-dependent endocytosis, which is required for plasma membrane repair and delivery of granzyme B for granzyme-mediated apoptosis. Blood. 2010;115:1582–1593. doi: 10.1182/blood-2009-10-246116. [DOI] [PMC free article] [PubMed] [Google Scholar]
- Tojima T, Itofusa R, Kamiguchi H. Asymmetric clathrin-mediated endocytosis drives repulsive growth cone guidance. Neuron. 2010;66:370–377. doi: 10.1016/j.neuron.2010.04.007. [DOI] [PubMed] [Google Scholar]
- Ulrich TA, de Juan Pardo EM, Kumar S. The mechanical rigidity of the extracellular matrix regulates the structure, motility, and proliferation of glioma cells. Cancer Res. 2009;69:4167–4174. doi: 10.1158/0008-5472.CAN-08-4859. [DOI] [PMC free article] [PubMed] [Google Scholar]
- Wang YJ, Wang J, Sun H-Q, Martinez M, Sun YX, Macia E, Kirchhausen T, Albanesi JP, Roth MG, Yin HL. Phosphatidylinositol 4 phosphate regulates targeting of clathrin adaptor AP-1 complexes to the Golgi. Cell. 2003;114:299–310. doi: 10.1016/s0092-8674(03)00603-2. [DOI] [PubMed] [Google Scholar]
- Watts C, Marsh M. Endocytosis: what goes in and how. J Cell Sci. 1992;103:1–8. doi: 10.1242/jcs.103.1.1a. [DOI] [PubMed] [Google Scholar]
- Zhang L, Mao YS, Janmey PA, Yin HL. Phosphatidylinositol 4, 5 bisphosphate and the actin cytoskeleton. Subcell Biochem. 2012;59:177–215. doi: 10.1007/978-94-007-3015-1_6. [DOI] [PubMed] [Google Scholar]
- Zoncu R, Perera RM, Sebastian R, Nakatsu F, Chen H, Balla T, Ayala G, Toomre D, De Camilli PV. Loss of endocytic clathrin-coated pits upon acute depletion of phosphatidylinositol 4,5-bisphosphate. Proc Natl Acad Sci USA. 2007;104:3793–3798. doi: 10.1073/pnas.0611733104. [DOI] [PMC free article] [PubMed] [Google Scholar]
Associated Data
This section collects any data citations, data availability statements, or supplementary materials included in this article.