

Abstract
The use of propagation invariant Bessel beams has enabled high-resolution subcellular light sheet fluorescence microscopy. However, the energy within the concentric side lobe structure of Bessel beams increases significantly with propagation length, generating unwanted out-of-focus fluorescence that enforces practical limits on the imaging field of view size. Here, we present a light sheet fluorescence microscope that achieves 390 nm isotropic resolution and high optical sectioning strength (i.e., out-of-focus blur is strongly suppressed) over large field of views, without the need for structured illumination or deconvolution-based postprocessing. We demonstrate simultaneous dual-color, high-contrast, and high-dynamic-range time-lapse imaging of migrating cells in complex three-dimensional microenvironments, three-dimensional tracking of clathrin-coated pits, and long-term imaging spanning >10 h and encompassing >2600 time points.
Introduction
Light sheet fluorescence microscopy (LSFM), as a result of its low illumination intensities and highly parallel fluorescence detection, has offered unprecedented insight into photosensitive biological processes (1,2). Most commonly in LSFM, a Gaussian beam propagating normal to the detection axis illuminates the sample, and the resulting fluorescence is imaged onto a scientific camera. The use of Gaussian optics results in an inherent tradeoff between the field of view (FOV), characterized by the Rayleigh length of the beam, and Z-resolution (i.e., along the optical axis of the detection objective), as characterized by the beam waist. Thus, a high Z-resolution of ∼300 nm can only be achieved for a small FOV of ∼2 μm (3), and the Z-resolution rapidly degrades to several microns for a FOV >50 μm. Attempts to extend the FOV without compromising the Z-resolution have included the axial (i.e., the optical axis of the excitation objective) superposition of two light sheets (4,5) and tiling of multiple image stacks with axially displaced light sheets (6). These techniques however come at the cost of more out-of-focus blur or a reduced volumetric image acquisition rate. Alternatively, the fusion of two orthogonal image views enabled isotropic resolution throughout a ∼50 μm FOV (7). However, this also decreases the volumetric image acquisition rate twofold, and the volumetric reconstruction requires computationally intensive iterative postprocessing (7).
In theory, propagation-invariant beams, including Bessel, Airy, and extended depth of focus, maintain their cross-sectional profile over arbitrarily long distances (8–12). As such, these beams were proposed as a method to decouple the inverse relationship between Z-resolution and FOV. Indeed, several microscopes have successfully used propagation invariant beams to bring subcellular imaging into the realm of LSFM (9,10,13–15). However, in contrast to a Gaussian beam that focuses almost all of the photons into a beam waist, propagation invariant beams have intricate side lobe structures. When such a beam is scanned laterally to synthesize a time-averaged sheet of light (16), the side lobes are incoherently summed and result in a beam skirt that extends beyond the focal plane of the detection objective (10). Furthermore, the beam skirt grows significantly with propagation length (Note S1 and Figs. S1 and S2 in the Supporting Material), generating out-of-focus fluorescence that obscures the in-focus information. Of importance, because the side lobe structure surrounds the beam, out-of-focus blur cannot be completely rejected by confocal descanning alone (9,17).
More recently, a coherent superposition of Bessel beams was shown to reduce the side lobe energy above and below the light sheet, adding an additional parameter (beam spacing) with which Z-resolution and illumination confinement for a given FOV can be balanced (14). This technique, referred to as Lattice LSFM, successfully imaged samples ranging from single molecules to developing embryos. Nevertheless, even for a 15-μm long beam (full width at half-maximum), the superposition pattern that provided the highest Z-resolution (370 nm) suffered from poor illumination confinement, and conversely, the superposition pattern that provided the highest illumination confinement resulted in poor Z-resolution (∼1.1 μm, Figs. S1 and S2). Thus, the most successful applications of high-resolution LSFM have employed short beams that reduce the beam skirt for thin samples on glass coverslips (10,13,14).
Many biological studies are incompatible with glass substrates and would benefit from high-resolution imaging throughout large volumes. One prominent example includes biomimetic, collagenous three-dimensional (3D) microenvironments where force can be transmitted >200 μm and directly modulate cellular phenotype (18,19). Furthermore, in 3D, cells adopt a variety of morphodynamic states (e.g., mesenchymal and amoeboid), and can migrate in any spatial dimension (20). As such, an ideal LSFM would be able to image the critical morphodynamic and subcellular features with diffraction-limited Z-resolution, but with a FOV that can capture biologically relevant length scales for cellular migration and/or force transmission.
Currently, the only technology capable of imaging arbitrarily large FOVs with high illumination confinement and resolution is two-photon Bessel beam LSFM (10,21). Unfortunately, this technology is limited to a handful of fluorophores with large two-photon cross sections, and suffers from accelerated photodamage (22). To our knowledge, no LSFM technology employing propagation invariant beams and linear optics (i.e., one-photon excitation) achieves similar imaging performance for large FOVs. Although most one-photon high-resolution LSFM techniques rely on deconvolution methods or structured illumination to discard out-of-focus fluorescence (7,9–11,13,14), it is questionable if such approaches accurately deal with overwhelming blur. Furthermore, deconvolution algorithms make explicit approximations regarding experimental noise, shift invariance, signal discretization, local image smoothness, and/or point spread function (PSF) characteristics (23). Unfortunately, these approximations impact the statistics of the deconvolved data, limiting their use in advanced, quantitative imaging techniques (e.g., fluorescence resonance energy transfer, fluorescence lifetime imaging microscopy, particle tracking, etc.), and these issues are exacerbated under low signal/noise (SNR) conditions where precise statistical modeling of the raw data is required (24,25).
Here, we present a novel, to our knowledge, one-photon LSFM method that provides simultaneous multicolor and isotropic 390 nm resolution throughout a 216 × 162 × 100 μm imaging volume. The microscope scans a light sheet in its propagation direction synchronously with a two-dimensional (2D) array of active pixels to effectively suppress out-of-focus fluorescence, enabling deconvolution-free, structured illumination-free, optical sectioning. Due to its beam scanning geometry, we refer to this technique as axially swept light sheet microscopy (ASLM). We describe the design of the microscope, its performance on densely labeled specimens, and conclude with dynamic 3D particle tracking of diffraction-limited structures.
Materials and Methods
Detailed information pertaining to the design, construction, and operation of the microscope, as well as cell maintenance, sample preparation, image analysis, and optical simulations, are provided in the Supporting Materials.
Results
ASLM concept
The concept of ASLM is shown in Fig. 1 A. Here, a laser line focus (e.g., a Gaussian beam that has been shaped into a line with a cylindrical lens) illuminates the sample from the side and a widefield image from an orthogonal viewing direction is acquired. As an example, Fig. 1 B shows an image of fluorescently labeled rat tail collagen acquired in this illumination geometry. A narrow strip of in-focus fluorescence is flanked by out-of-focus blur, with the width of the in-focus region determined by two Rayleigh lengths (LR) of the beam. In Gaussian optics, the Rayleigh length is defined as the propagation distance, measured from the waist of the beam, which is necessary for the beam radius to increase by . Although there are substantial differences in the intensity distribution of a high-NA laser focus and a Gaussian beam (26), we found that the Rayleigh length is a reliable estimate for the useful range of line foci discussed here.
Figure 1.

Optical principle of ASLM. (A) The sample is illuminated with a laser propagating along the Y-direction, which is focused to a diffraction-limited line, and fluorescence is collected orthogonally on a camera. Only the pixels that image the beam waist are active. LR is the Rayleigh length of the beam. The axial position of the illumination beam is swept in the Y-direction synchronously with a 2D array of active pixels to generate a large FOV image with beam-waist limited axial resolution. (B) Image of fluorescently labeled collagen using an illumination NA of 0.8 to produce a stationary line focus. Scale bar 10 μm. (C) Image of fluorescently labeled collagen with beam scanning and synchronous active pixel readout. Scale bar 10 μm. (D) Image of fluorescently labeled collagen using an illumination NA of 0.29 to produce a stationary line focus. (E) Image of fluorescently labeled collagen with beam scanning and synchronous active pixel readout. Scale bar 10 μm. To see this figure in color, go online.
In theory, if one could restrict the active pixels on the camera to the in-focus region only, and scan these pixels synchronously with the beam along its propagation direction, an arbitrarily large field of view could be imaged with minimal out-of-focus blur. This is commonly referred to as optical sectioning, which is the ability to robustly reject fluorescence arising from outside the focal plane. This configuration has to be contrasted to confocal microscopy, where illumination above and below the focal plane triggers fluorescence that is incompletely rejected by the confocal pinhole. Furthermore, because the in-focus region is imaged onto a 2D array of active pixels in a widefield fashion, this method offers significantly greater parallelization than laser scanning or laser line scanning confocal microscopes.
Two recent innovations enable images to be acquired in this manner. 1) Because of the flexible architecture of scientific complementary metal-oxide semiconductor cameras, a narrow strip of active pixels can be swept across the camera at a user-specified velocity (27). 2) The axial position of the beam can be rapidly and deterministically modulated with an aberration-free remote focusing method (28,29). Together, these two technologies enable large FOV, high-resolution LSFM imaging with high optical sectioning strength (Fig. 1 C). Alternatively, for cameras with nonflexible readout architectures (e.g., electron-multiplied charge-coupled devices), a physical descan/rescan mechanism could be implemented (30).
ASLM belongs to a subclass of LSFM techniques known as digitally scanned light sheet microscopy (DSLM) (16). In DSLM, a beam of light is rapidly scanned laterally in the focal plane of the detection objective to form a time-averaged light sheet during one camera exposure. The main difference between ASLM and previously published DSLM approaches is that we do not scan our beam laterally, but axially, to create a time-averaged light sheet. Of importance, this modification decouples the relationship between the image field of view, optical sectioning, and Z-resolution.
In ASLM, the final image may be conceptualized both theoretically and practically as the superposition of many small and overlapping light sheet images, each with the beam displaced in its propagation direction by a finite distance. The role of the 2D active pixel array is to select the bounds of each instantaneous light sheet that is integrated into the final image. Here, we define the resulting averaged light sheet as the effective illumination profile. Of importance, ASLM is not limited to high-NA line foci but can also be used with larger, low-NA light sheets, of which an example is shown in Fig. 1 D. Provided that the instantaneous light sheet remains within the depth of focus of the detection objective, the final image will maintain high optical sectioning strength over theoretically arbitrary distances (Fig. 1 E).
A diagram of the microscope layout can be found in Fig. 2 A. Here, a diffraction-limited line is focused onto a piezo-actuated mirror that is located in the focal plane of a remote focusing objective. Scanning the position of this remote focusing mirror by δ generates the exact wavefront necessary to shift the laser focus formed by the excitation objective a distance of 2δ in sample space, while conserving diffraction-limited performance (28,29). A valuable attribute to our optical scheme is that it provides highly uniform illumination in both the X- and Y-dimensions. Uniform illumination in the X-dimension results from using the center of a highly expanded Gaussian beam before focusing it with the cylindrical lens. In contrast, the uniform illumination in the Y-dimension is a unique result of light sheet generation with an extended depth of focus mechanism (8,9). This uniform top-hat illumination is in stark contrast to Bessel beams of finite length that exhibit a Gaussian beam profile in the propagation direction (9).
Figure 2.

Optical layout of the microscope and performance. (A) Simplified scheme of the microscope. HWP, PBS, and QWP are the half-wave plate, polarizing beam splitter, and quarter-wave plate, respectively. (B) Illumination profile for the high-NA (0.80) and (C) low-NA (0.29) line focus. The low-NA mode is achieved by underfilling the back pupil plane of the excitation objective (see Supporting Materials). Data acquired at the intermediate image plane located between the two tube lenses and adjusted for the magnification of the objective. Scale bar 1 μm. (D) Overall PSF (e.g., the product of the effective illumination profile and detection PSF) for the high- and (E) low-NA modes. Scale bar 1 μm. To see this figure in color, go online.
Microscope performance
In this manuscript we use an NA = 0.8 and 0.29 for the high- and low-NA modes, with Rayleigh lengths of 0.62 and 4.88 μm, respectively. The low-NA mode is achieved by truncating the illumination beam with a variable-width slit that is conjugate to the back pupil plane of the excitation objective. It is important to note that the out-of-focus illumination in ASLM increases with the propagation length of the beam in a manner that is similar to one-photon Bessel LSFM (10) and Square Lattice LSFM (14), for the high- and low-NA modes, respectively (Fig. S2). Although ASLM does not detect the out-of-focus illumination, its presence is still undesirable because it could lead to accelerated photobleaching and phototoxicity (31). However, because we can dynamically adjust the FOV by changing the remote focusing mirror scan range, we can tailor the FOV exactly to the length scale of the specimen, which reduces the overall light exposure without sacrificing evenness of illumination (9).
Fig. 2, B and C, compare the profile of the stationary laser line focus as measured in transmission for the high- and low-NA modes. Fig. 2, D and E, show the overall system PSF (e.g., the product of the effective illumination profile times the detection PSF) for ASLM measured with 100 nm fluorescent beads for the high- and low-NA modes. The high-NA mode has a lateral resolution of 380 ± 20 nm (in the XY plane, as measured from the full width at half-maximum) and a Z-resolution of 390 ± 6 nm. For the low-NA mode, the lateral resolution remains unchanged, but the Z-resolution increases to 919 ± 8 nm. With linear deconvolution, both the XY- and Z-resolution in the high-NA mode can be improved to 299 and 316 nm, respectively, but throughout this work we present, raw, nondeconvolved data. Additional imaging results on fluorescent nanospheres are presented in Fig. S3.
To demonstrate the ability of ASLM to image biological samples with isotropic resolution, we imaged live retinal pigment epithelial (RPE-1) cells expressing fluorescent protein fusions of TagRFP-T-β-tubulin and mEmerald-vimentin from their genomic loci (32). Vimentin is a type-III intermediate filament implicated in cytoskeleton organization and is a robust marker of epithelial to mesenchymal transition. For initial experiments, only the vimentin intermediate filaments were imaged. Fig. 3, A and B, show XY and YZ maximum intensity projections (MIP) for a small cluster of RPE-1 cells located within a 3D collagen matrix (see Supporting Materials). Throughout this manuscript cells were imaged at a depth of 100–150 μm within the collagen, which is well within the reach of widefield microscopes (Note S2, Fig. S4). The two views are virtually indistinguishable and provide the same amount of spatial detail, highlighting the isotropic resolution obtained with ASLM. For comparison, we imaged the same type of cells with a commercial two-photon laser scanning confocal microscope, because this is the method of choice for 3D imaging deep within collagen matrices. Confocal images were acquired with identical sampling (160 nm voxel size), albeit with 4× line averaging to improve the SNR. Although the fibers were observed in the lateral view (Fig. 3 C), the Z-resolution of the microscope was insufficient to identify vimentin filaments (Fig. 3 D).
Figure 3.

XY and Z resolving power for cells embedded within a 3D collagen matrix for ASLM and two-photon laser scanning confocal microscopy. (A) XY and (B) YZ MIP of mEmerald-vimentin expressing cells as imaged with ASLM. (C) XY and (D) YZ MIP of similar cells as imaged with a two-photon laser scanning confocal microscope. Scale bar 10 μm.
Next, we compared the optical sectioning power of ASLM with two-photon laser scanning confocal microscopy, and two-photon Bessel beam LSFM. Optical sectioning is defined as the ability to reject light that stems from out-of-focus planes. Generally, optical sectioning is measured with an interface between a fluorescent and a nonfluorescent region. However, creating sharp fluorescent interfaces in a 3D environment is nontrivial due to the strict refractive index matching required for water dipping objectives. Here, we use dense cytosolic labeling within a cell to provide a fluorescent interface between the intra- and extracellular volumes. Fig. 4 A shows a raw YZ slice obtained with the ASLM on a live collagen-embedded MV3 metastatic melanoma cell labeled with cytosolic mNeonGreen (33,34). Despite the dense concentration of fluorophores, the edges at the top and bottom of the cell are very sharp and no blur is visible. Fig. 4, B and C, show raw YZ slices of equivalent MV3 cells obtained with a two-photon laser scanning confocal microscope (4× line average applied) and a digitally scanned two-photon Bessel beam LSFM, respectively. Because of the two-photon excitation, out-of-focus fluorescence is also strongly suppressed. Nevertheless, the edge of the cell is less clearly defined in Z in the two-photon laser scanning confocal microscope and the two-photon Bessel beam LSFM.
Figure 4.
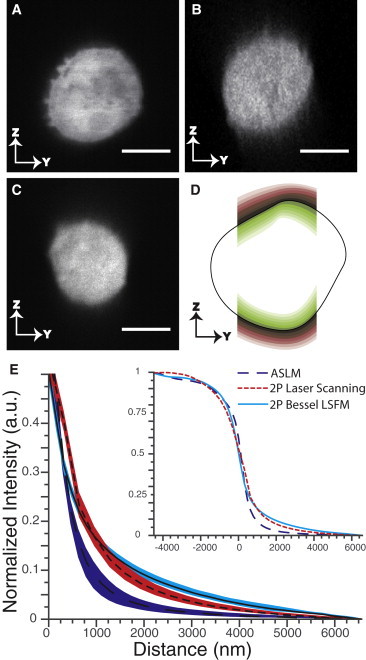
Optical sectioning performance of cells embedded within a 3D collagen matrix for ASLM, two-photon laser scanning confocal microscopy, and two-photon Bessel beam LSFM. (A) Raw YZ slice of a MV3 cell labeled with cytosolic mNeonGreen as imaged by ASLM, (B) two-photon laser scanning confocal microscopy, and (C) two-photon Bessel beam LSFM. Scale bar 10 μm. (D) Illustration of the pixel bands surrounding the cell boundary that were used to measure the optical sectioning strength. (E) Mean (lines) and standard deviation (colored bands) of the spatially averaged edge response in the Z-direction measured for ASLM (N = 5), two-photon Bessel beam LSFM (N = 5), and two-photon laser scanning microscopy (N = 6). Inset shows full axial response.
To measure optical sectioning, we used an unsupervised computer vision analysis that measures the axial intensity variation within a 3D volume. We produced multiple 1-voxel-wide bands within a volume, which encompassed the cell and blur contributions in the Z-direction, as schematically illustrated in Figs. 4 D and S5 and detailed in Note S3 in the Supporting Material. We obtained an approximation of the step response in the Z-direction by averaging the intensity over each band and recentering the line profile according to the obtained sigmoid center. We repeated this measurement for at least five cells under each imaging condition. The results clearly illustrate that ASLM more rapidly reaches background values above and below the cell in Z than the other two techniques (Fig. 4 E). To quantify optical sectioning, we measured the haze ratio, which we define as the integrated signal present above and below the cell normalized to the integrated intracellular signal. ASLM features the lowest haze ratio of 0.05 ± 0.01 (mean and standard deviation), followed by two-photon laser scanning confocal microscopy with 0.07 ± 0.01 and two-photon Bessel beam LSFM with 0.085 ± 0.005.
3D biological imaging
Encouraged by these results, we imaged live MV3 melanoma cells expressing the actin-binding peptide tractin-enhanced green fluorescent protein (EGFP) embedded deep within a 3D collagen matrix (34–36) labeled with DyLight 521. The large volume of 162 × 162 × 100 μm was Nyquist sampled with an isotropic 160 nm voxel size (Fig. 5 A). Because of the long Stokes shift of the collagen label, experiments could be performed in a single-excitation/dual-emission imaging mode. Fig. 5 B shows a MIP in the Y-dimension, generating a ZX cross-sectional view. Collagen fibers are clearly observed, highlighting the excellent Z-resolution of ASLM. The large imaging volume facilitates the observation of multiple cells simultaneously, thus increasing the microscope throughput, and allowing the observation of phenotypic diversity present in the sample. For example, three morphodynamically distinct cellular behaviors are observed in Fig. 5 B: a smooth cellular cortex (Fig. 5 B, Cell 1), active membrane blebbing (Cell 2), and sequestration and reorganization of the collagen matrix (Cell 3). Fig. S6 provides a magnified view of these cells.
Figure 5.

Large volume imaging of MV3 cells labeled with Tractin-EGFP embedded within a collagen matrix labeled with DyLight 521. (A) 3D rendering of the imaging volume spanning 162 × 162 × 100 μm. (B) MIP along the Y-direction through the entire volume. Cell 1 has a smooth cellular cortex, Cell 2 is undergoing active membrane blebbing, and Cell 3 is sequestering the collagen matrix. Detailed views of these three cells are provided in Fig. S6. Scale bar 20 μm.
Next, we evaluated the performance of ASLM in acquiring long-term and simultaneous dual-excitation/dual-emission volumetric imaging of microtubules and vimentin. A population of collagen-embedded RPE-1 cells was imaged throughout a Nyquist sampled 216 × 83 × 100 μm volume over 10 h, encompassing 120 time points and 144,000 raw images (Fig. 6 A). Fig. 6 B shows a MIP along the Y-dimension at the 86th time point, shortly after the transition to an elongated morphology had completed. Fine filamentous features can be observed, demonstrating that the high Z-resolution can be maintained in a complex sample. Interestingly, cells concurrently progressed from a spherical, clustered morphology (Fig. 6 C showing cells in XY at t = 0), to a mesenchymal, elongated morphology (Movie S1 and Fig. 6 D, same area in XY, t = 7 h 10 min). MIP renderings of the whole volume at these two time points can be found in Fig. S7. Just before cell division, the vimentin network rapidly disintegrated into punctate clusters. For example, Fig. 6, E and F, provide single-plane images (in XY) of the vimentin and microtubule networks, respectively, for the cell highlighted in Fig. 6 B. Due to differences in protein expression and label brightness, and because these data were collected in a simultaneous dual-excitation/dual-emission mode, some signal for vimentin is present as bleed-through in the tubulin image (e.g., in the cell periphery). Fig. 6 G provides an overlay, showing the mitotic spindle in green, surrounded by a constellation of punctate vimentin in magenta. After completion of mitosis, the vimentin reassembled into fiber bundles, which can be observed in Movie S1. Thus, ASLM generates raw data with the contrast and optical sectioning necessary to visualize the morphological details of macromolecular assemblies over hours without interfering with cell cycle progression.
Figure 6.

Large volume time-lapse imaging of collagen-embedded RPE-1 cells genomically tagged with mEmerald-vimentin (magenta) and TagRFP-T-β-tubulin (green) over 120 time points and 10 h. (A) 3D rendering of the imaging volume (216 × 83 × 100 μm). (B) MIP along the Y-dimension. Color intensity values were inverted to facilitate observation of small filaments, and a gamma value of 0.8 was applied for the microtubules. Scale bar 20 μm. (C and D) MIPs along the Z-dimension highlighting the transition from an amoeboid to mesenchymal cellular morphology at t = 0 (C) and t = 7 h 10 min (D). (E–G) Single, XY image plane showing raw data from the cell highlighted by the dotted line in (B) showing vimentin (E), microtubules (F), and an image overlay (G). (C–G) Scale bar 10 μm.
Finally, we imaged EGFP-clathrin light chain (CLC) in ARPE cells (retinal pigment epithelial cells from another source, see Supporting Materials). CLC is dynamically incorporated into the clathrin triskelions of assembling vesicular structures, and manifests itself as diffraction-limited signals (25). Here, we imaged clathrin-coated endocytosis in 3D away from any hard surfaces with a temporal resolution of 5–8 s (maximum frame rate ∼10 Hz, see Fig. S8) using the low-NA mode. The maximum frame rate was limited by the piezo actuator. However, alternative actuators have achieved kHz bandwidths and should enable vastly accelerated image acquisition rates (29).
Because of the high optical sectioning capability of ASLM, individual CLC puncta are visible in the raw data despite increased background levels due to a diffuse cytoplasmic distribution of EGFP-CLC (Fig. 7 A). By combining thorough modeling of the diffraction-limited clathrin-coated pits and the noise footprint of the optical setup, a previously published spot detection algorithm (25) provides robust results even at low SNR on raw data (Fig. 7 B, Movie S2). Furthermore, the spatiotemporal resolution was sufficient to perform 3D particle tracking (Fig. 7, C–E, and Movie S3) using the u-track software (37). We show that the signal quality is sufficient to allow for a homogeneous number of tracked CLC puncta throughout the 7 min of acquisition (Fig. 7 F).
Figure 7.
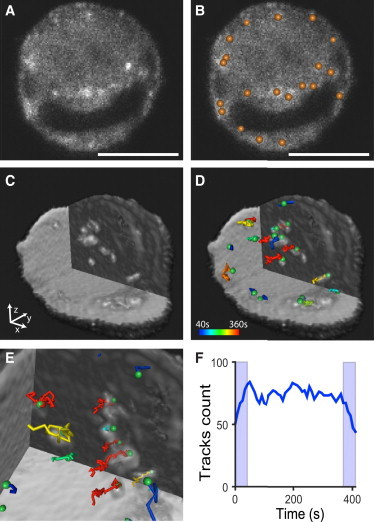
3D particle tracking of EGFP-labeled CLC puncta in collagen-embedded ARPE cells over 50 time points at a temporal resolution of 8.2 s. (A) One raw XY slice through the center of a cell for the 1st time point with (B) the identified CLC puncta labeled with spheres. (C) 3D rendering of the same cell at time point 34 highlighting the interior for easier visualization. (D and E) Superimposed tracks from the 1st to the 34th time point. Color code indicates the lifetime of the track, where blue is the shortest and red the longest lifetime. Among the tracked puncta only long-lived clathrin-coated pits (CCPs) at the cell surface (>40 s) are presented to avoid visual clutter and ensure track consistency. (F) Number of tracks present in 50 consecutive frames. A steady-state value of ∼75 CCPs is observed (the light blue areas represent time windows at the beginning and end of the 50 frames in which the track count is biased by truncation errors). Scale bar 10 μm.
Discussion
We have presented a light sheet microscopy technique, referred to as ASLM, which achieves high-resolution and high optical sectioning throughout large imaging volumes. As a result of its illumination geometry, axial beam scanning, and active pixel readout, ASLM strongly suppresses out-of-focus blur. To our knowledge, ASLM is the only one-photon light sheet technique that theoretically maintains diffraction-limited and isotropic resolution over arbitrarily large imaging volumes. Although we have described a high-NA LSFM that is best suited for subcellular imaging, the principles applied here could also be used to improve the FOV, Z-resolution, and optical sectioning power of classical low-NA LSFMs. This could be particularly useful for neurobiological applications involving cleared tissue, where near-diffraction-limited synaptic features must be visualized on the millimeter scale.
It is tempting to compare ASLM to confocal methods, particularly line scan confocal microscopes. However, major differences exist from both a theoretical and practical perspective. In ASLM, the blur-free region of the illumination beam is imaged in a widefield configuration to a 2D grid of active pixels, which is swept synchronously with the axial position of the illumination beam. In this manuscript, the width of the pixel array was selected to image two Rayleigh lengths of the beam, and was thus 8 and 60 pixels in the high- and low-NA modes, respectively. Because, line scan confocal microscopes use only a linear array of pixels, ASLM offers 8× and 60× greater parallelization (i.e., more efficient use of the applied light dosage) than line scan confocal microscopes. Furthermore, because of the orthogonal beam geometry, ASLM achieves significantly better Z-resolution and optical sectioning than line scanning confocal microscopes. Indeed, for a line scan confocal microscope to achieve similar optical sectioning performance would require the confocal slit to be almost infinitely small, resulting in an unacceptable loss in fluorescence photons. Finally, unlike confocal microscopes in general, ASLM is susceptible to optical scattering and does not improve its resolution by decreasing the number of active pixels. It is thus limited, like all other light sheet microscopes, to a class of reasonably transparent samples.
In comparison with other LSFM techniques, the acquired PSF in ASLM is isotropic and does not contain side lobes or notable blur. As such, numerical deconvolution or structured illumination is unnecessary. Indeed, most high-resolution LSFM methods rely upon structured illumination or linear/nonlinear deconvolution algorithms to eliminate out-of-focus blur and restore optical sectioning (7,9–11,13,14). Additionally, each plane is acquired in a single exposure, and does not require tiling of multiple beam positions (13) or computationally intensive fusion of orthogonal image views (7). Furthermore, ASLM is compatible with simultaneous multicolor illumination (unlike Lattice LSFM), allowing multiple labels to be imaged without temporal delay between acquisitions (14). Simultaneous imaging is necessary to resolve the possibly small temporal delays in molecular activity and localization, which can be used to identify causality between molecular processes (38,39).
Finally, ASLM provides drastically higher illumination uniformity compared to Gaussian or propagation-invariant Bessel beams. This leads to more uniform SNR throughout the imaging volume, greatly facilitating quantitative imaging methods (e.g., fluorescence resonance energy transfer, single particle tracking, etc.). Moreover, the FOV can be dynamically tuned to the region of interest, minimizing unnecessary illumination of the sample (9). Together, these qualities make ASLM the method of choice for quantitative, high-resolution 3D light sheet imaging.
It has been realized that reducing the peak illumination intensity minimizes the deleterious effects of nonlinear phototoxicity and photobleaching mechanisms (14). In this regard, ASLM scales similarly to parallelized Bessel beam LSFM (13). More specifically, the axial length of the laser focus in ASLM is roughly equivalent to the width of five Bessel beam central lobes. Indeed, we have been able to perform live-cell imaging over extended timespans of 10 h and for >2600 time points with modest amounts of bleaching (Movies S4 and S5). Depending upon sample and fluorophore brightness, laser powers used in time-lapse imaging here were varied between ∼360 nW and 18 μW (measured in the pupil of the objective). Nevertheless, Lattice LSFM harnesses an even higher degree of parallelization in illumination and detection and thus promises lower phototoxicity (14). ASLM can be improved in this regard by lengthening the line focus in its propagation direction. This can readily be achieved by lowering the excitation NA, which comes at the cost of Z-resolution. However, a more promising approach represents one-dimensional pupil engineering of the excitation beam with the goal of increasing the aspect ratio of the line focus.
In summary, ASLM provides robust optical sectioning capability and enables unrestricted, imaging over large FOVs with high uniformity. This enabled us to image metastatic melanoma cells, migrating epithelial cells, and clathrin-mediated endocytosis deep within biomimetic 3D collagen matrices. In each case, ASLM immediately revealed a wealth of 3D cell dynamics, clearly demonstrating an immense potential for biological discovery.
Author Contributions
K.M.D., G.D., and R.F. designed the experiments. K.M.D. and R.F. built the microscope and performed the experiments. E.S.W. optimized collagen labeling and provided samples. P.R. designed and performed the optical sectioning quantification and 3D particle detection and tracking. K.M.D., P.R., E.S.W, G.D., and R.F. wrote the article.
Acknowledgments
The Cancer Prevention Research Institute of Texas (CPRIT) funded this research (grant R1225). We thank Dr. Carlos Reis and Dr. Christoph Burckhardt for providing us with cells. We also thank Clay Williams and Nikon Instruments for loaning microscope components. The LabView software employed to control the microscope is used under license from the Howard Hughes Medical Institute’s Janelia Farm Research Campus. The authors are grateful to Gerard Garrelts and Dan Milkie of Coleman technologies for their assistance with the LabView software.
Editor: David Piston.
Footnotes
This is an open access article under the CC BY-NC-ND license (http://creativecommons.org/licenses/by-nc-nd/4.0/).
Supporting Material
ASLM imaging of collagen-embedded RPE cells labeled with vimentin (magenta) and microtubules (green) over 120 time points. A MIP along the Z axis over the entire volume is shown. Scale bar 20 μm.
Clathrin-coated pit detection in 3D. Local maximum intensity projection with a thickness of 2 μm sweeping through the entire volume of the cell. Detected particles are labeled with spheres.
3D rendering and particle tracking of clathrin-mediated endocytosis in collagen-embedded ARPE cells. (Top left) 3D maximum intensity projection rendering. Volume encompassing cube is 20 × 20 × 20 μm. (Top right) Same 3D rendering with particle tracks overlaid. The lifetime of endocytic vesicles is color coded from blue to red, representing shorter- to longer-lived clathrin-coated pits, respectively. (Bottom left) 3D rendering with ray-casting of the same cell, with a portion of the cell made transparent to facilitate visualization of the clathrin-coated pits. (Bottom right) Detailed view of bottom left panel.
Long-time lapse imaging of collagen-embedded RPE-1 cells labeled with Tractin-EGFP spanning 7 h and 29 min and encompassing 600 Z-stacks, acquired in the high-NA mode. Each Z-stack consisted of 251 slices. Cells were continuously imaged with a temporal resolution of 44.9 s per Z-stack. Maximum intensity projections along Z provided. A gamma correction of 0.8 was applied to all images to highlight weak features. Scale bar 10 μm.
Long-time lapse imaging of RPE-1 cells labeled with Tractin-EGFP spanning 10 h 12 min and encompassing 2600 Z-stacks, acquired in the low-NA mode. Each Z-stack consisted of 67 slices. Cells were continuously imaged with a temporal resolution of 13.6 s. Maximum intensity projections along Z and only every third slice is shown. A gamma correction of 0.8 was applied to all images to highlight weak features. Scale bar 10 μm.
References
- 1.Ahrens M.B., Orger M.B., Keller P.J. Whole-brain functional imaging at cellular resolution using light-sheet microscopy. Nat. Methods. 2013;10:413–420. doi: 10.1038/nmeth.2434. [DOI] [PubMed] [Google Scholar]
- 2.Keller P.J. Imaging morphogenesis: technological advances and biological insights. Science. 2013;340:1234168-1–1234168-10. doi: 10.1126/science.1234168. [DOI] [PubMed] [Google Scholar]
- 3.Gebhardt J.C.M., Suter D.M., Xie X.S. Single-molecule imaging of transcription factor binding to DNA in live mammalian cells. Nat. Methods. 2013;10:421–426. doi: 10.1038/nmeth.2411. [DOI] [PMC free article] [PubMed] [Google Scholar]
- 4.Truong T.V., Supatto W., Fraser S.E. Deep and fast live imaging with two-photon scanned light-sheet microscopy. Nat. Methods. 2011;8:757–760. doi: 10.1038/nmeth.1652. [DOI] [PubMed] [Google Scholar]
- 5.Tomer R., Khairy K., Keller P.J. Quantitative high-speed imaging of entire developing embryos with simultaneous multiview light-sheet microscopy. Nat. Methods. 2012;9:755–763. doi: 10.1038/nmeth.2062. [DOI] [PubMed] [Google Scholar]
- 6.Gao L. Extend the field of view of selective plan illumination microscopy by tiling the excitation light sheet. Opt. Express. 2015;23:6102–6111. doi: 10.1364/OE.23.006102. [DOI] [PubMed] [Google Scholar]
- 7.Wu Y., Wawrzusin P., Shroff H. Spatially isotropic four-dimensional imaging with dual-view plane illumination microscopy. Nat. Biotechnol. 2013;31:1032–1038. doi: 10.1038/nbt.2713. [DOI] [PMC free article] [PubMed] [Google Scholar]
- 8.Zong W., Zhao J., Chen L. Large-field high-resolution two-photon digital scanned light-sheet microscopy. Cell Res. 2014;25:254–257. doi: 10.1038/cr.2014.124. [DOI] [PMC free article] [PubMed] [Google Scholar]
- 9.Dean K.M., Fiolka R. Uniform and scalable light-sheets generated by extended focusing. Opt. Express. 2014;22:26141–26152. doi: 10.1364/OE.22.026141. [DOI] [PubMed] [Google Scholar]
- 10.Planchon T.A., Gao L., Betzig E. Rapid three-dimensional isotropic imaging of living cells using Bessel beam plane illumination. Nat. Methods. 2011;8:417–423. doi: 10.1038/nmeth.1586. [DOI] [PMC free article] [PubMed] [Google Scholar]
- 11.Vettenburg T., Dalgarno H.I.C., Dholakia K. Light-sheet microscopy using an Airy beam. Nat. Methods. 2014;11:541–544. doi: 10.1038/nmeth.2922. [DOI] [PubMed] [Google Scholar]
- 12.Fahrbach F.O., Rohrbach A. A line scanned light-sheet microscope with phase shaped self-reconstructing beams. Opt. Express. 2010;18:24229–24244. doi: 10.1364/OE.18.024229. [DOI] [PubMed] [Google Scholar]
- 13.Gao L., Shao L., Betzig E. Noninvasive imaging beyond the diffraction limit of 3D dynamics in thickly fluorescent specimens. Cell. 2012;151:1370–1385. doi: 10.1016/j.cell.2012.10.008. [DOI] [PMC free article] [PubMed] [Google Scholar]
- 14.Chen B.C., Legant W.R., Betzig E. Lattice light-sheet microscopy: imaging molecules to embryos at high spatiotemporal resolution. Science. 2014;346 doi: 10.1126/science.1257998. 1257998–1257998. [DOI] [PMC free article] [PubMed] [Google Scholar]
- 15.Gao L., Shao L., Betzig E. 3D live fluorescence imaging of cellular dynamics using Bessel beam plane illumination microscopy. Nat. Protoc. 2014;9:1083–1101. doi: 10.1038/nprot.2014.087. [DOI] [PubMed] [Google Scholar]
- 16.Keller P.J., Schmidt A.D., Stelzer E.H.K. Reconstruction of zebrafish early embryonic development by scanned light sheet microscopy. Science. 2008;322:1065–1069. doi: 10.1126/science.1162493. [DOI] [PubMed] [Google Scholar]
- 17.Fahrbach F.O., Rohrbach A. Propagation stability of self-reconstructing Bessel beams enables contrast-enhanced imaging in thick media. Nat. Commun. 2012;3:632. doi: 10.1038/ncomms1646. [DOI] [PubMed] [Google Scholar]
- 18.Wang H., Abhilash A.S., Shenoy V.B. Long-range force transmission in fibrous matrices enabled by tension-driven alignment of fibers. Biophys. J. 2014;107:2592–2603. doi: 10.1016/j.bpj.2014.09.044. [DOI] [PMC free article] [PubMed] [Google Scholar]
- 19.Butcher D.T., Alliston T., Weaver V.M. A tense situation: forcing tumour progression. Nat. Rev. Cancer. 2009;9:108–122. doi: 10.1038/nrc2544. [DOI] [PMC free article] [PubMed] [Google Scholar]
- 20.Friedl P., Wolf K. Plasticity of cell migration: a multiscale tuning model. J. Cell Biol. 2010;188:11–19. doi: 10.1083/jcb.200909003. [DOI] [PMC free article] [PubMed] [Google Scholar]
- 21.Zhao M., Zhang H., Peng L. Cellular imaging of deep organ using two-photon Bessel light-sheet nonlinear structured illumination microscopy. Biomed. Opt. Express. 2014;5:1296–1308. doi: 10.1364/BOE.5.001296. [DOI] [PMC free article] [PubMed] [Google Scholar]
- 22.Dean K.M., Palmer A.E. Advances in fluorescence labeling strategies for dynamic cellular imaging. Nat. Chem. Biol. 2014;10:512–523. doi: 10.1038/nchembio.1556. [DOI] [PMC free article] [PubMed] [Google Scholar]
- 23.Sarder P., Nehorai A. Deconvolution methods for 3-D fluorescence microscopy images. Signal Process. Mag. IEEE. 2006;23:32–45. [Google Scholar]
- 24.Martin K., Vilela M., Pertz O. A growth factor-induced, spatially organizing cytoskeletal module enables rapid and persistent fibroblast migration. Dev. Cell. 2014;30:701–716. doi: 10.1016/j.devcel.2014.07.022. [DOI] [PMC free article] [PubMed] [Google Scholar]
- 25.Aguet F., Antonescu C.N., Danuser G. Advances in analysis of low signal-to-noise images link dynamin and AP2 to the functions of an endocytic checkpoint. Dev. Cell. 2013;26:279–291. doi: 10.1016/j.devcel.2013.06.019. [DOI] [PMC free article] [PubMed] [Google Scholar]
- 26.Born M., Wolf E., Hecht E. Principles of optics: electromagnetic theory of propagation, interference and diffraction of light. Phys. Today. 2000;53:77–78. [Google Scholar]
- 27.Baumgart E., Kubitscheck U. Scanned light sheet microscopy with confocal slit detection. Opt. Express. 2012;20:21805–21814. doi: 10.1364/OE.20.021805. [DOI] [PubMed] [Google Scholar]
- 28.Botcherby E.J., Juskaitis R., Wilson T. Aberration-free optical refocusing in high numerical aperture microscopy. Opt. Lett. 2007;32:2007–2009. doi: 10.1364/ol.32.002007. [DOI] [PubMed] [Google Scholar]
- 29.Botcherby E.J., Smith C.W., Wilson T. Aberration-free three-dimensional multiphoton imaging of neuronal activity at kHz rates. Proc. Natl. Acad. Sci. USA. 2012;109:2919–2924. doi: 10.1073/pnas.1111662109. [DOI] [PMC free article] [PubMed] [Google Scholar]
- 30.Silvestri L., Bria A., Pavone F.S. Confocal light sheet microscopy: micron-scale neuroanatomy of the entire mouse brain. Opt. Express. 2012;20:20582–20598. doi: 10.1364/OE.20.020582. [DOI] [PubMed] [Google Scholar]
- 31.Dean K.M., Lubbeck J.L., Palmer A.E. Analysis of red-fluorescent proteins provides insight into dark-state conversion and photodegradation. Biophys. J. 2011;101:961–969. doi: 10.1016/j.bpj.2011.06.055. [DOI] [PMC free article] [PubMed] [Google Scholar]
- 32.Shaner N.C., Lin M.Z., Tsien R.Y. Improving the photostability of bright monomeric orange and red fluorescent proteins. Nat. Methods. 2008;5:545–551. doi: 10.1038/nmeth.1209. [DOI] [PMC free article] [PubMed] [Google Scholar]
- 33.Shaner N.C., Lambert G.G., Wang J. A bright monomeric green fluorescent protein derived from Branchiostoma lanceolatum. Nat. Methods. 2013;10:407–409. doi: 10.1038/nmeth.2413. [DOI] [PMC free article] [PubMed] [Google Scholar]
- 34.Friedl P., Maaser K., Zänker K.S. Migration of highly aggressive MV3 melanoma cells in 3-dimensional collagen lattices results in local matrix reorganization and shedding of alpha2 and beta1 integrins and CD44. Cancer Res. 1997;57:2061–2070. [PubMed] [Google Scholar]
- 35.Krahn K.N., Bouten C.V.C., Merkx M. Fluorescently labeled collagen binding proteins allow specific visualization of collagen in tissues and live cell culture. Anal. Biochem. 2006;350:177–185. doi: 10.1016/j.ab.2006.01.013. [DOI] [PubMed] [Google Scholar]
- 36.Xu Y., Rivas J.M., Höök M. Virulence potential of the staphylococcal adhesin CNA in experimental arthritis is determined by its affinity for collagen. J. Infect. Dis. 2004;189:2323–2333. doi: 10.1086/420851. [DOI] [PubMed] [Google Scholar]
- 37.Jaqaman K., Loerke D., Danuser G. Robust single-particle tracking in live-cell time-lapse sequences. Nat. Methods. 2008;5:695–702. doi: 10.1038/nmeth.1237. [DOI] [PMC free article] [PubMed] [Google Scholar]
- 38.Welf E.S., Danuser G. Using fluctuation analysis to establish causal relations between cellular events without experimental perturbation. Biophys. J. 2014;107:2492–2498. doi: 10.1016/j.bpj.2014.10.032. [DOI] [PMC free article] [PubMed] [Google Scholar]
- 39.Vilela M., Danuser G. What’s wrong with correlative experiments? Nat. Cell Biol. 2011;13 doi: 10.1038/ncb2325. 1011–1011. [DOI] [PubMed] [Google Scholar]
Associated Data
This section collects any data citations, data availability statements, or supplementary materials included in this article.
Supplementary Materials
ASLM imaging of collagen-embedded RPE cells labeled with vimentin (magenta) and microtubules (green) over 120 time points. A MIP along the Z axis over the entire volume is shown. Scale bar 20 μm.
Clathrin-coated pit detection in 3D. Local maximum intensity projection with a thickness of 2 μm sweeping through the entire volume of the cell. Detected particles are labeled with spheres.
3D rendering and particle tracking of clathrin-mediated endocytosis in collagen-embedded ARPE cells. (Top left) 3D maximum intensity projection rendering. Volume encompassing cube is 20 × 20 × 20 μm. (Top right) Same 3D rendering with particle tracks overlaid. The lifetime of endocytic vesicles is color coded from blue to red, representing shorter- to longer-lived clathrin-coated pits, respectively. (Bottom left) 3D rendering with ray-casting of the same cell, with a portion of the cell made transparent to facilitate visualization of the clathrin-coated pits. (Bottom right) Detailed view of bottom left panel.
Long-time lapse imaging of collagen-embedded RPE-1 cells labeled with Tractin-EGFP spanning 7 h and 29 min and encompassing 600 Z-stacks, acquired in the high-NA mode. Each Z-stack consisted of 251 slices. Cells were continuously imaged with a temporal resolution of 44.9 s per Z-stack. Maximum intensity projections along Z provided. A gamma correction of 0.8 was applied to all images to highlight weak features. Scale bar 10 μm.
Long-time lapse imaging of RPE-1 cells labeled with Tractin-EGFP spanning 10 h 12 min and encompassing 2600 Z-stacks, acquired in the low-NA mode. Each Z-stack consisted of 67 slices. Cells were continuously imaged with a temporal resolution of 13.6 s. Maximum intensity projections along Z and only every third slice is shown. A gamma correction of 0.8 was applied to all images to highlight weak features. Scale bar 10 μm.