Summary
Background
Rising body weight is a major public health concern. However there have been few worldwide comparative analyses of long-term trends of body mass index (BMI), and none that have used recent national health examination surveys.
Methods
We estimated trends in mean in BMI and their uncertainties for adults 20 years of age and older in 199 countries and territories. Data were from published and unpublished health examination surveys and epidemiologic studies. For each sex, we used a Bayesian hierarchical model to estimate BMI by age, country, and year, accounting for whether a given study was nationally representative.
Findings
Between 1980 and 2008, global mean BMI increased at an annualized rate of 0.4 (95% uncertainty interval 0.2, 0.6, posterior probability (PP) of being a true increase > 0.999) kg/m2/decade for men and 0.5 (0.3–0.7, PP > 0.999) for women. National BMI change for women ranged from non-significant declines in 19 countries to rising over 2.5 (PP > 0.999) kg/m2/decade in Tonga and Cook Islands. There was an increase in male BMI in all but a few countries, reaching over 2 kg/m2/decade in Nauru and Cook Islands, PP > 0.999. Male and female BMIs in 2008 were highest in some Oceania countries, reaching 33.9 (32.8, 35.0) kg/m2 (men) and 35.0 (33.6, 36.3) (women) in Nauru. Female BMI was lowest in Bangladesh (20.5; 19.8, 21.3) kg/m2 and male BMI in Democratic Republic of the Congo 19.9 (18.2, 21.5), with BMI also below 21.5 kg/m2 for both sexes in a few countries in sub-Saharan Africa, and East, South, and Southeast Asia. USA had the highest BMI among high-income countries, followed by New Zealand. In 2008, an estimated 1.47 billion adults worldwide had BMI ≥ 25 kg/m2; of these 205 (193, 217) million men and 297 (280, 315) million women were obese.
Interpretation
Globally, mean BMI increased since 1980. The trends since 1980, and mean population BMI in 2008, varied substantially across nations. Interventions and policies that can curb or reverse the increase, and mitigate the health effects of high BMI by targeting its metabolic mediators, are needed in most countries.
Introduction
Excess body weight is an important risk factor for mortality and morbidity from cardiovascular diseases, diabetes, cancers, and musculoskeletal disorders, causing nearly 3 million annual deaths worldwide1–4. National, subnational, and multi-center studies have shown that adiposity, as measured by body mass index (BMI, calculated as weight in kg over m2), has increased in recent decades in many populations5–12, although BMI seems to have been stable or even decreased in some groups6–7, 9, 13.
Some have argued that rising BMI is a pandemic14–15 that may reverse life expectancy gains in high-income nations16. Therefore, there is enormous interest in curbing or reversing rising BMI trends. Reliable information on BMI trends in is needed to assess its population health effects, set policy priorities, and evaluate their success. A number of studies used national health surveys, multi-center studies, and/or reviews of published studies to estimate adult BMI levels or trends worldwide, specific regions, or cross-country comparative analyses6, 17–21. Some of these studies used BMI data based on both measured and self-reported weight and height19, even though the latter is biased22. Others focused exclusively on women20 or selected countries6, 19–21, relied primarily on community studies6, 17, or combined community and national studies without distinguishing them18. Recently, many high-quality national health examination surveys have measured BMI, providing an opportunity to systematically and comprehensively assess regional and national trends.
We reviewed and accessed published and unpublished studies to collate comprehensive BMI data. We developed and applied statistical methods to systematically address measurement comparability, missing data, non-linear trends and age patterns, and national vs. subnational and community representativeness. Using these data and methods, we estimated BMI trends and their uncertainties by country between 1980 and 2008.
Methods
Overview
We estimated 1980–2008 trends in mean BMI and their uncertainties, by sex, for 199 countries and territories in 21 subregions of the Global Burden of Diseases, Injuries, and Risk Factors Study, themselves grouped into seven regions (Webtable 1)23. 1980 was selected as the beginning of the analysis period because fewer data were available earlier.
There is evidence that central adiposity measures, e.g. waist circumference, may better predict disease risk at the individual level24–25; other evidence indicates that central adiposity and BMI independently predict mortality risk26. However, many more population-based studies have measured BMI than central adiposity. We used mean BMI, instead of obesity prevalence, as our main outcome because the association with most diseases is continuous2–3. We also report overweight and obesity because, while not as relevant for population health as mean BMI, they are commonly used for public communication.
Our analysis included three steps:
Identifying data sources, and accessing and extracting data;
Converting extracted data to a comparable metric; and
Applying a statistical model to estimate BMI trends by country and sex.
We analyzed the uncertainty in estimates, taking into account sampling error and uncertainty from statistical modeling in steps 2 and 3.
Data identification, access and extraction
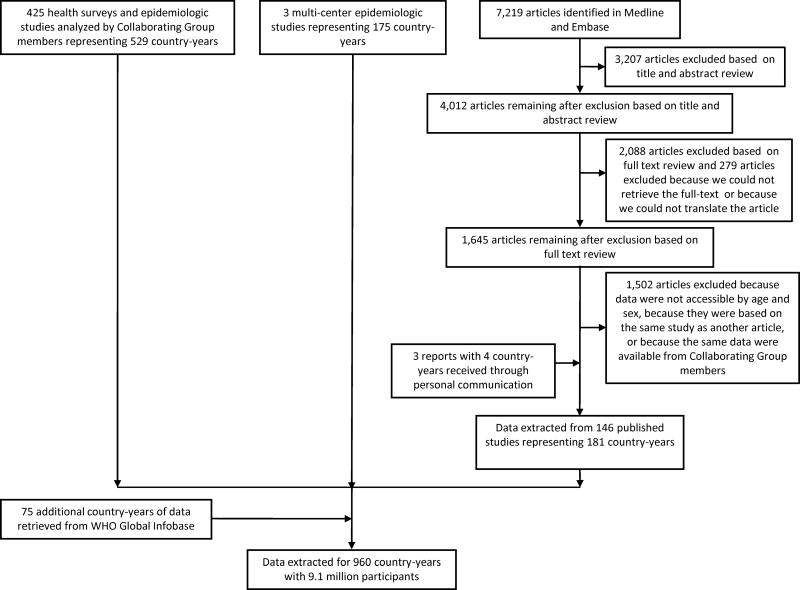
We obtained data from health examination surveys and epidemiologic studies with anonymized data available to Collaborating Group members; multi-center studies; a review of published articles; and unpublished data identified through the WHO global Infobase (Figure 1 and Webappendix 1). Duplicate sources of data were identified by comparing all studies from the same population-year (e.g., when data from a MONICA Project site was also reported separately); the source with more detail was used. Importantly, only BMI data from measured weight and height were used because self-reported measures are systematically biased22.
Figure 1.
Flow diagram for data identification and access.
Health examination surveys and other epidemiologic studies with available individual records
Collaborating Group members analyzed anonymized data from health examination surveys and epidemiologic studies. BMI mean was calculated by sex and age group, incorporating appropriate sample weights when applicable.
Review of published articles
We identified data sources by searching Medline and Embase for relevant articles, with detailed information on the search strategy, exclusion criteria, and the number of articles identified and retained provided in Webappendix 1 and Figure 1. In brief, studies were included if they were from a population-based sample, including from a national, subnational, and community population, and if the data were based on measured (vs. self-reported) BMI (see Webappendix 1 for exclusion criteria details). If a published article met the inclusion criteria but did not report data by age and sex, we invited the corresponding author to join the Collaborating Group by contributing stratified data. There were no restrictions on the language of publication. All articles for which we could identify a translator were screened for inclusion in the data sources.
Additional published and unpublished data sources
We identified additional data sources through personal communications with researchers, including inquiring about additional data from authors of published studies. This led to access to data from multi-center studies (e.g. the MONICA Project and INTERSALT and INTERMAP Studies), published government reports, published sources not identified in our review, as well as unpublished data. These data were used only if information on study population and measurement methods were available. We applied the same exclusion criteria to these data sources as to the published articles.
Data extraction
Age-and-sex-stratified data were extracted into standard data extraction files. Extracted data included information on mean BMI and/or prevalence of overweight/obesity; sample sizes, standard errors and/or confidence intervals; survey population and sampling strategy; and selected other study characteristics (Webtable 2). When sample weights were provided, we calculated weighted mean BMI. Importantly, for each data source we recorded (i) whether the data were national (separated into weighted and unweighted), covered multiple subnational regions, or were from individual communities (denoted “coverage” hereafter) and (ii) whether the study population was rural, urban, or both (Webtable 2). This information was used to account for potential bias and additional uncertainty in data sources that were not representative of their national populations, as described below.
Methods for comparability of BMI metrics and for estimating the prevalences of overweight and obesity
Some published studies reported overweight/obesity prevalence, but not mean BMI, which was our primary outcome. In such cases, we developed linear regressions to estimate mean BMI from overweight/obesity prevalence (Webappendix 3; Webtable 3). The dependent variable in these “cross-walking” regressions was mean BMI; the independent variables were overweight/obesity prevalence, age, sex, year of survey, and whether the country was high-income. A separate regression was developed for each overweight/obesity prevalence definition used in at least one published study. The details of the cross-walking regression models and their coefficients are provided in Webappendix 3 and Webtable 3.
A similar approach was also used to estimate overweight (BMI ≥ 25 kg/m2) and obesity (BMI ≥ 30 kg/m2) prevalences, which were our secondary outcomes, using estimates of mean BMI from our model. For this analysis, we applied regression models to mean BMI by age group, sex, country and year, to estimate either the prevalence of overweight or that of obesity. The dependent variable in each of these two regressions was the logit of prevalence and the independent variables were mean BMI and the same covariates as above. We used logit transformation to restrict the estimated prevalences between 0 and 1. The uncertainty of the estimated prevalences included those of the estimated country mean (see below) and uncertainty associated with converting mean to prevalence. Subregion estimates for each year were simply calculated as population-weighted averages of the country estimates by age group and sex. The details of these “reverse cross-walking” regressions and their coefficients are provided in Webappendix 3 and Webtable 4.
Statistical methods for country estimates
Despite our extensive data access, there were many country-years without data or without nationally representative data, because annual risk factor data are available for very few countries. Further, some studies covered only some age-sex groups or only rural or urban populations. We developed a statistical model for estimating mean BMI over time, by age group, sex, and country. We conducted all analyses by sex, because males and females can differ in BMI levels and trends9. We used a Bayesian hierarchical model to make estimates for each age-country-year unit; the estimates were informed by data from that unit itself, if available, and also by data from other units. Specific model features, and their motivations, are briefly described below; complete details are provided in Webappendix 2.
We used a hierarchical model in which BMI levels and trends in countries were, in turn, nested in subregional, regional and global levels and trends. The hierarchical model “borrows information” across countries, subregions, and regions, appropriately compromising between (overly) uncertain within-unit estimates and the (overly) simplified aggregate cross-unit estimates; it borrows information to a greater degree when data are nonexistent or noninformative (i.e. have large uncertainty), and a lesser degree in data-rich countries, subregions, and regions.
Trends over time were modeled as nonlinear, consisting of a linear trend plus a smooth nonlinear trend at all levels. Both components were modeled hierarchically.
Time-varying country-level covariates informed the estimates. The covariates, described elsewhere27, were (i) national income (Ln per-capita GDP converted to international dollars in 1990), (ii) urbanization (proportion of population that lived in urban areas), and (iii) national availability of multiple food types. The associations of BMI with the first two covariates were allowed to change over time, e.g. because income association may change as social and scientific factors influence diet and physical activity. To reduce the influence of inter-annual fluctuations of covariates and to reflect potentially cumulative associations, we used a weighted average of the past ten years, with progressively smaller weights in the more distant past.
Subnational and community studies may systematically differ from nationally-representative ones, because they may be conducted in low- or high-BMI areas. They may also have larger variation than national studies. Our model included time-varying offsets for subnational and community data, and additional variance components for subnational and community data and for national data without sample weights. These variance components (estimated empirically) allowed national data with sample weights to have more influence on estimates than other sources.
BMI may differ systematically between rural and urban populations, with the difference depending on the country’s urbanization level. Therefore, the model accounted for differences between study- and country-level urbanization.
Mean BMI may be non-linearly associated with age and may decline in older ages. The age association of BMI may vary across countries, and may be steeper where mean BMI is higher. Therefore, we used a cubic spline age model, with parameters estimated as a function of BMI at a baseline age.
Mean BMI was estimated from the model by 5–10 age groups for adults ≥ 20 years. Subregional and regional estimates for each year were calculated as population-weighted averages of the country estimates by age group and sex. For presentation, age-specific estimates for each country/region and year were age-standardized using WHO’s reference population28, which corresponds to the 2000–2025 world population.
Analysis of uncertainty
We quantified the following sources of uncertainty, with details provided in Webappendix 2.
sampling uncertainty in the original data sources;
uncertainty associated with inter-annual fluctuations in weighted national data, due to unmeasured study design factors (e.g. see national data from USA and Egypt in Webfigure 5);
additional uncertainty associated with data sources that were not weighted national, due to variation across subgroups within each country;
uncertainty associated with statistical methods for comparability of BMI metric; and
uncertainty due to using a model to estimate mean BMI by age group, country, and year when data were missing.
As described in Webappendix 2, we fit the Bayesian model using Markov chain Monte Carlo (MCMC) and obtained samples from the posterior distribution of model parameters, reflecting the above sources of uncertainty, which were in turn used to obtain the posterior distribution of mean BMI. The uncertainty intervals reported in Results represent the 2.5th–97.5th percentiles of the posterior distribution of estimated means from the Bayesian model. We also report the posterior probability (PP) that an estimated increase/decrease corresponds to a truly increasing/decreasing BMI trend. Change was estimated as linear trend over the 28 years of analysis and is reported as change per decade. Note that PP is not a p-value; PP would be 0.50 in a country or region where an increase is indistinguishable from a decrease, and larger PP indicates more certainty.
Role of funding sources
The sponsor of the study had no role in study design, data collection, data analysis, data interpretation, writing of the report, or decision to submit manuscript. The Writing and Global Analysis Group had access to all data sources and has responsibility for the contents of the manuscript and the decision to submit.
Results
Our analysis included 960 country-years of data, with a total of 9.1 million participants (Figure 1). Of these, 361 country-years were from 29 high-income countries and 599 covered 140 additional countries. Japan had the most national data with 16 national data sources since 1980, followed by China with 8 national sources and 64 subnational or community sources. There were about 30 countries for which we could not identify any data. The Caribbean had the most countries with no usable data (7 of 20).
There were more data for women (931 country-years) than men (796), especially in sub-Saharan Africa and other low-and-middle-income regions, where 28% of sources, primarily Demographic and Health Surveys, had only female data (Webfigure 1 and Webfigure 2). More than one half of sources did not have data over 70 years of age. About one half of data in low-and-middle-income regions were from the 2000s (59% of national data), and another 34% from the 1990s, whereas in high-income regions data were evenly distributed over time.
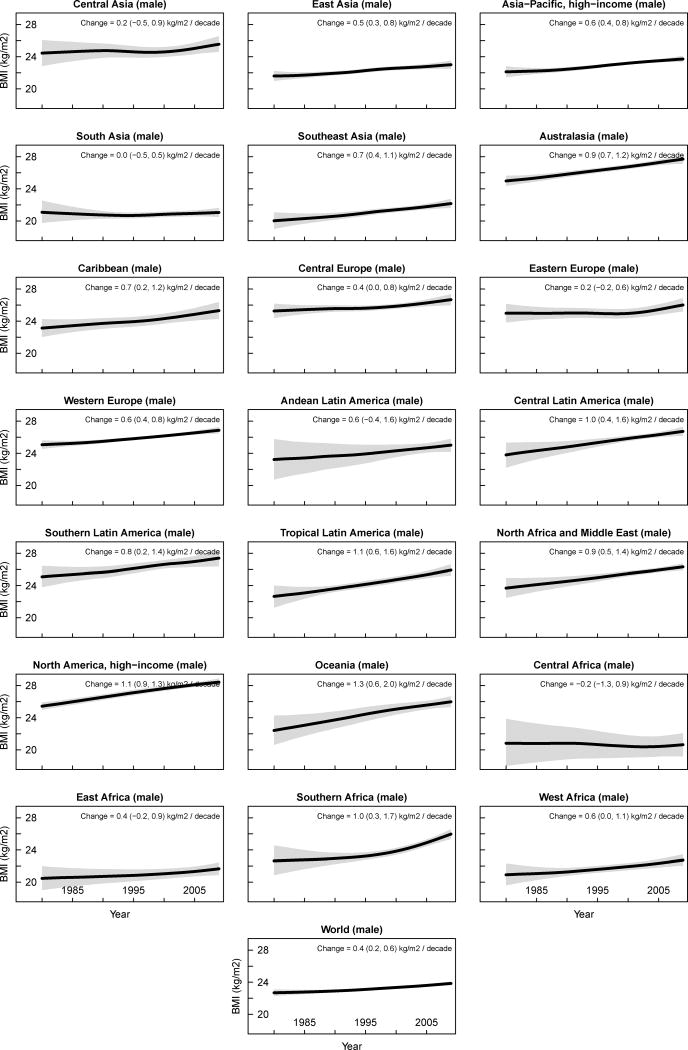
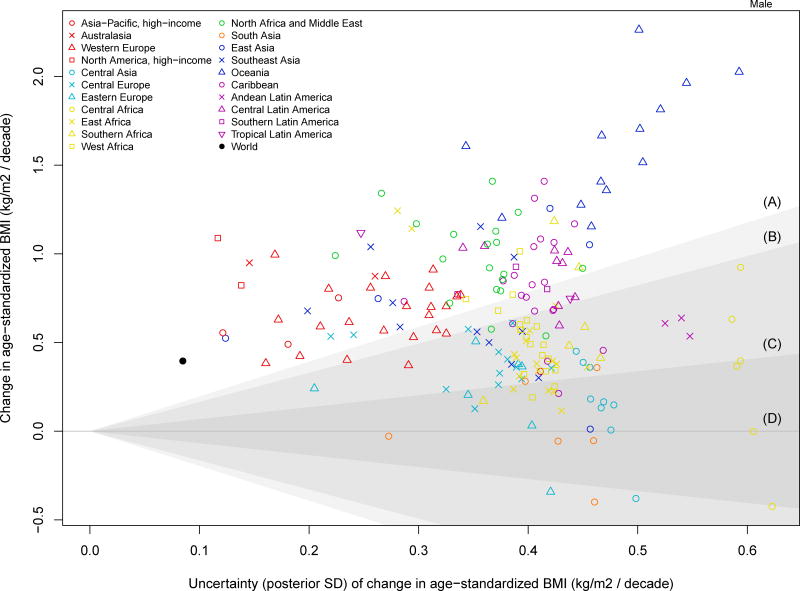
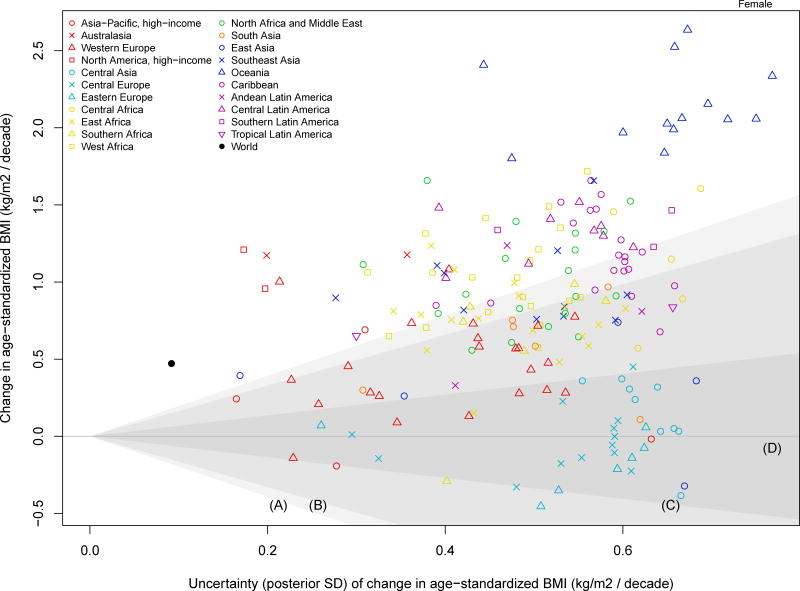
Between 1980 and 2008, age-standardized mean BMI for men increased in every subregion except Central Africa and South Asia. The global change was 0.4 (95% uncertainty interval 0.2, 0.6, PP of being a true increase > 0.999) kg/m2/decade, ranging from −0.2 (−1.3, 0.9, PP=0.61) kg/m2 in Central Africa to 1.3 (0.6, 2.0, PP > 0.999) kg/m2 in Oceania. Male BMI in six other subregions increased by 0.9–1.1 kg/m2/decade (Figure 2). In fact there was an increase in male BMI in all but eight countries, with 173 countries having PP of being a true increase ≥ 0.75 (Figure 3). Among high-income countries, male BMI rose most in USA (1.1, 0.9, 1.3 kg/m2/decade, PP > 0.999), followed by UK and Australia, and least in Brunei Darussalam, Switzerland, Italy and France, with increases ranging 0.3–0.4 kg/m2/decade.
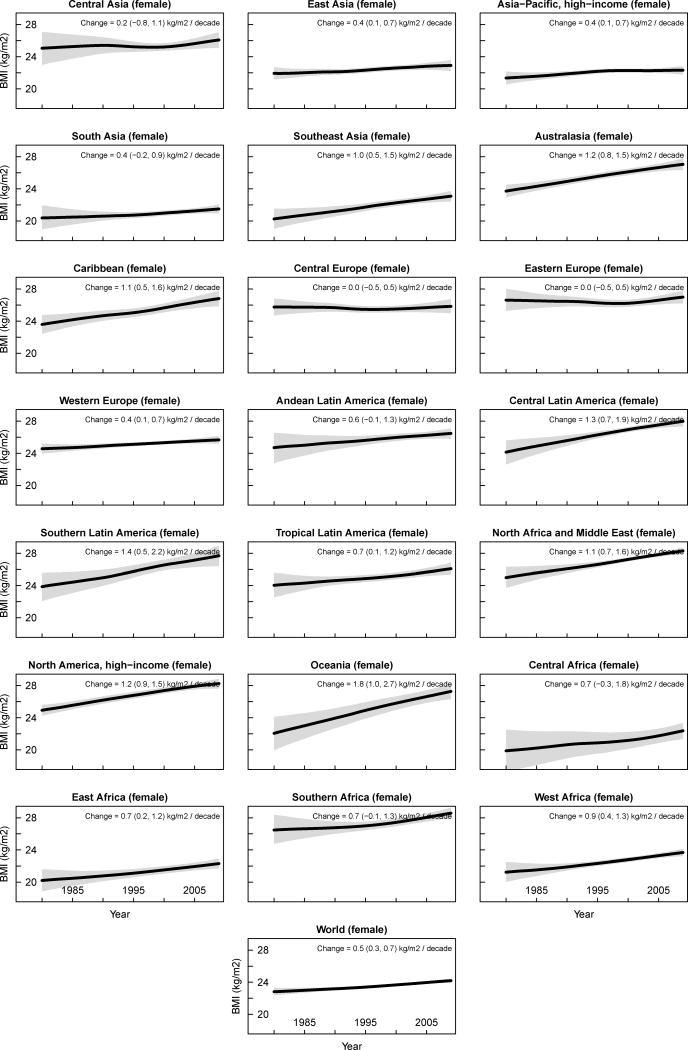
Figure 2.
Trends in age-standardized mean BMI by subregion between 1980 and 2008. See Webfigure 4 for trends by region and Webfigure 6 for trends by country. The solid line represents the posterior mean estimate and the shaded area the 95% uncertainty interval.
Figure 3.
Change in country age-standardized BMI between 1980 and 2008 in relation to its uncertainty.
The shaded areas approximately represent the following ranges of posterior probabilities (PP) of an estimated increase/decrease being a true increase/decrease:
A: PP > 0.975
B: 0.95 < PP < 0.975
C: 0.75 < PP < 0.95
D: PP < 0.75
In 2008, age-standardized mean BMI among men was highest in Australasia and North America, 27.6 (27.1, 28.1) and 28.4 (279, 28.7) kg/m2, respectively. Male BMI was lowest in sub-Saharan Africa and in East, South, and Southeast Asia, ranging 20.6–22.9 kg/m2. As a result of the differential trends, the gap between subregions with the highest and lowest male BMI increased from 5.4 in 1980 to 7.8 kg/m2 in 2008. The highest male BMI in 2008 was in some countries in Oceania (Figure 4 and Webfigure 5), reaching 33.9 (32.8, 35.0) in Nauru. Men in some countries in the Caribbean and North Africa and Middle East and in USA also had mean BMI above 28 kg/m2. The lowest estimated male BMIs, all below 21 kg/m2, were seen in a few countries in sub-Saharan Africa and South and Southeast Asia. Japan and Singapore had the lowest male BMI among high-income countries, both below 24.0 kg/m2.
Figure 4.
Age-standardized BMI in (a) 1980 and (b) 2008 by country.
Globally female BMI increased by 0.5 (0.3, 0.7, PP > 0.999) kg/m2/decade between 1980 and 2008. The largest rise in female BMI also occurred in Oceania (1.8; 1.0, 2.7 kg/m2/decade, PP > 0.999), followed by BMI rises of 1.3–1.4 kg/m2/decade in Southern and Central Latin America. Female mean BMI trends in Central and Eastern Europe and Central Asia were indistinguishable from being flat, with changes < 0.2 kg/m2/decade and PP of change < 0.65. The increase in East and South Asia, Asia-Pacific, and Western Europe was also below 0.4 kg/m2/decade. The latter two high-income regions were noticeably different from Australasia and North America where female BMI increased by about 1.2 kg/m2/decade, pp > 0.999.
Nationally, female BMI decreased in 19 countries with posterior probabilities ranging 0.50–0.81. Of the remaining 180 countries, BMI rose in 76 with PP > 0.975. The largest of these, with an average rise of ≥ 2.0 kg/m2/decade occurred in 9 countries in Oceania (Figure 3). Women in Australia, New Zealand and especially USA (1.2, 0.9, 1.5, PP > 0.999) led high-income countries in weight gain, with those in Italy and Singapore possibly having a modest BMI decline of 0.1–0.2 kg/m2/decade(PP < 0.75).
Globally age-standardized mean BMI in 2008 was 23.8 (23.6, 24.0) kg/m2 for men and 24.1 (23.9, 24.4) kg/m2 for women. Men had higher BMI than women in high-income subregions, and lower BMI in most low- and middle-income regions. While the difference between the lowest and highest mean female BMI across subregions was about 7 kg/m2 in both 1980 and 2008, ordering changed. In 1980, women in Central and Eastern Europe and Southern Africa, with mean BMI of 25.8–26.6 kg/m2, had the highest BMI; in 2008, the top female BMIs were in North America, North Africa and Middle East, and Southern Africa, all ≥ 28 kg/m2. At the other extreme, in 1980 the lowest female BMI was in low-income subregions of Central, East, and West Africa and South and Southeast Asia, all ≤ 21.2 kg/m2; in 2008, West Africa and Southeast Asia were replaced by East Asia and high-income Asia-Pacific subregions, with BMIs ranging 21.4–22.9 kg/m2. As with males, women in countries in Oceania had the highest BMI, with mean BMI in Nauru (35.0; 33.6, 36.3 kg/m2) being the highest of any country. Female BMI was also ≥ 29 kg/m2 in a number of countries in North Africa and Middle East and Caribbean, and in South Africa.
American women had the highest mean BMI among high-income countries, and at 28.3 (27.7, 28.9) kg/m2 were almost one full unit of BMI more overweight than the next highest, New Zealand. Women in a number of countries in East, South, and Southeast Asia and East Africa had mean BMI below 21.5 kg/m2, > 14 kg/m2 lower than those in Tonga and Nauru. Japanese women, with mean BMI of 21.9 (21.3, 22.4) kg/m2 were more similar to these low-BMI countries than most Western high-income ones.
Men in the world’s two most populous countries had mean BMIs that were 1–2 kg/m2 lower than the world average in 2008 (Figure 4). Male BMI in China, increased faster than the global mean, but in India the trend was estimated to be flat. Women in China and India had mean BMIs 1–2.5 kg/m2 lower than the global average; female BMI increase was less than the global mean in both countries. Despite the increases in BMI, both countries were among the 30% of countries with the lowest male and female mean BMI in 2008.
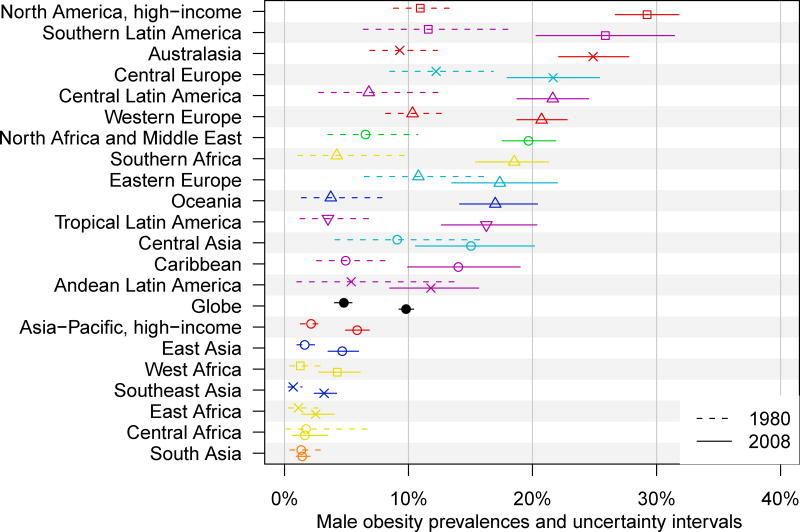
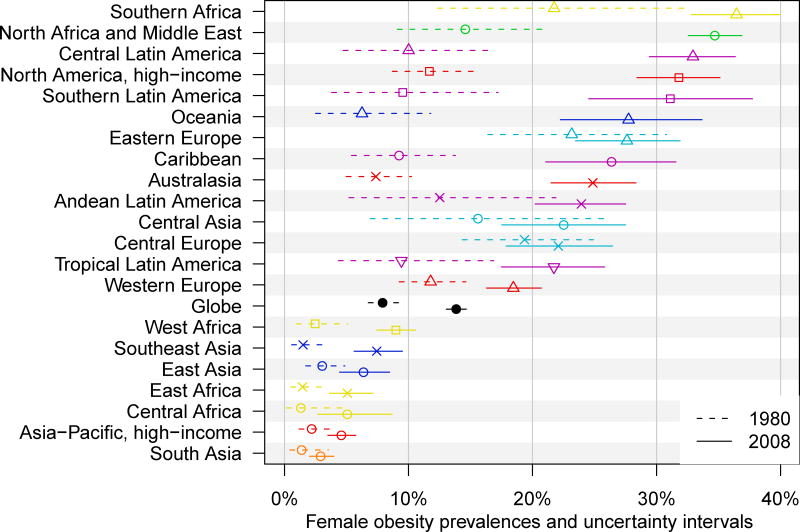
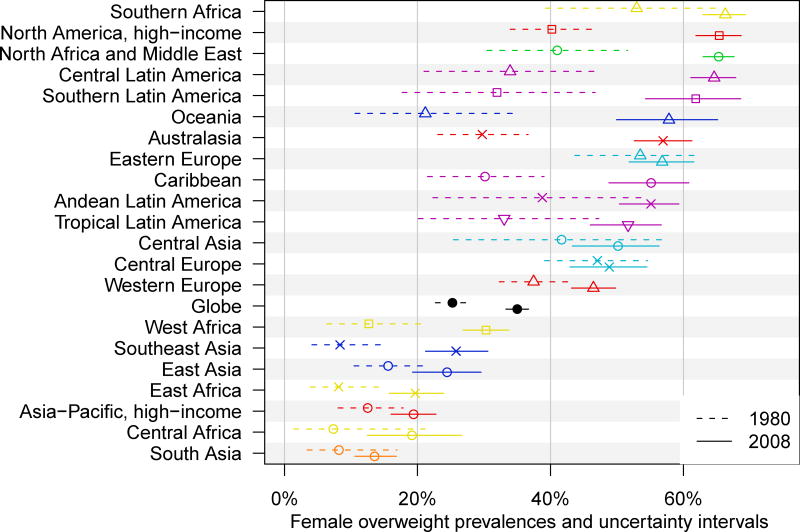
Worldwide, age-standardized prevalence of obesity was 9.8% (9.2, 10.4) among men and 13.8% (13.1, 14.7) among women in 2008, higher than about twice the 1980 prevalences of 4.8% (4.0,5.7) (men) and 7.9% (6.8, 9.3) (women) (Figure 4). An estimated 205 (193, 217) million men and 297 (280, 315) million women above the age of 20 years worldwide were obese in 2008; 1.47 billion adult men and women had BMI ≥ 25 kg/m2. The prevalence of obesity in 2008 was highest in North America among men, with an age-standardized prevalence of 29.2% (26.7, 31.8), and in Southern Africa among women 36.4% (32.8, 39.9). Female obesity prevalence was also > 30% in North America and three other low-and-middle-income subregions. Obesity prevalence was lowest in South Asia among both men (1.4%; 1.0, 2.1) and women (2.9%; 2.0, 4.0), followed by Central and East Africa for men and high-income Asia-Pacific and Central and East Africa for women.
Discussion
Between 1980 and 2008, age-standardized mean global BMI increased by 0.4–0.5 kg/m2/decade among men and women. As relevant as the average rise were the similarities and differences across regions and sexes. Notably, the subregion trends spanned a 1.4 and 1.9 kg/m2/decade range for men and women, respectively, with BMI rise largest in Oceania in both sexes. The regions with virtually flat trends or even potential declines for women were Central and Eastern Europe whereas for men they were Central Africa and South Asia. An implication of these heterogeneous trends was an increasing gap between the lowest and highest BMI subregions for men and a reordering for women.
Our results on both BMI rise, and its rare stability, are consistent with national and multi-center studies5–13, 19–20. For example, we estimated small trends among women in Brazil, Japan, and Taiwan; previous studies found increases in some groups and stable or decreasing trends in others7, 9, 29. Our estimated stable or decreasing trends in Central and Eastern Europe (for women) were also consistent with other analyses6, 30.
The strengths and innovations of this study include analysis of long-term trends; amount of high-quality measured population-based data accessed and used, including data on either mean BMI or overweight/obesity prevalence, and systematically converting all metrics to mean BMI; the Bayesian hierarchical model for estimating mean BMI, incorporating non-linear age associations and time trends; incorporating study coverage as offset and variance components in the statistical model; and systematic analysis of uncertainty. Coverage-specific offsets and variances allowed our estimates to use all available data and to follow data from nationally-representative studies more closely than other sources. Further, the coverage-specific variance components are larger for less representative data sources; this results in larger uncertainty where we did not have nationally-representative data, propagating through the Bayesian model into our uncertainty intervals, thereby representing the true availability of information. The main limitation of our study is that data gaps remained despite our extensive data seeking, especially in the 1980s, and for men through 1990s. Our analysis did not consider trends in central adiposity due to a lack of population-based data, nor did it quantify within-country disparities by socioeconomic status or race31–33. Underweight, specifically as measured by low BMI, was not an outcome of our study. While most research on undernutrition has focused on child growth and increased risk of mortality from infectious diseases, maternal low BMI is a risk factor for neonatal mortality34. We found that in 1980, mean female BMI in several countries in sub-Saharan Africa and South and Southeast Asia was below 19 kg/m2, which indicates that significant proportion of the population would be clinically underweight (BMI ≤ 18.5). By 2008, lowest mean female BMIs had reached around 21 kg/m2, indicating that underweight has decreased but may still affect some populations. Finally, we did not estimate childhood and adolescent adiposity which is important because childhood weight gain may have larger adverse effects than weight gain during adulthood due to the longer exposure.
While our estimates have quantitative uncertainty, the relatively large amount of data used makes our conclusions relatively robust. There may however be less consensus about the interpretation of the findings and their research and policy implications. Undoubtedly, research is needed on the proximal and distal causes of the observed trends. For example, to what extent have changes in physical activity vs. increases in caloric intake or changes in dietary composition been responsible for BMI rise35–36? What explains the heterogeneous BMI levels and trends, including by sex, among high-income countries (Asia-Pacific vs. Western Europe vs. Australasia and North America) or among Africa’s subregions?
Learning from our understanding of the causes of observed trends, and as we investigate and debate these causes37, we should design and rigorously test interventions and policies that curb or reverse the harmful trends, or attenuate their adverse effects through reducing mediators such as blood pressure and lipids38. Randomized studies of diet change, some also increasing exercise, have found moderate weight loss benefits for periods up to two years39–41 but long-term and community effectiveness of such interventions is less clear42. Simple advice and exercise-alone have not been efficacious even in trials41. Structural, regulatory, and economic interventions have potential to change physical activity or dietary patterns at the population level43–44, but few have demonstrated effects on weight45. Support for interventions on metabolic mediators comes from effectiveness and cost-effectiveness based on randomized trials46–48 and more importantly from the fact that many countries have successfully reduced blood pressure and lipids despite rising BMI6, 27, 49, by a larger amount among those at higher BMI50. While such interventions may reduce the effects of BMI on cardiovascular diseases, they do not address effects on other chronic diseases, especially diabetes for which investigation of pharmacological interventions effects on cause-specific and total mortality is ongoing51–54.
Finally, we should carefully analyze the mortality and morbidity effects of high BMI, and of interventions. Recent international cohort and case-control studies have quantified the associations between high BMI and different diseases in populations worldwide2–3, 25. Additional research is needed on how the duration of being overweight or obese influences risk, and whether the health benefits of preventing weight gain and those of weight loss are similar55–56.
Our systematic analysis of population-based data sources helped unpack the “global obesity pandemic” into its constituent trends by country, region and sex. As we design and implement interventions and policies to address this important risk factor, high-quality national surveillance is essential to provide reliable data for setting priorities and evaluating such efforts.
Figure 5.
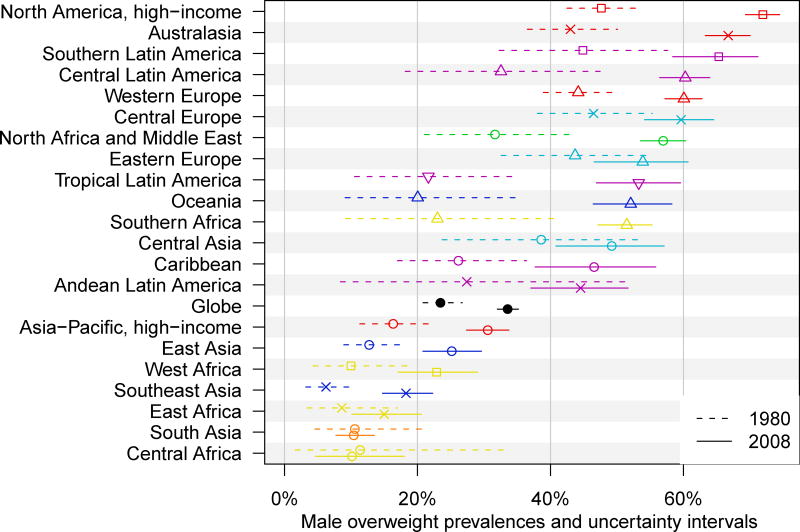
Prevalences of (a) obesity (BMI ≥ 30 kg/m2) and (b) overweight (BMI ≥ 25 kg/m2) in 1980 and 2008.
Acknowledgments
This work was undertaken as a part of the Global Burden of Diseases, Injuries, and Risk Factors Study. A grant from the Bill and Melinda Gates Foundation supported the Study’s core activities and partially supported the analyses in this paper. The results in this paper are prepared independently of the final estimates of the Global Burden of Diseases, Injuries, and Risk Factors Study. We thank Russell McIntire, Wenfan Yu, Mayuree Rao, Maya Mascarenhas, and Mathilda Regan for research assistance, Susan Piccolo, Carolyn Robinson, and Abigail Donner for research coordination, and Heather Carmichael with help with graphic presentation.
Footnotes
Contributions
GD and ME developed the study concept. GAS, HRG, YL, and ANB conducted reviews of published studies and managed databases. GAS, JKL, MJC, GMS, and members of Country Data Group analyzed health survey and epidemiologic study data. MMF and CJP developed the Bayesian statistical model with input from GD and ME. MMF, JKL, GMS, and GAS analyzed databases and prepared results. GAS and ME wrote the first draft of the paper. Other Writing and Global Analysis Group members contributed to study design, analysis, and writing of manuscript. ME, GAS, GD, and CJP oversaw the research. ME is the study guarantor.
References
- 1.Ezzati M, Lopez AD, Rodgers A, Vander Hoorn S, Murray CJ. Selected major risk factors and global and regional burden of disease. Lancet. 2002 Nov 2;360(9343):1347–60. doi: 10.1016/S0140-6736(02)11403-6. [DOI] [PubMed] [Google Scholar]
- 2.Ni Mhurchu C, Rodgers A, Pan WH, Gu DF, Woodward M. Body mass index and cardiovascular disease in the Asia-Pacific Region: an overview of 33 cohorts involving 310 000 participants. Int J Epidemiol. 2004 Aug;33(4):751–8. doi: 10.1093/ije/dyh163. [DOI] [PubMed] [Google Scholar]
- 3.Whitlock G, Lewington S, Sherliker P, Clarke R, Emberson J, Halsey J, et al. Body-mass index and cause-specific mortality in 900 000 adults: collaborative analyses of 57 prospective studies. Lancet. 2009 Mar 28;373(9669):1083–96. doi: 10.1016/S0140-6736(09)60318-4. [DOI] [PMC free article] [PubMed] [Google Scholar]
- 4.World Health Organization. Global health risks: Mortality and burden of disease attributable to selected major risks. Geneva: World Health Organization; 2009. [Google Scholar]
- 5.Ogden CL, Fryar CD, Carroll MD, Flegal KM. Mean body weight, height, and body mass index, United States 1960–2002. Adv Data. 2004 Oct;27(347):1–17. [PubMed] [Google Scholar]
- 6.Evans A, Tolonen H, Hense HW, Ferrario M, Sans S, Kuulasmaa K. Trends in coronary risk factors in the WHO MONICA project. Int J Epidemiol. 2001 Oct;30(Suppl. 1):S35–40. doi: 10.1093/ije/30.suppl_1.s35. [DOI] [PubMed] [Google Scholar]
- 7.Monteiro CA, Conde WL, Popkin BM. Income-specific trends in obesity in Brazil: 1975–2003. Am J Public Health. 2007 Oct;97(10):1808–12. doi: 10.2105/AJPH.2006.099630. [DOI] [PMC free article] [PubMed] [Google Scholar]
- 8.Nguyen MD, Beresford SA, Drewnowski A. Trends in overweight by socio-economic status in Vietnam: 1992 to 2002. Public Health Nutr. 2007 Feb;10(2):115–21. doi: 10.1017/S1368980007224085. [DOI] [PubMed] [Google Scholar]
- 9.Yoshiike N, Seino F, Tajima S, Arai Y, Kawano M, Furuhata T, et al. Twenty-year changes in the prevalence of overweight in Japanese adults: the National Nutrition Survey 1976–95. Obes Rev. 2002 Aug;3(3):183–90. doi: 10.1046/j.1467-789x.2002.00070.x. [DOI] [PubMed] [Google Scholar]
- 10.Kim DM, Ahn CW, Nam SY. Prevalence of obesity in Korea. Obes Rev. 2005 May;6(2):117–21. doi: 10.1111/j.1467-789X.2005.00173.x. [DOI] [PubMed] [Google Scholar]
- 11.Rennie KL, Jebb SA. Prevalence of obesity in Great Britain. Obes Rev. 2005 Feb;6(1):11–2. doi: 10.1111/j.1467-789X.2005.00164.x. [DOI] [PubMed] [Google Scholar]
- 12.Wang H, Du S, Zhai F, Popkin BM. Trends in the distribution of body mass index among Chinese adults, aged 20–45 years (1989–2000) Int J Obes (Lond) 2007 Feb;31(2):272–8. doi: 10.1038/sj.ijo.0803416. [DOI] [PubMed] [Google Scholar]
- 13.Houterman S, Verschuren WM, Oomen CM, Boersma-Cobbaert CM, Kromhout D. Trends in total and high density lipoprotein cholesterol and their determinants in The Netherlands between 1993 and 1997. Int J Epidemiol. 2001 Oct;30(5):1063–70. doi: 10.1093/ije/30.5.1063. [DOI] [PubMed] [Google Scholar]
- 14.Roth J, Qiang X, Marban SL, Redelt H, Lowell BC. The obesity pandemic: where have we been and where are we going? Obes Res. 2004 Nov;12(Suppl. 2):88S–101S. doi: 10.1038/oby.2004.273. [DOI] [PubMed] [Google Scholar]
- 15.Prentice AM. The emerging epidemic of obesity in developing countries. Int J Epidemiol. 2006 Feb;35(1):93–9. doi: 10.1093/ije/dyi272. [DOI] [PubMed] [Google Scholar]
- 16.Olshansky SJ, Passaro DJ, Hershow RC, Layden J, Carnes BA, Brody J, et al. A potential decline in life expectancy in the United States in the 21st century. N Engl J Med. 2005 Mar 17;352(11):1138–45. doi: 10.1056/NEJMsr043743. [DOI] [PubMed] [Google Scholar]
- 17.Pelletier DL, Rahn M. Trends in body mass index in developing countries. Food and Nutrition Bulletin. 1998;19(3):223–40. [Google Scholar]
- 18.James WPT, Jackson-Leach R, Mhurchu CN, Kalamara E, Shayeghi M, Rigby NJ, et al. Overweight and obesity (high body mass index) In: Ezzati M, Lopez AD, Rodgers A, Murray CJL, editors. Comparative quantification of health risks. Geneva: World Health Organization; 2004. pp. 497–596. [Google Scholar]
- 19.Sassi F, Devaux M, Ceccini M, Rusticelli E. The obesity epidemic: Analysis of past and projected future trends in selected OECD countries. Paris: Organisation for Economic Co-operation and Development; 2009. Mar 20, 2009. [Google Scholar]
- 20.Mendez MA, Monteiro CA, Popkin BM. Overweight exceeds underweight among women in most developing countries. Am J Clin Nutr. 2005 Mar;81(3):714–21. doi: 10.1093/ajcn/81.3.714. [DOI] [PubMed] [Google Scholar]
- 21.Popkin BM, Conde W, Hou N, Monteiro C. Is there a lag globally in overweight trends for children compared with adults? Obesity (Silver Spring) 2006 Oct;14(10):1846–53. doi: 10.1038/oby.2006.213. [DOI] [PubMed] [Google Scholar]
- 22.Gorber SC, Tremblay M, Moher D, Gorber B. A comparison of direct vs. self-report measures for assessing height, weight and body mass index: a systematic review. Obes Rev. 2007 Jul;8(4):307–26. doi: 10.1111/j.1467-789X.2007.00347.x. [DOI] [PubMed] [Google Scholar]
- 23.Rajaratnam JK, Marcus JR, Levin-Rector A, Chalupka AN, Wang H, Dwyer L, et al. Worldwide mortality in men and women aged 15–59 years from 1970 to 2010: a systematic analysis. Lancet. May 15;375(9727):1704–20. doi: 10.1016/S0140-6736(10)60517-X. [DOI] [PubMed] [Google Scholar]
- 24.Schneider HJ, Friedrich N, Klotsche J, Pieper L, Nauck M, John U, et al. The predictive value of different measures of obesity for incident cardiovascular events and mortality. J Clin Endocrinol Metab. Apr;95(4):1777–85. doi: 10.1210/jc.2009-1584. [DOI] [PubMed] [Google Scholar]
- 25.Yusuf S, Hawken S, Ounpuu S, Bautista L, Franzosi MG, Commerford P, et al. Obesity and the risk of myocardial infarction in 27,000 participants from 52 countries: a case-control study. Lancet. 2005 Nov 5;366(9497):1640–9. doi: 10.1016/S0140-6736(05)67663-5. [DOI] [PubMed] [Google Scholar]
- 26.Pischon T, Boeing H, Hoffmann K, Bergmann M, Schulze MB, Overvad K, et al. General and abdominal adiposity and risk of death in Europe. N Engl J Med. 2008 Nov 13;359(20):2105–20. doi: 10.1056/NEJMoa0801891. [DOI] [PubMed] [Google Scholar]
- 27.Danaei G, Finucane MM, Lin JK, Singh GM, Cowan MJ, Paciorek CJ, et al. National, regional, and global trends in systolic blood pressure since 1980: Systematic analysis of health examination surveys and epidemiological studies with 755 country-years and 5.1 million participants. doi: 10.1016/S0140-6736(10)62036-3. Submitted manuscript. [DOI] [PubMed] [Google Scholar]
- 28.Ahmad O, Boschi-Pinto C, Lopez A, Murray C, Lozano R, Inoue M. Age standardization of rates: A new WHO standard. Geneva: World Health Organization; 2001. [Google Scholar]
- 29.Chu NF. Prevalence of obesity in Taiwan. Obes Rev. 2005 Nov;6(4):271–4. doi: 10.1111/j.1467-789X.2005.00175.x. [DOI] [PubMed] [Google Scholar]
- 30.Jahns L, Baturin A, Popkin BM. Obesity, diet, and poverty: trends in the Russian transition to market economy. Eur J Clin Nutr. 2003 Oct;57(10):1295–302. doi: 10.1038/sj.ejcn.1601691. [DOI] [PubMed] [Google Scholar]
- 31.Molarius A, Seidell JC, Sans S, Tuomilehto J, Kuulasmaa K. Educational level, relative body weight, and changes in their association over 10 years: an international perspective from the WHO MONICA Project. Am J Public Health. 2000 Aug;90(8):1260–8. doi: 10.2105/ajph.90.8.1260. [DOI] [PMC free article] [PubMed] [Google Scholar]
- 32.Monteiro CA, Moura EC, Conde WL, Popkin BM. Socioeconomic status and obesity in adult populations of developing countries: a review. Bull World Health Organ. 2004 Dec;82(12):940–6. [PMC free article] [PubMed] [Google Scholar]
- 33.Flegal KM, Carroll MD, Ogden CL, Curtin LR. Prevalence and trends in obesity among US adults, 1999–2008. JAMA. Jan 20;303(3):235–41. doi: 10.1001/jama.2009.2014. [DOI] [PubMed] [Google Scholar]
- 34.Fishman S, Caulfield L, De Onis M, Blossner M, Hyder A, Mullany L, et al. Childhood and maternal underweight. In: Ezzati M, Lopez AD, Rodgers A, Murray C, editors. Comparative Quantification of Health Risks. Geneva, Switzerland: World Health Organization; 2004. pp. 39–162. [Google Scholar]
- 35.Bleich S, Cutler D, Murray C, Adams A. Why is the developed world obese? Annu Rev Public Health. 2008;29:273–95. doi: 10.1146/annurev.publhealth.29.020907.090954. [DOI] [PubMed] [Google Scholar]
- 36.Prentice A, Jebb S. Energy intake/physical activity interactions in the homeostasis of body weight regulation. Nutr Rev. 2004 Jul;62(7 Pt 2):S98–104. doi: 10.1111/j.1753-4887.2004.tb00095.x. [DOI] [PubMed] [Google Scholar]
- 37.Keith SW, Redden DT, Katzmarzyk PT, Boggiano MM, Hanlon EC, Benca RM, et al. Putative contributors to the secular increase in obesity: exploring the roads less traveled. Int J Obes (Lond) 2006 Nov;30(11):1585–94. doi: 10.1038/sj.ijo.0803326. [DOI] [PubMed] [Google Scholar]
- 38.Bogers RP, Bemelmans WJ, Hoogenveen RT, Boshuizen HC, Woodward M, Knekt P, et al. Association of overweight with increased risk of coronary heart disease partly independent of blood pressure and cholesterol levels: a meta-analysis of 21 cohort studies including more than 300 000 persons. Arch Intern Med. 2007 Sep 10;167(16):1720–8. doi: 10.1001/archinte.167.16.1720. [DOI] [PubMed] [Google Scholar]
- 39.Gardner CD, Kiazand A, Alhassan S, Kim S, Stafford RS, Balise RR, et al. Comparison of the Atkins, Zone, Ornish, and LEARN diets for change in weight and related risk factors among overweight premenopausal women: the A TO Z Weight Loss Study: a randomized trial. JAMA. 2007 Mar 7;297(9):969–77. doi: 10.1001/jama.297.9.969. [DOI] [PubMed] [Google Scholar]
- 40.Nordmann AJ, Nordmann A, Briel M, Keller U, Yancy WS, Jr, Brehm BJ, et al. Effects of low-carbohydrate vs low-fat diets on weight loss and cardiovascular risk factors: a meta-analysis of randomized controlled trials. Arch Intern Med. 2006 Feb 13;166(3):285–93. doi: 10.1001/archinte.166.3.285. [DOI] [PubMed] [Google Scholar]
- 41.Franz MJ, VanWormer JJ, Crain AL, Boucher JL, Histon T, Caplan W, et al. Weight-loss outcomes: a systematic review and meta-analysis of weight-loss clinical trials with a minimum 1-year follow-up. J Am Diet Assoc. 2007 Oct;107(10):1755–67. doi: 10.1016/j.jada.2007.07.017. [DOI] [PubMed] [Google Scholar]
- 42.Douketis JD, Macie C, Thabane L, Williamson DF. Systematic review of long-term weight loss studies in obese adults: clinical significance and applicability to clinical practice. Int J Obes (Lond) 2005 Oct;29(10):1153–67. doi: 10.1038/sj.ijo.0802982. [DOI] [PubMed] [Google Scholar]
- 43.Brownell KD, Farley T, Willett WC, Popkin BM, Chaloupka FJ, Thompson JW, et al. The public health and economic benefits of taxing sugar-sweetened beverages. N Engl J Med. 2009 Oct 15;361(16):1599–605. doi: 10.1056/NEJMhpr0905723. [DOI] [PMC free article] [PubMed] [Google Scholar]
- 44.Cervero R, Sarmiento OL, Jacoby E, Gomez LF, Neiman A. Influences of Built Environments on Walking and Cycling: Lessons from Bogota. International Journal of Sustainable Transportation. 2009;3(4):203–26. [Google Scholar]
- 45.Romon M, Lommez A, Tafflet M, Basdevant A, Oppert JM, Bresson JL, et al. Downward trends in the prevalence of childhood overweight in the setting of 12-year school- and community-based programmes. Public Health Nutr. 2009 Oct;12(10):1735–42. doi: 10.1017/S1368980008004278. [DOI] [PubMed] [Google Scholar]
- 46.Murray CJ, Lauer JA, Hutubessy RC, Niessen L, Tomijima N, Rodgers A, et al. Effectiveness and costs of interventions to lower systolic blood pressure and cholesterol: a global and regional analysis on reduction of cardiovascular-disease risk. Lancet. 2003 Mar 1;361(9359):717–25. doi: 10.1016/S0140-6736(03)12655-4. [DOI] [PubMed] [Google Scholar]
- 47.Wald NJ, Law MR. A strategy to reduce cardiovascular disease by more than 80% BMJ. 2003 Jun 28;326(7404):1419. doi: 10.1136/bmj.326.7404.1419. [DOI] [PMC free article] [PubMed] [Google Scholar]
- 48.Lim SS, Gaziano TA, Gakidou E, Reddy KS, Farzadfar F, Lozano R, et al. Prevention of cardiovascular disease in high-risk individuals in low-income and middle-income countries: health effects and costs. Lancet. 2007 Dec 15;370(9604):2054–62. doi: 10.1016/S0140-6736(07)61699-7. [DOI] [PubMed] [Google Scholar]
- 49.Danon-Hersch N, Chiolero A, Shamlaye C, Paccaud F, Bovet P. Decreasing association between body mass index and blood pressure over time. Epidemiology. 2007 Jul;18(4):493–500. doi: 10.1097/EDE.0b013e318063eebf. [DOI] [PubMed] [Google Scholar]
- 50.Gregg EW, Cheng YJ, Cadwell BL, Imperatore G, Williams DE, Flegal KM, et al. Secular trends in cardiovascular disease risk factors according to body mass index in US adults. JAMA. 2005 Apr 20;293(15):1868–74. doi: 10.1001/jama.293.15.1868. [DOI] [PubMed] [Google Scholar]
- 51.Intensive blood-glucose control with sulphonylureas or insulin compared with conventional treatment and risk of complications in patients with type 2 diabetes (UKPDS 33). UK Prospective Diabetes Study (UKPDS) Group. Lancet. 1998 Sep 12;352(9131):837–53. [PubMed] [Google Scholar]
- 52.Patel A, MacMahon S, Chalmers J, Neal B, Billot L, Woodward M, et al. Intensive blood glucose control and vascular outcomes in patients with type 2 diabetes. N Engl J Med. 2008 Jun 12;358(24):2560–72. doi: 10.1056/NEJMoa0802987. [DOI] [PubMed] [Google Scholar]
- 53.Gerstein HC, Miller ME, Byington RP, Goff DC, Jr, Bigger JT, Buse JB, et al. Effects of intensive glucose lowering in type 2 diabetes. N Engl J Med. 2008 Jun 12;358(24):2545–59. doi: 10.1056/NEJMoa0802743. [DOI] [PMC free article] [PubMed] [Google Scholar]
- 54.Duckworth W, Abraira C, Moritz T, Reda D, Emanuele N, Reaven PD, et al. Glucose control and vascular complications in veterans with type 2 diabetes. N Engl J Med. 2009 Jan 8;360(2):129–39. doi: 10.1056/NEJMoa0808431. [DOI] [PubMed] [Google Scholar]
- 55.Hu FB, Manson JE, Stampfer MJ, Colditz G, Liu S, Solomon CG, et al. Diet, lifestyle, and the risk of type 2 diabetes mellitus in women. N Engl J Med. 2001 Sep 13;345(11):790–7. doi: 10.1056/NEJMoa010492. [DOI] [PubMed] [Google Scholar]
- 56.Knowler WC, Barrett-Connor E, Fowler SE, Hamman RF, Lachin JM, Walker EA, et al. Reduction in the incidence of type 2 diabetes with lifestyle intervention or metformin. N Engl J Med. 2002 Feb 7;346(6):393–403. doi: 10.1056/NEJMoa012512. [DOI] [PMC free article] [PubMed] [Google Scholar]


