

Abstract
This study identifies a novel crosstalk paradigm between the IGF1R and EGFR in colon cancer cells. IGF1R activation by ligand exposure in growth factor deprived cells induces Akt activation in the FET, CBS and GEO colon cancer cell lines. Investigation of IGF1R mediated signaling pathways using siRNA approaches indicated that, as expected, PI3K was activated by IGF1R. MAPK activity as reflected by phospho-Erk induction was not significantly activated until later times following release of these cells from growth factor deprivation stress. The appearance of phospho-Erk was proximal to EGFR activation. Treatment of cells with the PI3K inhibitor LY294002 prior to release from stress resulted in a concentration dependent loss of EGFR activation while treatment with the MAPK inhibitor PD98059 did not block EGFR activation indicating that EGFR activation was downstream of the IGF1R/PI3K pathway. PD98059 inhibition of MAPK was associated with a concentration dependent reduction in EGFR-mediated phospho-Erk. EGFR inhibitor blocked induction of phospho-Erk showing that MAPK activity was a consequence of EGFR mediated signaling. On the other hand, a small molecule IGF1R inhibitor, PQIP, blocked Akt phosphorylation. The divergent signaling functions of IGF1R and EGFR suggested the potential for synergism by a combination of therapy directed at the 2 receptors. Combination treatment with PQIP and EGFR inhibitor Tarceva resulted in synergistic effects as indicated by combination index analysis in all 3 cell lines tested.
Introduction
The IGF1R signaling pathway is an important growth regulatory pathway that is prevalent in a variety of cancer types including colon cancer (1-3). Both IGF1 and insulin are capable of binding and activating the IGF1R. Ligand binding induces receptor autophosphorylation at the tyrosine kinase domains, which in turn phosphorylates the tyrosine residues on various substrates and adaptor proteins (4). Two of the key substrates of the IGF1R are the insulin receptor substrate 1 (IRS1) and the src homology collagen like (Shc) docking protein. When IRS1 is phosphorylated it can recruit other signaling messengers including phosphatidylinositol 3’-kinase (PI-3 kinase), leading to downstream activation of diverse signaling cascades. The IGF1R can also activate Shc protein which leads to the activation of the mitogen activated protein kinase (MAP kinase). The PI-3 and MAP kinases influence key cell survival and proliferation events (2, 3, 5, 6).
Previous work had shown that IGF1R activation is crucial for the mitogenic and transforming activity of the EGFR (7). However, it was not clear whether IGF1R was upstream or downstream of EGFR in this cooperative relationship (8). We determined that the IGF1R was upstream of EGFR during mitogenesis and mediated cell cycle reentry from a quiescent state through the induction of TGF mediated activation of the EGFR (9).
The FET colon carcinoma cell line is derived from an early stage colon tumor. This cell line is poorly tumorigenic, well differentiated, and has been characterized as growth factor dependent, since FET cells require exogenous growth factor supplementation including transferrin and insulin in serum free media for proliferation (10-13). Previous studies demonstrated that the mitogenicity of insulin (at the concentrations used) in cultures of these cells is not through the insulin receptor but instead through the type I insulin-like growth factor receptor (IGF1R). Moreover, IGF1R activation led to the subsequent activation of the EGFR which then stimulated re-entry into the cell cycle by cells in G0 (14). A similar dependence upon IGF1R activation has been demonstrated for CBS and GEO cell lines as well.
Major signaling pathways activated by the IGF1R and EGFR include the PI3K and MAPK pathways. Since these receptors appear to be so similar in their signaling mechanisms it was of interest to study their cooperative mechanism in more detail. Previous studies had not addressed the signaling mechanisms underlying this cooperative relationship between the 2 receptors. Consequently, we asked whether they activate the same pathways in the context of crosstalk thereby contributing to the overall amplitude of signaling or whether they stimulated different pathways that contributed to different cellular functions. Here we demonstrate that inhibition of the IGF1R mediated activation of the PI-3 kinase pathway results in the inhibition of EGFR activation. The MAP kinase pathway does not appear to be directly involved with the activation of IGF1R. However, IGF1R has an indirect role in the activation of the MAP kinase pathway as MAPK is dependent upon EGFR signaling in these cells. Moreover, MAPK is a key determinant of the biological effect of the IGF1R and EGFR crosstalk as EGFR mediated MAP kinase activity is required for DNA synthesis in this group of cell lines. Moreover, a combination of IGF1R and EGFR inhibition achieved synergy of growth inhibition in all 3 cell lines.
Materials and Methods
Cell culture
The human colon carcinoma cell lines were originally developed from primary tumors and have been extensively characterized (10-14). Cells are maintained in a chemically defined serum free medium consisting of McCoy’s 5A medium (Sigma-Aldrich, St. Louis, MO) supplemented with amino acids, pyruvate, vitamins, antibiotics, and the growth factors transferrin (4 μg/ml, Sigma-Aldrich) and insulin (20 μg/ml, Sigma-Aldrich) and EGF (10ng/ml, R&D Systems, Minneapolis, MN). Supplemented McCoy’s medium (“SM”) is McCoy’s 5A medium supplemented with antibiotics and nutrients but lacking any growth factors. “TI” medium is SM plus transferrin and insulin, whereas the normal culture medium (“TIE” or “SF”) is TI medium plus EGF. FET cells were adapted to TI medium. Cultures were maintained at 37°C in a humidified atmosphere of 5% CO2. Cells were routinely subcultured with a 0.25% trypsin (Invitrogen, Carlsbad, CA) in Joklik’s medium (Invitrogen) containing 0.1% EDTA.
Antibodies, immunoblot and immunoprecipitation (IP)
Anti-EGFR polyclonal, anti-phospho-EGFR Y1173, anti-PI3-Kinase (p85), anti-IRS-1 polyclonal, anti-IGF1Rβ polyclonal, anti-Erk polyclonal and anti-phospho-Erk monoclonal antibodies, were from Santa Cruz Biotechnology (Santa Cruz, CA). Anti-phospho-IGF1R antibody (15) was obtained from Calbiochem (San Diego, CA). Anti-phosphotyrosine RC-20 antibody (for western blot) and anti-phosphotyrosine PY20 monoclonal antibody (for immunoprecipitation) were from BD Biosciences (San Jose, CA). Anti-phospho-EGFR Y1068 and Y1086, anti-phospho-Akt Ser473, anti-Akt polyclonal, anti-activated p38, anti-caspase 7 polyclonal antibodies were from Cell Signaling Technology, Inc. (Danvers, MA). Anti-actin and anti-tubulin antibodies were from Sigma-Aldrich. Immunoblot and immunoprecipitation (IP) were carried out as previously described (16).
Cell lysate preparation
Cultured colon carcinoma cells (FET, GEO and CBS) were allowed to grow to 80-90% confluence in 100mm culture plates or, in the case of inhibitor studies, 6 well tissue culture plates. The medium was changed to SM medium and the cells were made quiescent through nutrient and growth factor deprivation for 5 days. Cells were then released in TI/TIE medium (growth factor and nutrient replenishment) or SM (nutrient replenishment alone) and harvested at various time points as indicated in the figures. In inhibitor studies, cells were treated with various concentrations of inhibitors upon release from quiescence and were harvested at the time points indicated in the figures for dose response studies. Cells were washed in phosphate buffered saline (PBS) and collected in lysis buffer (50 mM Tris [pH 7.4], 100mM NaCl, 1% NP-40, 2mM EDTA, 0.1% SDS, 50mM NaF, 10mM Na3VO4, 1mM PMSF, 25 μg/ml β-glycerophosphate and one protease inhibitor cocktail tablet from Roche). Crude cell lysates were passed through a 21 gauge needle to shear DNA and lysed for 30 minutes at 4°C. Cell lysates were then cleared by centrifugation at 21,000 rpm for 15 minutes at 4°C and protein concentrations were determined by the Pierce BCA protein assay (Pierce Biotechnology, Rockford, IL).
[3H]-thymidine incorporation assay (Mitogenesis)
Confluent FET cells were growth arrested by growth factor and nutrient deprivation for 5 days in SM medium and subsequently released from growth arrest by providing fresh nutrients (SM) or nutrients and growth factors (TI). Cells were pulsed for one hour with 25 μCi [3H]-thymidine (GE Healthcare Bio-Sciences). The free thymidine was removed and the cells were washed with ice-cold PBS. Trichloroacetic acid (TCA) was added and the precipitated radioactivity was solubilized in 0.2 M NaOH solution. Radioactive incorporation into DNA was then determined (17). For inhibition of mitogenesis studies, cells were treated with various concentrations of inhibitors at the time of release from quiescence. Cells were then pulsed and assayed for radioactive incorporation as described above.
IGF1R siRNA transfection and knockdown of p110α protein using siRNA
Silencer validated IGF1R siRNA was obtained from Ambion (Austin, TX) while the PIK3CA smartpool consisting of four small interfering RNA duplexes (18) was used against PIK3CA, and the scrambled control siRNA was from Qiagen (Cambridge, MA). FET cells were plated in antibiotic free “10F” medium (supplemental McCoy medium containing 10% Fetal Bovine Serum [FBS, Mediatech, Inc., Herndon, VA]) at a density of 200,000 cell/well in 6 well plates. The cells were allowed to attach overnight. 10F media were changed once 30’ before transfection. The transfection was carried out using Lipofectamine2000 from Invitrogen (Carlsbad, CA) and was performed according to the manufacturer’s instructions. The plates were washed once with “TI” medium (supplemental McCoy medium containing transferrin and insulin) 5 hours after transfection and replenished with TI medium. The culture media (TI) were changed again after 48 hours. The cell lysates were collected 72 hours after transfection.
DNA Fragmentation Assay (Cell Death Detection ELISA)
FET cells were plated at a density of 10,000 cells per well in SF medium in 96-well plates, and allowed to attach overnight at 37°C. The cells were changed to TI medium 24 hours later and treated with either PD98059 or LY294002 at the indicated concentrations for another 72 hours at 37°C. DNA fragmentation was detected by the Roche Cell Death Detection ELISA kit according to the manufacturer’s instructions (Roche, Germany).
Cell Proliferation Inhibition Assay
Cell proliferation was evaluated by 3-(4,5-dimethylthiazol-2-yl)2,5-diphenyltetrazolium bromide (MTT; Sigma) assay as described earlier (19). Briefly, FET, GEO and CBS cells were seeded in 96-well tissue culture plates (Costar, Corning, NY) at 8,000 cells per well per 100 μl. Cells were allowed to attach overnight and then were treated with 100 μl serial concentrations of PQIP, Tarceva, and the combination of PQIP plus Tarceva at constant ratios indicated in the text. After 72 hours drug exposure at 37°C, MTT solution (50 μl, 2 mg/ml) was added to each well. The reaction was stopped by removal of MTT after 2 hours incubation at 37°C. DMSO (150 μl) was added to dissolve formazan crystals. Absorbance at 570 nm was recorded using a 96-well plate reader.
Combination Index Value Analysis
The combination index (CI) was determined by the Chou and Talalay method, a well-established mathematical analysis to determine the pharmacological interaction between two drugs (20). The CI value of nonexclusive drugs is calculated by the following formula:
where Da and Db are the doses of drug A and B which inhibit X% of cell proliferation as single drugs, and Dxa and Dxb are doses of drug A and B which inhibit X% of cell growth in a combination regimen. CI = 1 indicates an additive effect of the two drugs and the CI formula is the same as a traditional isobologram equation. Synergism is defined as more than the expected additive effect yielding a CI < 1 while antagonism has a CI > 1. CI values were analyzed using Calcusyn software (Biosoft, Ferguson, MO) and previously described (19, 21). Inputs for the equation below are the concentrations of single inhibitors, the combination doses at fixed ratios, and the fractional inhibition [fraction affected (Fa)] of single drugs and combinations. The equation is given by Fa = (A570 control −A570 treated) / A570 control, while the fraction of unaffected cells (Fu) = 1−Fa.
Results
PI3 kinase is downstream of the IGF1R mediated induction of TGFα in colon carcinoma cells
FET cells were growth arrested by nutrient and growth factor deprivation as described in Materials and Methods. IGF1R expression levels remain constant during growth arrest and do not differ after release from growth arrest by TI medium. However, the IGF1R is activated within five minutes of release from quiescence by TI. On the other hand, the activation of the EGFR is not significantly induced until one hour after TI release from growth arrest (Figure 1A). This observation was consistent with previous studies demonstrating that EGFR expression was not observed until this time point (9, 14).
Figure 1. Receptor signaling activation after TI release.
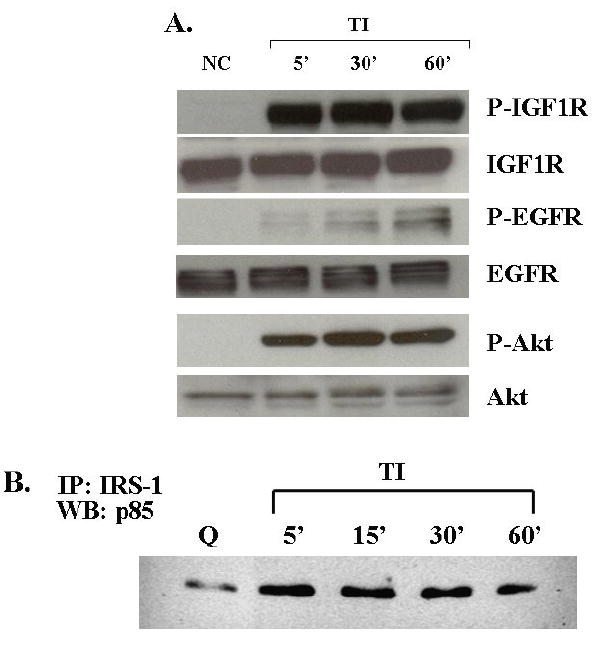


A. Detection of IGF1R and EGFR activation after release: FET cells were starved for 5 days in growth factor null medium and then stimulated to re-enter the cell cycle by addition of medium containing transferrin and insulin (TI) for 5’, 30’ and 60’ as indicated. Lysates were separated by SDS-PAGE. The proteins were transferred onto nitrocellulose and subjected to antibodies for immunoblot analysis. NC, no change. PI-3 kinase pathway activation upon TI release from quiescence: Lysates collected after TI release from quiescence were subjected to SDS-PAGE and blotted for phospho-Akt antibody. The blot was stripped in stripping buffer (62.5mM Tris-HCl [PH 6.8], 100mM β-mercaptoethanol, 2%SDS, 30’ at 50°C) and re-blotted for Akt antibody. B. FET cell lysates (200 μg) from different time points after TI release were immunoprecipitated with IRS-1 antibody, the immunocomplex was then incubated with protein A-agarose, the pellet was washed and eluted using lysis buffer, the protein were resolved by 7.5% SDS-PAGE and then visualized by immunoblotting the p85 subunit of PI-3 kinase. C. Detection of IGF1R and Akt activation after release in CBS cells: similar protocols as described above were applied to CBS cells. D. Erk activation: FET cell lysates from different time points after TI release were subjected to SDS-PAGE and blotted for phospho-Erk. The blot was stripped and re-blotted for total Erk antibody. Q: quiescence.
In contrast to release from growth arrest by TI medium, release in medium without an IGF1R ligand (insulin in this study) results in only modest DNA synthesis, and does not result in the activation of the IGF1R (9, 13). This indicates IGF1R plays an important role in the regulation of cell cycle re-entry in FET cells. We next investigated IGF1R mediated signaling pathways involved in this function. To determine the mechanism by which the IGF1R stimulates autocrine TGFα (9) activation kinetics of two key signaling pathways activated by the IGF1R (PI3 kinase and MAP kinase pathways) were determined. A dramatic increase in Akt phosphorylation was detected after release from quiescence (Figure 1A). Furthermore, immunoprecipitation of IRS1, an IGF1R substrate, and the p85 subunit of the PI3 kinase indicated an increase of IRS1-p85 complex formation after 5 minutes release in TI medium (Figure 1B). These lines of evidence indicate PI3 kinase is downstream of IGF1R activation. This phenomenon is not restricted to the FET cell line model as we observed similar IGF1R/Akt activation after 5 minutes release in TI medium in growth arrested CBS (Figure 1C) and GEO (not shown) cells. Unlike the kinetics of PI3 kinase activation, very little MAP kinase activity (as reflected by Erk activation) was observed until one hour after TI release (Figure 1D). This time point corresponds to the time at which the EGFR is significantly activated, suggesting that the bulk of MAP kinase activity observed may be a consequence of EGFR signaling, and that IGF1R was not significantly contributing directly to the MAP kinase activation.
Inhibition of PI3 kinase pathway blocks EGFR activation
FET cells were treated with the PI3 kinase inhibitor LY294002, to block the PI3 kinase pathway (22). Mitogenesis assays of LY294002 treated cells showed that 25 μM of LY294002 inhibited DNA synthesis to levels comparable to those observed upon release in the absence of insulin (SM) (Figure 2A). We utilized the loss of Akt activation as a marker of PI3 kinase pathway blockade since this molecule is downstream of PI3 kinase. Since robust EGFR activation begins at 60 minutes following TI release, we performed the assays at this time point. Concentration dependent inhibition of Akt activation by LY294002 similar to that of inhibition of mitogenesis was observed (Figure 2B).
Figure 2. PI-3 kinase inhibitor LY294002 treatment.
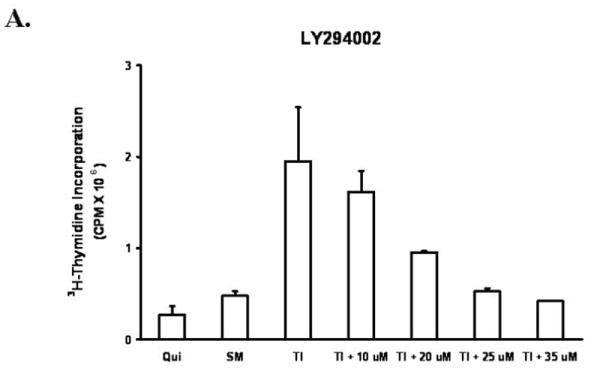
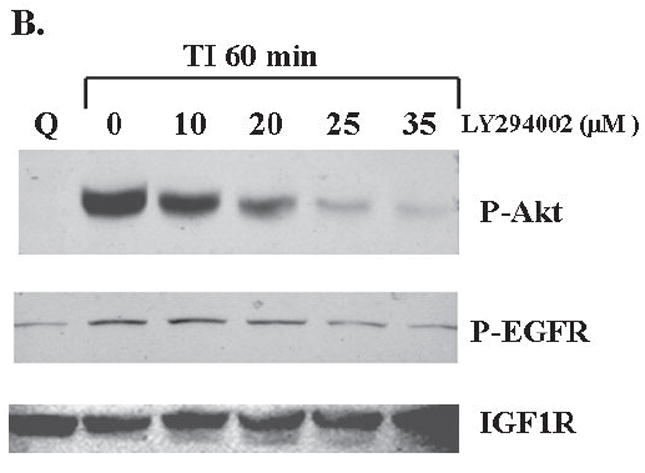
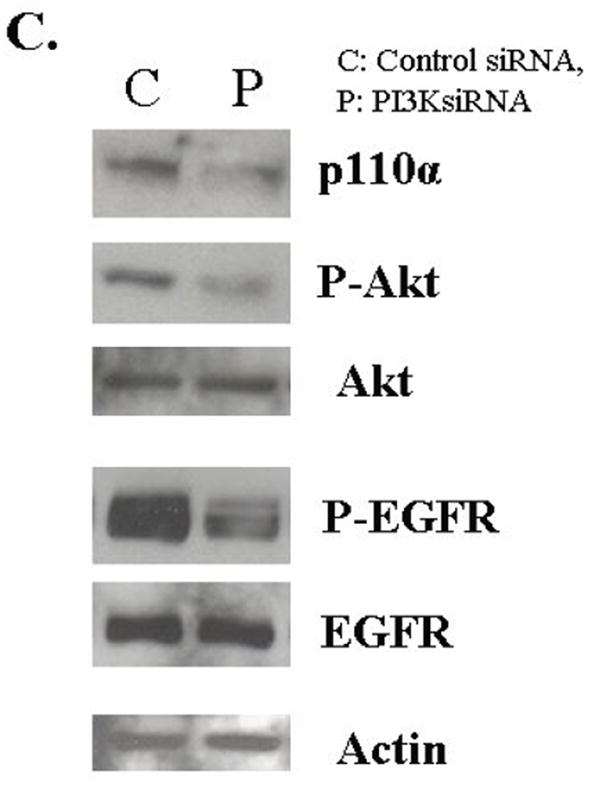
A. The mitogenesis assay was performed as described in “Materials and Methods”. FET cells were treated with increasing concentrations of LY294002 prior to release and grown for 22 hours. Cells were then pulsed with 25 μCi of tritiated-thymidine for one hour to analyze for DNA synthesis. (mean ± s.d.; n=3). SM: supplemental McCoy’s medium; TI: SM medium containing transferrin and insulin. B. Quiescent FET cells were treated with various concentrations of LY294002 for 30’ prior to TI release (60’) and the lysates obtained were analyzed for the activation of Akt and EGFR. C: FET cells were transfected with PIK3CA siRNA to down-regulate p110α as described in “Materials and Methods”. Lysates were analyzed for p110α, the activation of Akt and EGFR. Actin was used as a loading control.
If the PI3 kinase pathway is involved in the IGF1R mediated induction of EGFR activation, then inhibition of this pathway should block the activation of the EGFR. To test this hypothesis, we used two approaches. First we treated cells with LY294002 and assayed for EGFR activation. We found that treatment of LY294002 results in the inhibition of EGFR activation (Figure 2B). We also performed transfection of siRNA to the p110α subunit of PI3K in FET cells. The transfection knocked down PIK3CA protein expression resulting in down-regulation of phospho-Akt and inhibition of EGFR activation (Figure 2C). Thus, the activation of the PI3 kinase pathway is required for the induction of EGFR activation during mitogenesis.
Inhibition of MAP kinase pathway does not affect EGFR activation
To block the activation of the MAP kinase pathway, we used the MEK inhibitor PD98059 (23). We first performed a mitogenesis assay to determine the suitability of the concentrations selected. Figure 3A shows that 6-10 μM of PD98059 inhibits DNA synthesis to SM levels. Treatment of FET cells with PD98059 also resulted in a concentration dependent inhibition of Erk activity at one hour after release from growth arrest (Figure 3B). We determined the effect of PD98059 on p38, a protein closely related to MAP kinase in order to ensure selectivity for the Erk pathway. PD98059 was selective for the Erk pathway as it did not inhibit p38 activation at the concentrations used (Figure 3B). The role of the MAP kinase pathway in EGFR activation was then investigated with PD98059 treatment. The result shows that PD98059 does not inhibit EGFR activation (Figure 3B). These data indicated that the MAP kinase pathway is not involved in the regulation of the EGFR activation.
Figure 3. Inhibition of MAP kinase activation by MEK inhibitor PD98059.
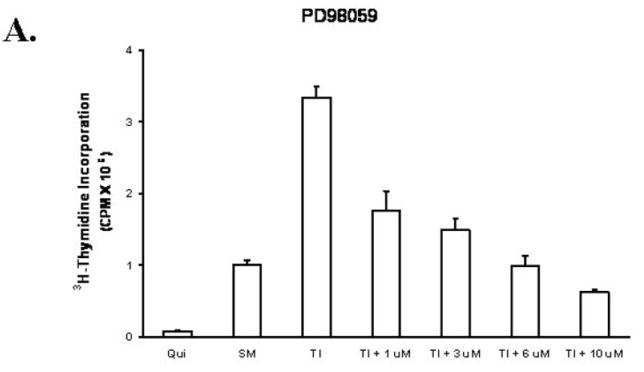
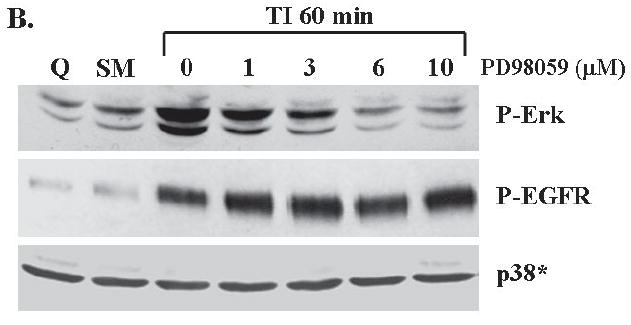
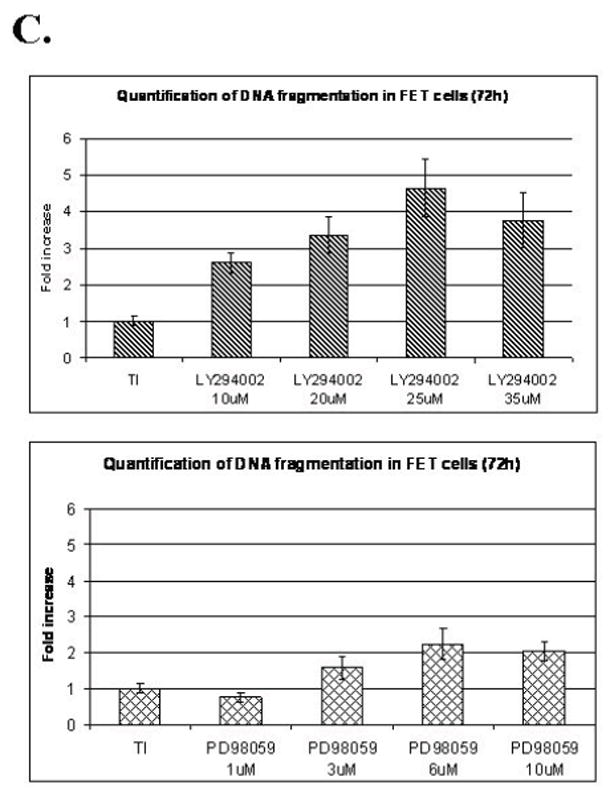
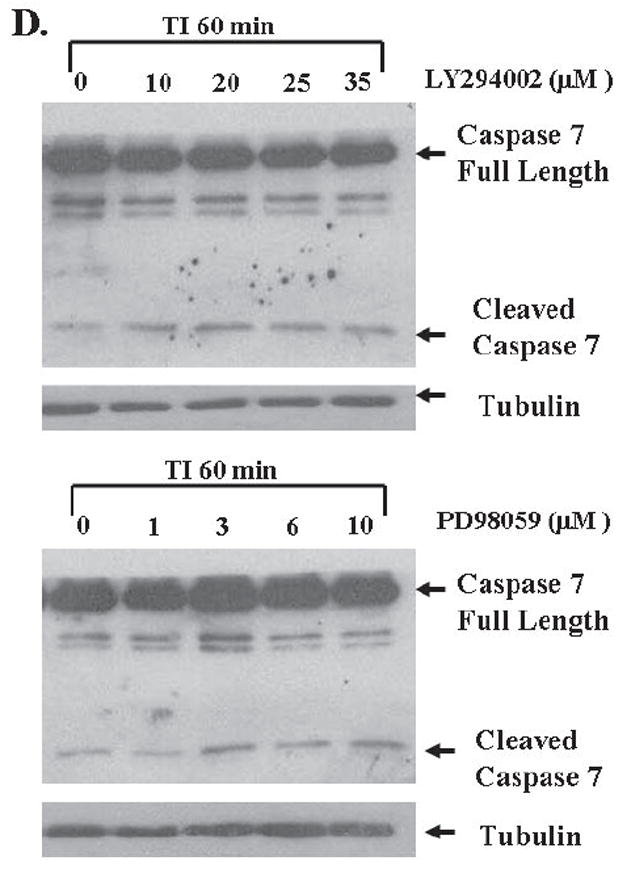
A. The mitogenesis assay was performed as described in “Materials and Methods”. Similar to LY294002 treatment, FET cells were treated with increasing concentrations of PD98059 (mean ± s.d.; n=3). Quiescent cells were treated with various concentrations of PD98059 as indicated for 30’ prior to TI release (60’) and the lysates obtained were analyzed for the activation of Erk, p38 and EGFR (B). C and D. Contributions of PI3 kinase and MAP kinase pathways to cell survival: FET cells were seeded at 10,000 cells/well in 96-well plates and allowed to adhere overnight. The next day, media were changed to TI medium and cells were treated with either PD98059 (1, 3, 6, 10μM) or LY294002 (10, 20, 25, 35μM) as described in Materials and Methods. Death Detection ELISA assays were performed and absorbance was measured at 405 nm (mean ± s.d.; n=3) (C). D. Quiescent FET cells were treated with either PD98059 (1, 3, 6, 10μM) or LY294002 (10, 20, 25, 35μM) with TI release and whole cell lysates were resolved by SDS-PAGE, and immnoblotted with caspase 7 antibody. Anti-tubulin antibody was used as a loading control.
PI3 kinase pathway participates in cell survival
Since IGF1R regulated PI3 kinase activates EGFR through TGFα (9), and MAP kinase activation is subsequent to the activation of EGFR during mitogenesis, this raises the question of the function of the two receptors and the pathways activated by them. To address this issue we performed DNA fragmentation assays and found that the selective PI3 kinase inhibitor LY294002 induced apoptosis in FET cells grown in TI medium. Inhibition of activated Akt by 25μM of LY294002 resulted in approximately a 5-fold increase of apoptosis as reflected by DNA fragmentation assays. On the other hand, MEK inhibition by PD98059 resulted in a more modest 2-fold induction of apoptosis (Figure 3C). Caspase 7 cleavage assays confirmed that both inhibitors increased apoptosis in FET cells released in TI medium after growth factor deprivation stress (Figure 3D). Thus, while PI3 kinase plays a dominant role in cell survival, the MAP kinase pathway elicited by IGF1R mediated EGFR activation also participates in the support of cell survival signaling.
Inhibition of EGFR blocks MAP kinase activation
The MAP kinase activation studies showed that Erk activation occurs at about 60 minutes following growth factor addition. This coincides with robust EGFR activation (Figure 1). Taken together with the finding that inhibition of MEK does not inhibit EGFR activation (Figure 3B), we hypothesized that MAP kinase activation is derived from EGFR activation. To test this, we treated FET cells with AG1478, a selective EGFR inhibitor which has been widely used as a tool in studying EGFR mediated signal transduction (24-26). Cells were treated with various concentrations of AG1478 prior to release from quiescence. Figure 4A shows that at 0.5 μM AG1478 inhibited the DNA synthesis of FET cells in TI medium. As observed in Figure 4B, this concentration of AG1478 also blocks the activation of the EGFR at one hour of release. We then treated FET cells with AG1478 and determined its effects on Erk activation at one hour after release from growth arrest. AG1478 inhibited the activation of Erk that was observed at one hour of release in TI in the absence of the inhibitor (Figure 4C). This demonstrates that MAP kinase activity is downstream of EGFR activation. AG1478 treatment did not affect the activation of p38 in this cell line (Figure 4C). We assessed whether AG1478 treatment was inhibiting IGF1R activation. Again in figure 4C, the result shows the activation of IGF1R at 60 minutes of TI release in the presence of 0-5 μM of AG1478. As expected, AG1478 does not affect IGF1R activation, thereby indicating selective effects on this tyrosine kinase receptor.
Figure 4. Inhibition of EGFR by AG1478 blocks MAP kinase activation.
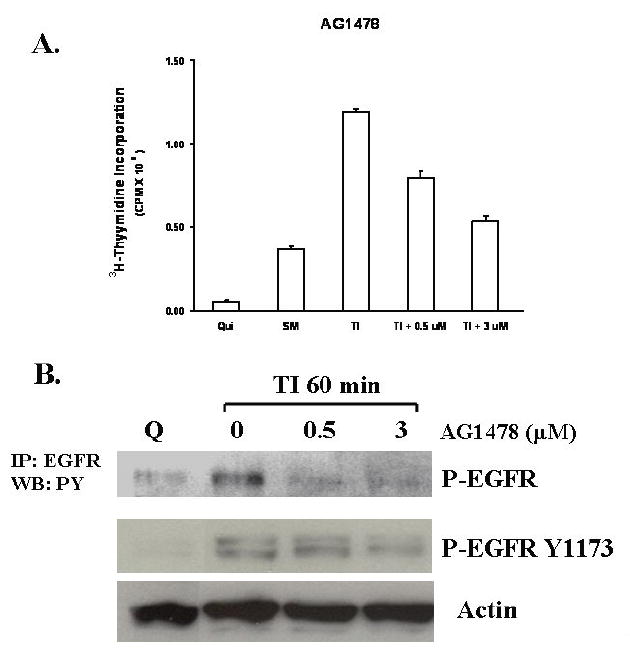
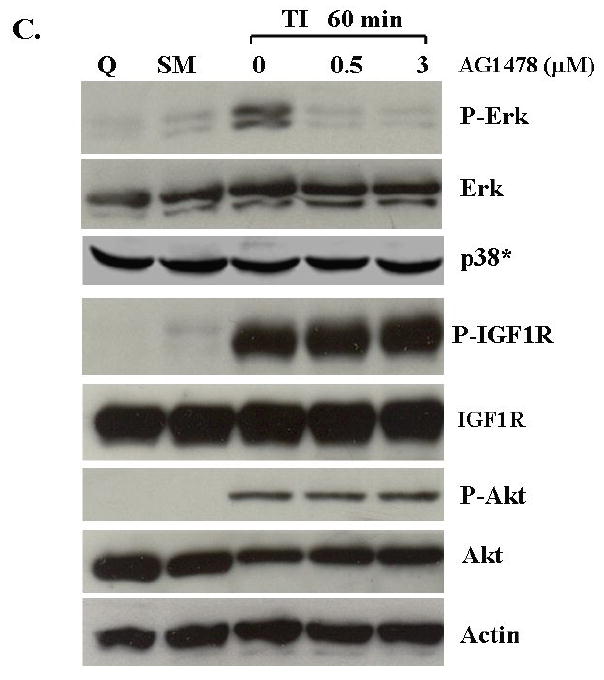
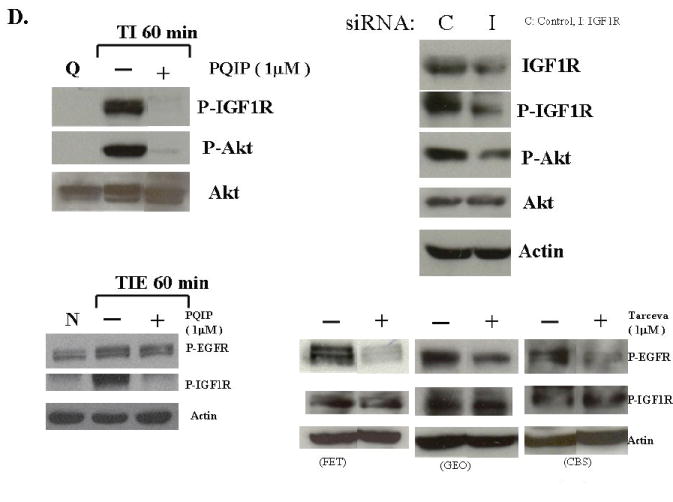
A. The mitogenesis assay was performed as described in “Materials and Methods”. Quiescent FET cells were treated with increasing concentrations of AG1478 as indicated (mean ± s.d.; n=3). B. Cells were treated with various concentrations of AG1478 for 30’ prior to TI release (60’) and the lysates were incubated with the EGFR antibody. The antibody-antigen complex was then precipitated with protein A-agarose and resolved by 7.5% SDS-PAGE followed by immunoblotting with the phosphotyrosine antibody RC-20. EGFR activation was also detected by using an anti-phospho-EGFR Y1173 antibody (Santa Cruz) (B). C. Lysates were also analyzed for the activation of Erk, p38 and Akt. IGF1R phosphorylation was measured either by an anti-phospho-IGF1R antibody (shown) or by incubating cell lysates with PY-20 antibody and the immunocomplex was then precipitated with protein A-agarose and resolved by 7.5% SDS-PAGE followed by IGF1R immunoblotting (not shown). D. Inhibition of IGF1R activation down-regulated phospho-Akt: Quiescent cells were treated with 1 μM of PQIP for 30’ prior to TI release (60’) and the lysates obtained were analyzed for the activation of IGF1R and Akt. Total Akt was also used as a loading control. Q: quiescence. TI: supplemental McCoy’s medium containing transferrin and insulin. FET cells were transfected with IGF1R siRNA to down-regulate IGF1R as described in “Materials and Methods”. Lysates were analyzed for IGF1R and the activation of IGF1R and Akt. Actin was used as a loading control. PQIP does not block EGFR phosphorylation in EGF stimulated cells: cells were treated with 1 μM of PQIP for 30’ prior to TIE release (60’) and the lysates obtained were analyzed for the activation of IGF1R and EGFR. Actin was used as a loading control. N: no change. TIE: supplemental McCoy’s medium containing transferrin, insulin and EGF. Tarceva fails to affect IGF1R signaling: cells were treated with 1 μM of Tarceva for 30’ and the lysates obtained were analyzed for the activation of EGFR and IGF1R.
We next tested the role of EGFR on the activation of the PI3 kinase pathway components. Figure 4C shows the lack of effect of AG1478 treatment on activated Akt levels. AG1478 does not show any inhibition of phospho-Akt at 0.5 μM treatment, the concentration of the drug at which EGFR activation and DNA synthesis are inhibited. Moreover, higher AG1478 concentrations (5-20 μM) did not inhibit activated IGF1R nor Akt phosphorylation, but did effectively block Erk activation (data not shown), further indicating that PI3 kinase/Akt axis plays a role downstream of IGF1R while the MAP kinase pathway is under EGFR control in this cell line and is necessary for re-entry into the cell cycle as reflected by indication of DNA synthesis.
Inhibition of IGF1R activation blocks Akt phosphorylation
Akt activation correlates with IGF1R activation after TI release described earlier in this study (Figure 1). If PI3 kinase activation is downstream of IGF1R, inhibition of IGF1R activation would result in blockade of Akt phosphorylation. To address this issue, we utilized two approaches. First we used an IGF1R kinase inhibitor, PQIP (27), to inhibit IGF1R activation. 1 μM of PQIP effectively inhibited IGF1R phosphorylation in FET cells released in TI medium, and the drug inhibited Akt phosphorylation as well (Figure 4D, upper left panel). However, this compound does not block EGFR phosphorylation in EGF stimulated cells, confirming its specificity for IGF1R (Figure 4D, lower left panel). We next used IGF1R siRNA transfection to down-regulate IGF1R protein in FET cells. IGF1R siRNA effectively reduced IGF1R protein and activation level. Activation of Akt was also inhibited (Figure 4D, upper right panel), further indicating that PI-3 kinase/Akt axis is a downstream pathway of IGF1R in FET cells.
Growth inhibition of colon carcinoma cells by combination treatment of PQIP and Tarceva
Given the differences in function between IGF1R and EGFR activated pathways we hypothesized that inhibition of both IGF1R and EGFR activation in colon cancer cells would be synergistic. We first determined the growth inhibitory effects of PQIP, an IGF1R kinase inhibitor, and Tarceva (erlotinib, (28)), an EGFR kinase inhibitor in colon cancer cells. (Treatment of colon cancer cell lines FET, CBS and GEO confirms that Tarceva fails to affect IGF1R signaling [Figure 4D, lower right panel]). Drug concentrations and growth inhibitory effects were analyzed by Calcusyn software (Biosoft). IC50 values of PQIP and Tarceva against FET cells were 0.28 μM and 3.33 μM, respectively, as determined by 72-hour drug exposure in MTT assays (Table 1). A fixed ratio of concentrations of PQIP/Tarceva at 1:9 was utilized in combination treatments based on the relative IC50 values. The concentrations of PQIP in the combination experiments ranged from 0.025 – 3.2μM, whereas the concentrations of Tarceva were correspondingly 9-fold higher. Growth inhibition effects were measured after 72 hours of drug exposure and plotted as a median-effect plot as well as a dose-effect curve (Figure 5A). The median-effect plot shows the linear relationship between the ratio of the Fa to the Fu where Fu = 1 − Fa, and drug concentrations are in log values. IC50 values of single drugs or the combination regimens can be determined from the X-axis intersection value of the lines, where log (Fa/Fu) = 0. We observed a concentration-dependent inhibition of cell growth in both PQIP and Tarceva treatments alone as shown in the dose-effect curve. The shapes of the curves were different for PQIP and Tarceva, which reflected the different slopes in the median-effect plot. In both the median-effect plot and the dose-effect curve, the combination treatment of PQIP and Tarceva showed a parallel shift to the left in comparison with the single drugs when the inhibitory effect of combinations was plotted against the concentration of each drug. This indicated higher sensitivity of FET cells to the combination treatment than to the single drugs. Significantly, 11- and 15-fold decreases in the concentrations of PQIP and Tarceva, respectively, were sufficient for 50% inhibition of tumor cell proliferation at the 1:9 ratio combination compared with the IC50 value of either drug alone (Table 1). Moreover, the isobologram showed that the combination of PQIP plus Tarceva achieved more than an additive effect, as the all of data points from combinations fell below the line defined from the concentrations of single agents at 90% (ED90), 75% (ED75), and 50% (ED50) inhibition, respectively (Figure 5A). To further determine whether the inhibitory effects of targeting both IGF1R and EGFR kinase activity by the combination of PQIP plus Tarceva were synergistic, we analyzed the combination index (CI) values of PQIP plus Tarceva using Calcusyn software (Materials and Methods). Synergism (CI < 1) was observed at the combination concentrations used with a PQIP/Tarceva ratio of 1:9 (Figure 5A). In fact, a strong synergistic effect (CI < 0.3) was determined at all combination concentrations tested in FET cells. Synergistic results were also observed in CBS and GEO cell lines (Table 1 and figure 5, B and C).
Table 1.
IC50 values of PQIP (P) and Tarceva (T) and P+T at constant ratio in FET, CBS and GEO cells
| IC50 value* | PQIP (μM) | Tarceva (μM) | ||||
|---|---|---|---|---|---|---|
| Treatment | FET | CBS | GEO | FET | CBS | GEO |
| PQIP single drug | 0.28 ± 0.14 | 0.64 ± 0.12 | 0.24 ± 0.14 | NA | NA | NA |
| Tarceva single drug | NA | NA | NA | 3.33 ± 0.15 | 9.91 ± 1.29 | 0.99 ± 0.10 |
| P+T (1:9 for FET, 1:10 for CBS, 1:2 for GEO) | 0.025 ± 0.005 | 0.081 ± 0.025 | 0.044 ± 0.029 | 0.223 ± 0.048 | 0.806 ± 0.255 | 0.089 ± 0.057 |
IC50 values were determined from MTT data after 72 hours drug treatment by Calcusyn software. Representative data of two repeated experiments were shown here.
Figure 5. Synergistic effect of PQIP and Tarceva on growth inhibition in colon cancer cells.

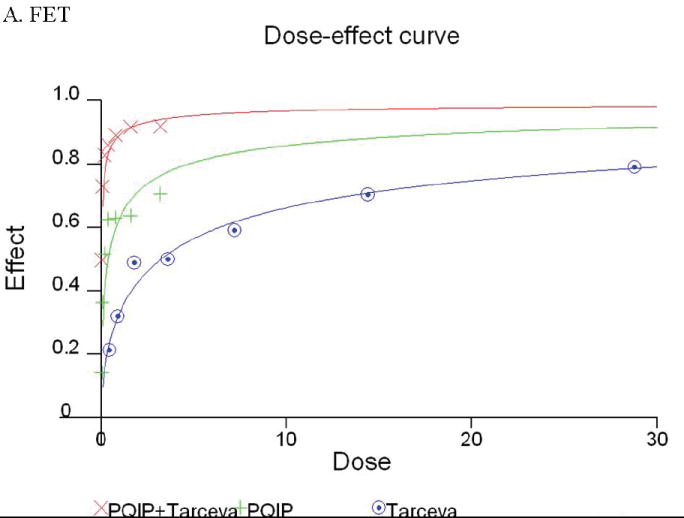
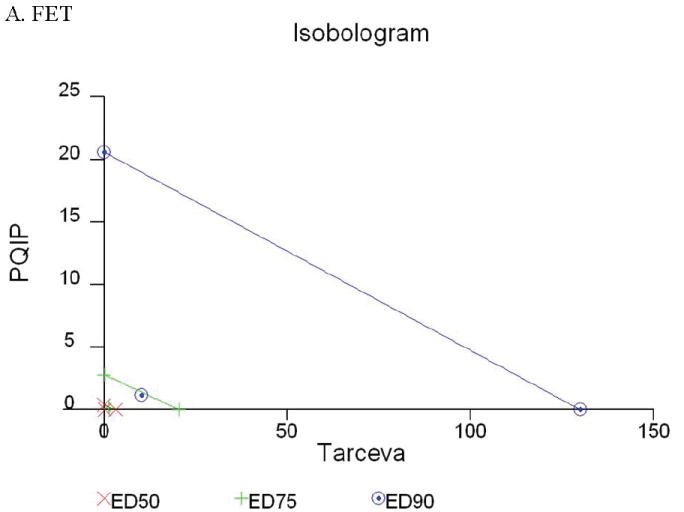
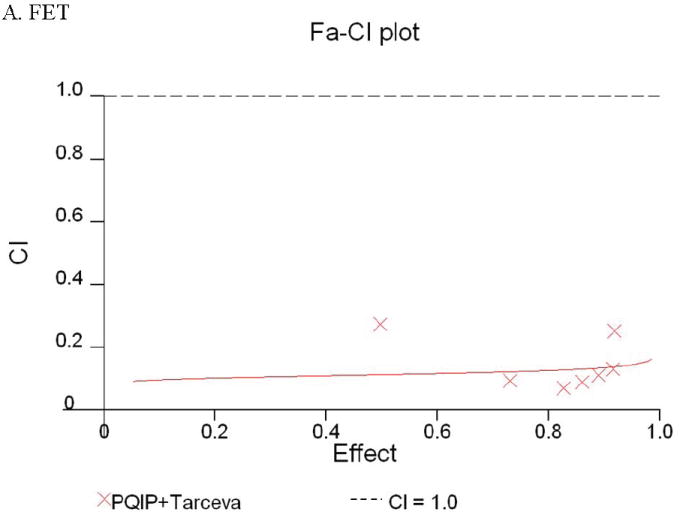
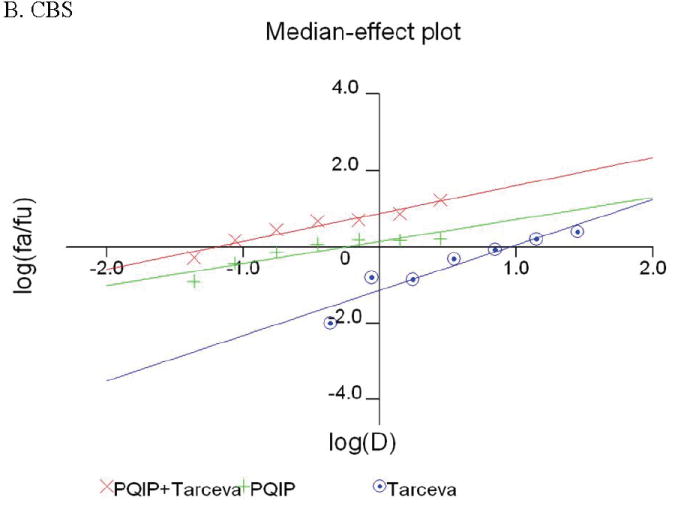
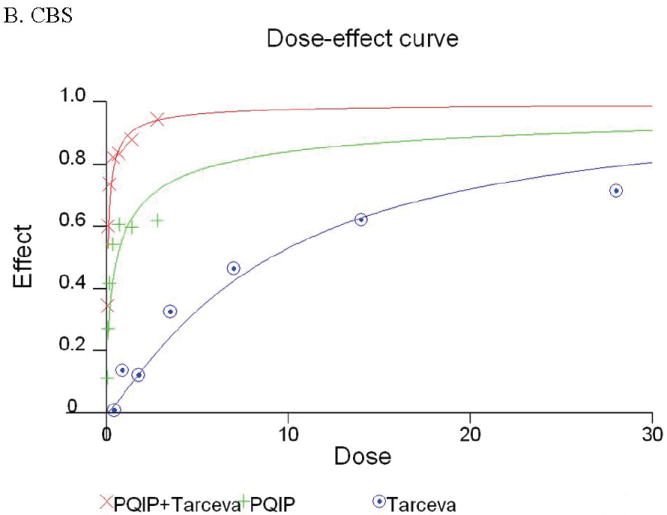
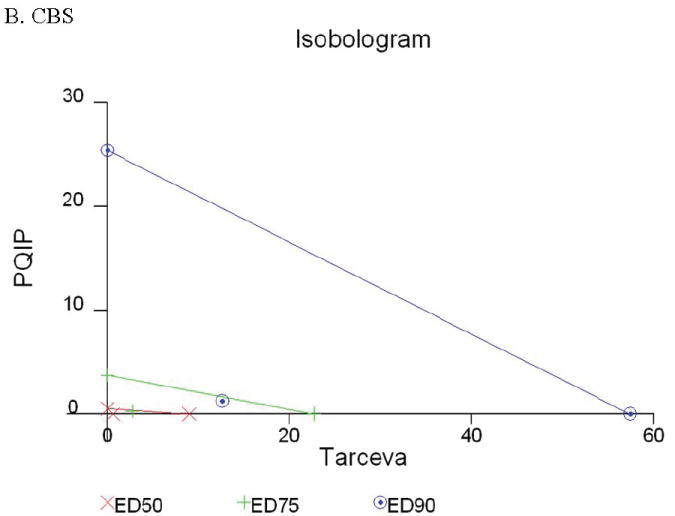


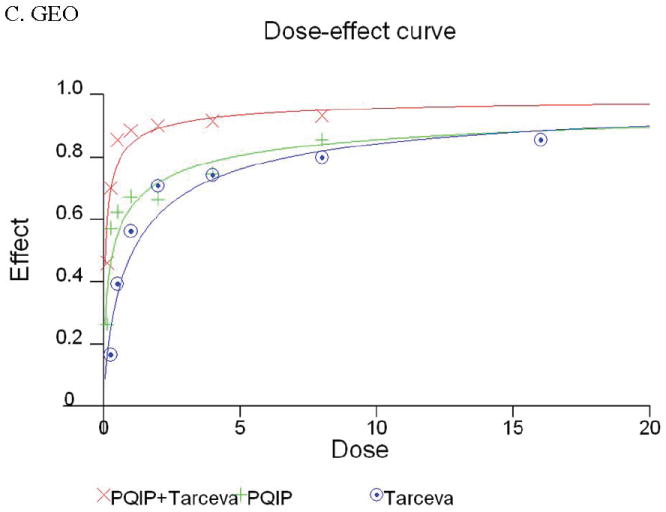
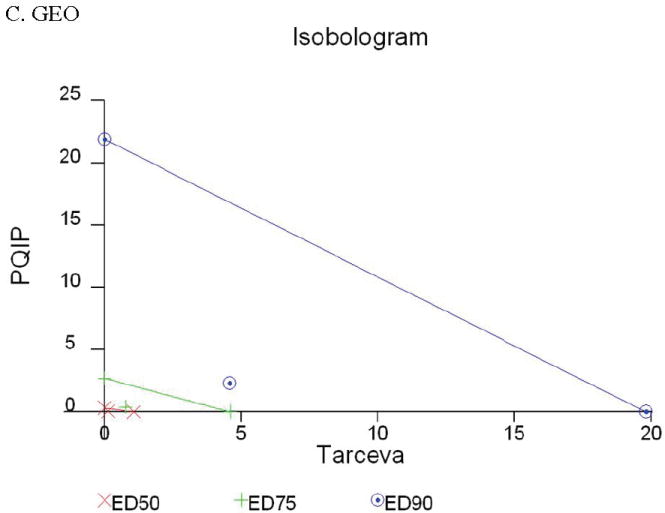
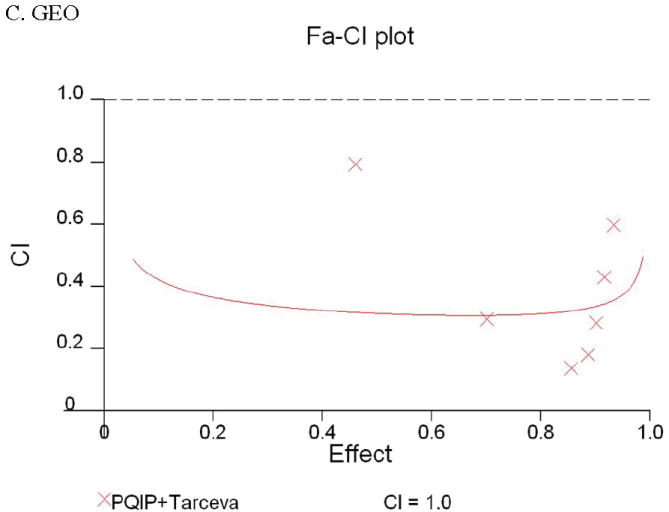
Growth inhibition of FET (A), CBS (B) and GEO (C) cells with PQIP, Tarceva, and PQIP + Tarceva at 1:9. 1:10 and 1:2 ratios were measured by MTT assay as described in Materials and Methods. Upper left: the value of log (Fa/Fu) of PQIP + Tarceva was plotted against Tarceva concentrations used in the combinations in a median-effect plot. Upper right: the Fa for PQIP + Tarceva was plotted against the concentrations of PQIP used in the combinations in a dose-effect curve. Lower left: ED90, ED75, and ED50 values of PQIP and Tarceva are indicated on the Y-axis and X-axis of the isobologram, respectively. Concentrations of PQIP + Tarceva necessary to induce similar inhibitory effects are plotted on the isobologram in comparison with single drugs. Lower right: combination index (CI) of PQIP + Tarceva at 1:9 (FET), 1:10 (CBS) and 1:2 (GEO) ratios were tested by CI analysis. CI value was analyzed by Calcusyn software and plotted against Fa. Complete CI effect plot simulated by the software derived from the real data points is shown. An additive effect was reflected by CI = 1, a synergistic effect was reflected by CI < 1, and an antagonistic effect was reflected by CI > 1.
Discussion
Previously we found that in order to obtain substantial reentry into the cell cycle from growth arrest in FET colon cancer cells, exogenous activation of IGF1R was necessary. The induction of autocrine TGFα-mediated EGFR activation in the G1 phase of the cell cycle is an essential event for DNA synthesis in these cells, and the upregulation of EGFR via the autocrine production of TGFα is an event lying downstream of the activation of the IGF1R (9, 14). TGFα was one of the first stimulatory growth factors to be described as having autocrine activity (29). The autocrine hypothesis was proposed to explain the growth advantage of malignant cells over their normal counterparts. Since the formulation of this hypothesis it has become evident that normal cells demonstrate autocrine activities as well (30). Normal cells do not exhibit independence from exogenous growth factors for cell cycle reentry nor do they exhibit constitutive cell survival signaling in quiescence. The major growth advantage resulting from autocrine TGFα mediated by IGF1R activation here may be an enhanced ability to reenter the cell cycle from growth arrest in response to IGF1R ligands and to survive to conditions which are not growth permissive.
Earlier studies in Balb/3T3 cells have suggested that IGF1R activation is critical for cell cycle reentry and that the role of EGFR signaling is to produce sufficient IGF1R (7, 31). However, FET colon carcinoma cells present a novel crosstalk paradigm in which it is the TGFα/EGFR that is required for induction of mitogenesis whereas IGF1R signaling leads to the activation of EGFR (9, 14). Another crosstalk paradigm has been shown between these two receptors in COS7 cells. This example of crosstalk is mediated by autocrine heparin-binding EGF (HB-EGF) (32). Activation of the IGF1R leads to EGFR activation via a mechanism involving matrix metalloprotease-dependent release of HB-EGF in these cells. Thus, it appears that IGF1R mediated EGFR activation can occur through the induction of a variety of EGFR ligands, and the crosstalk between IGF1R and EGFR shows great versatility in different cell lines.
Although the existence of crosstalk between IGF1R and EGFR has been described previously in the FET cell line (9, 14), the signaling pathways mediated by the IGF1R involved in this crosstalk had not been determined. Here it has been demonstrated for the first time that IGF1R mediated EGFR activation through the induction of an autocrine TGFα loop is critically dependent on the activation of the PI-3 kinase pathway. This study also elucidates the signaling function of EGFR in the crosstalk. The delayed activation of the EGFR and MAP kinase pathway by TGFα induction may provide these cells with a mechanism for sustained cell survival signaling following an initial pulse of IGF1R mediated PI3 kinase activity. This initial burst of PI3 kinase signaling provides the major survival support for the FET cells for escape from stress effects. MAP kinase also plays an important role in cell cycle re-entry.
Our previous work indicated that either EGFR or ErbB2 can compensate for the inhibition of the other receptor when exposed to a single drug treatment with small molecule antagonists (16, 19, 21). In contrast, targeting both receptors simultaneously provided synergistic effects with induction of apoptosis (16, 19). Interestingly, recent evidence also suggests a role for IGF1R signaling in the acquired resistance to drugs against EGFR or ErbB2. For example, IGF1R signaling has been reported to interfere with the growth inhibitory action of the anti-ErbB2 monoclonal antibody trastuzumab (33, 34), and a correlation between IGF1R activation and acquired resistance to EGFR blockade was also demonstrated (35, 36). In another study, co-inhibition of EGFR and IGF1R sensitized human malignant glioma cells to CD95L-induced apoptosis (37). Thus, the strategy of targeting both IGF1R and EGFR to overcome acquired drug resistance would seem to have intriguing potential for human cancer therapy.
The presence of crosstalk between two potential therapeutic targets (EGFR and IGF1R) may be of particular importance in cancer therapy. Clinically applicable drugs against EGFR have been developed and inhibitors targeting IGF1R are emerging as well (15, 27, 38-44). Single drugs directed at molecular targets have had disappointing impact in the clinic (45). The tight interplay between IGF1R and EGFR signaling suggests that strategies against both receptors may be of value (37, 46-48). A recent study found that stimulation of head and neck cancer cells with either IGF or EGF resulted in IGF1R and EGFR heterodimerization, but only IGF caused activating phosphorylation of both receptors, indicating that the net effect of IGF-induced receptor signaling may rely, in part, on EGFR activation and/or IGF1R/EGFR scaffolding interactions. They also found that combined treatment with a human anti-IGF1R antibody A12 and the EGFR blocking antibody C225 was more effective at reducing cell proliferation and migration than either agent alone (49). In light of these developments, our findings provide an example that the TGFα autocrine loop can be activated by PI-3 kinase via IGF1R signaling induction, and that MAP kinase can be activated subsequently by the activation of EGFR. Furthermore, we demonstrated that combination treatment of IGF1R and EGFR kinase inhibitors resulted in synergy of growth inhibition in three human colon cancer cell lines (Figure 5; Table 1). This implies that the heterogeneity of crosstalk between EGFR and IGF1R displays distinct mechanisms even in the same cell line in terms of regulating malignant cell growth. Intriguingly, the IC50 of Tarceva is decreased 15-fold in combination with PQIP in FET cell line. Similar dramatic changes were found in CBS and GEO cell lines as well. The significant increase of Tarceva potency in combination with an IGF1R inhibitor indicated that inhibition of IGF1R activation sensitizes EGFR inhibition by Tarceva. Hence targeting one receptor such as IGF1R, will lead to reshuffling of the downstream signaling pathways such as the PI-3 kinase pathway, and affect the other receptor and EGFR signaling, simultaneously or afterwards. Since the interactions of these signaling pathways involve both cell cycle reentry and cell survival, the phenotype of the tumor cells will eventually be changed, and, in turn, alter drug sensitivity.
Acknowledgments
This work was supported by NIH grants #CA34432, CA54807 and P30CA036727. We thank Ms. Carol Smith for technical assistance, Dr. Yunfei Zhou for assistance in CalcuSyn program.
Abbreviations
- TGFα
transforming growth factor alpha
- EGFR
epidermal growth factor receptor
- IGF
insulin-like growth factor
- IGF1R
IGF1 receptor
- PI-3 kinase
phosphatidylinositol 3 kinase
- Akt
protein kinase B
- Erk
extracellular-response kinase
- MAP
mitogen-activated protein
- MAPK
MAP kinase
- PBS
phosphate-buffered saline
References
- 1.Reinmuth N, Liu W, Fan F, et al. Blockade of insulin-like growth factor I receptor function inhibits growth and angiogenesis of colon cancer. Clin Cancer Res. 2002;8(10):3259–69. [PubMed] [Google Scholar]
- 2.Sachdev D, Yee D. The IGF system and breast cancer. Endocr Relat Cancer. 2001;8(3):197–209. doi: 10.1677/erc.0.0080197. [DOI] [PubMed] [Google Scholar]
- 3.Surmacz E. Function of the IGF-I receptor in breast cancer. J Mammary Gland Biol Neoplasia. 2000;5(1):95–105. doi: 10.1023/a:1009523501499. [DOI] [PubMed] [Google Scholar]
- 4.Ullrich A, Gray A, Tam AW, et al. Insulin-like growth factor I receptor primary structure: comparison with insulin receptor suggests structural determinants that define functional specificity. Embo J. 1986;5(10):2503–12. doi: 10.1002/j.1460-2075.1986.tb04528.x. [DOI] [PMC free article] [PubMed] [Google Scholar]
- 5.Peruzzi F, Prisco M, Dews M, et al. Multiple signaling pathways of the insulin-like growth factor 1 receptor in protection from apoptosis. Mol Cell Biol. 1999;19(10):7203–15. doi: 10.1128/mcb.19.10.7203. [DOI] [PMC free article] [PubMed] [Google Scholar]
- 6.Brodt P, Samani A, Navab R. Inhibition of the type I insulin-like growth factor receptor expression and signaling: novel strategies for antimetastatic therapy. Biochem Pharmacol. 2000;60(8):1101–7. doi: 10.1016/s0006-2952(00)00422-6. [DOI] [PubMed] [Google Scholar]
- 7.Coppola D, Ferber A, Miura M, et al. A functional insulin-like growth factor I receptor is required for the mitogenic and transforming activities of the epidermal growth factor receptor. Mol Cell Biol. 1994;14(7):4588–95. doi: 10.1128/mcb.14.7.4588. [DOI] [PMC free article] [PubMed] [Google Scholar]
- 8.Werner H, LeRoith D. The role of the insulin-like growth factor system in human cancer. Adv Cancer Res. 1996;68:183–223. doi: 10.1016/s0065-230x(08)60354-1. [DOI] [PubMed] [Google Scholar]
- 9.Wang D, Patil S, Li W, Humphrey LE, Brattain MG, Howell GM. Activation of the TGFalpha autocrine loop is downstream of IGF-I receptor activation during mitogenesis in growth factor dependent human colon carcinoma cells. Oncogene. 2002;21(18):2785–96. doi: 10.1038/sj.onc.1205375. [DOI] [PubMed] [Google Scholar]
- 10.Chantret I, Barbat A, Dussaulx E, Brattain MG, Zweibaum A. Epithelial polarity, villin expression, and enterocytic differentiation of cultured human colon carcinoma cells: a survey of twenty cell lines. Cancer Res. 1988;48(7):1936–42. [PubMed] [Google Scholar]
- 11.Schlechte W, Brattain M, Boyd D. Invasion of extracellular matrix by cultured colon cancer cells: dependence on urokinase receptor display. Cancer Commun. 1990;2(5):173–9. [PubMed] [Google Scholar]
- 12.Brattain MG, Howell G, Sun LZ, Willson JK. Growth factor balance and tumor progression. Curr Opin Oncol. 1994;6(1):77–81. doi: 10.1097/00001622-199401000-00011. [DOI] [PubMed] [Google Scholar]
- 13.Jiang D, Yang H, Willson JK, et al. Autocrine transforming growth factor alpha provides a growth advantage to malignant cells by facilitating re-entry into the cell cycle from suboptimal growth states. J Biol Chem. 1998;273(47):31471–9. doi: 10.1074/jbc.273.47.31471. [DOI] [PubMed] [Google Scholar]
- 14.Wang D, Li W, Jiang W, Humphrey LE, Howell GM, Brattain MG. Autocrine TGFalpha expression in the regulation of initiation of human colon carcinoma growth. J Cell Physiol. 1998;177(3):387–95. doi: 10.1002/(SICI)1097-4652(199812)177:3<387::AID-JCP2>3.0.CO;2-L. [DOI] [PubMed] [Google Scholar]
- 15.Garcia-Echeverria C, Pearson MA, Marti A, et al. In vivo antitumor activity of NVP-AEW541-A novel, potent, and selective inhibitor of the IGF-IR kinase. Cancer Cell. 2004;5(3):231–9. doi: 10.1016/s1535-6108(04)00051-0. [DOI] [PubMed] [Google Scholar]
- 16.Hu YP, Venkateswarlu S, Sergina N, et al. Reorganization of ErbB family and cell survival signaling after Knock-down of ErbB2 in colon cancer cells. J Biol Chem. 2005;280(29):27383–92. doi: 10.1074/jbc.M414238200. [DOI] [PubMed] [Google Scholar]
- 17.Mulder KM, Brattain MG. Effects of growth stimulatory factors on mitogenicity and c-myc expression in poorly differentiated and well differentiated human colon carcinoma cells. Mol Endocrinol. 1989;3(8):1215–22. doi: 10.1210/mend-3-8-1215. [DOI] [PubMed] [Google Scholar]
- 18.Wang J, Kuropatwinski K, Hauser J, et al. Colon carcinoma cells harboring PIK3CA mutations display resistance to growth factor deprivation induced apoptosis. Mol Cancer Ther. 2007;6(3):1143–50. doi: 10.1158/1535-7163.MCT-06-0555. [DOI] [PubMed] [Google Scholar]
- 19.Zhou Y, Brattain MG. Synergy of epidermal growth factor receptor kinase inhibitor AG1478 and ErbB2 kinase inhibitor AG879 in human colon carcinoma cells is associated with induction of apoptosis. Cancer Res. 2005;65(13):5848–56. doi: 10.1158/0008-5472.CAN-04-3509. [DOI] [PubMed] [Google Scholar]
- 20.Chou TC, Talalay P. Quantitative analysis of dose-effect relationships: the combined effects of multiple drugs or enzyme inhibitors. Adv Enzyme Regul. 1984;22:27–55. doi: 10.1016/0065-2571(84)90007-4. [DOI] [PubMed] [Google Scholar]
- 21.Zhou Y, Li S, Hu YP, et al. Blockade of EGFR and ErbB2 by the novel dual EGFR and ErbB2 tyrosine kinase inhibitor GW572016 sensitizes human colon carcinoma GEO cells to apoptosis. Cancer Res. 2006;66(1):404–11. doi: 10.1158/0008-5472.CAN-05-2506. [DOI] [PubMed] [Google Scholar]
- 22.Vlahos CJ, Matter WF, Hui KY, Brown RF. A specific inhibitor of phosphatidylinositol 3-kinase, 2-(4-morpholinyl)-8-phenyl-4H-1-benzopyran-4-one (LY294002) J Biol Chem. 1994;269(7):5241–8. [PubMed] [Google Scholar]
- 23.Alessi DR, Cuenda A, Cohen P, Dudley DT, Saltiel AR. PD 098059 is a specific inhibitor of the activation of mitogen-activated protein kinase kinase in vitro and in vivo. J Biol Chem. 1995;270(46):27489–94. doi: 10.1074/jbc.270.46.27489. [DOI] [PubMed] [Google Scholar]
- 24.Li Y, Li M, Xing G, et al. Stimulation of the mitogen-activated protein kinase cascade and tyrosine phosphorylation of the epidermal growth factor receptor by hepatopoietin. J Biol Chem. 2000;275(48):37443–7. doi: 10.1074/jbc.M004373200. [DOI] [PubMed] [Google Scholar]
- 25.Zhang P, Wang YZ, Kagan E, Bonner JC. Peroxynitrite targets the epidermal growth factor receptor, Raf-1, and MEK independently to activate MAPK. J Biol Chem. 2000;275(29):22479–86. doi: 10.1074/jbc.M910425199. [DOI] [PubMed] [Google Scholar]
- 26.Grosse R, Roelle S, Herrlich A, Hohn J, Gudermann T. Epidermal growth factor receptor tyrosine kinase mediates Ras activation by gonadotropin-releasing hormone. J Biol Chem. 2000;275(16):12251–60. doi: 10.1074/jbc.275.16.12251. [DOI] [PubMed] [Google Scholar]
- 27.Ji QS, Mulvihill MJ, Rosenfeld-Franklin M, et al. A novel, potent, and selective insulin-like growth factor-I receptor kinase inhibitor blocks insulin-like growth factor-I receptor signaling in vitro and inhibits insulin-like growth factor-I receptor dependent tumor growth in vivo. Mol Cancer Ther. 2007;6(8):2158–67. doi: 10.1158/1535-7163.MCT-07-0070. [DOI] [PubMed] [Google Scholar]
- 28.Baselga J. Targeting the epidermal growth factor receptor: a clinical reality. J Clin Oncol. 2001;19(18 Suppl):41S–4S. [PubMed] [Google Scholar]
- 29.de Larco JE, Todaro GJ. Growth factors from murine sarcoma virus-transformed cells. Proc Natl Acad Sci U S A. 1978;75(8):4001–5. doi: 10.1073/pnas.75.8.4001. [DOI] [PMC free article] [PubMed] [Google Scholar]
- 30.Sporn MB, Todaro GJ. Autocrine secretion and malignant transformation of cells. N Engl J Med. 1980;303(15):878–80. doi: 10.1056/NEJM198010093031511. [DOI] [PubMed] [Google Scholar]
- 31.Pietrzkowski Z, Lammers R, Carpenter G, et al. Constitutive expression of insulin-like growth factor 1 and insulin-like growth factor 1 receptor abrogates all requirements for exogenous growth factors. Cell Growth Differ. 1992;3(4):199–205. [PubMed] [Google Scholar]
- 32.Roudabush FL, Pierce KL, Maudsley S, Khan KD, Luttrell LM. Transactivation of the EGF receptor mediates IGF-1-stimulated shc phosphorylation and ERK1/2 activation in COS-7 cells. J Biol Chem. 2000;275(29):22583–9. doi: 10.1074/jbc.M002915200. [DOI] [PubMed] [Google Scholar]
- 33.Lu Y, Zi X, Zhao Y, Mascarenhas D, Pollak M. Insulin-like growth factor-I receptor signaling and resistance to trastuzumab (Herceptin) J Natl Cancer Inst. 2001;93(24):1852–7. doi: 10.1093/jnci/93.24.1852. [DOI] [PubMed] [Google Scholar]
- 34.Lu Y, Zi X, Pollak M. Molecular mechanisms underlying IGF-I-induced attenuation of the growth-inhibitory activity of trastuzumab (Herceptin) on SKBR3 breast cancer cells. Int J Cancer. 2004;108(3):334–41. doi: 10.1002/ijc.11445. [DOI] [PubMed] [Google Scholar]
- 35.Jones HE, Goddard L, Gee JM, et al. Insulin-like growth factor-I receptor signalling and acquired resistance to gefitinib (ZD1839; Iressa) in human breast and prostate cancer cells. Endocr Relat Cancer. 2004;11(4):793–814. doi: 10.1677/erc.1.00799. [DOI] [PubMed] [Google Scholar]
- 36.Chakravarti A, Loeffler JS, Dyson NJ. Insulin-like growth factor receptor I mediates resistance to anti-epidermal growth factor receptor therapy in primary human glioblastoma cells through continued activation of phosphoinositide 3-kinase signaling. Cancer Res. 2002;62(1):200–7. [PubMed] [Google Scholar]
- 37.Steinbach JP, Eisenmann C, Klumpp A, Weller M. Co-inhibition of epidermal growth factor receptor and type 1 insulin-like growth factor receptor synergistically sensitizes human malignant glioma cells to CD95L-induced apoptosis. Biochem Biophys Res Commun. 2004;321(3):524–30. doi: 10.1016/j.bbrc.2004.06.175. [DOI] [PubMed] [Google Scholar]
- 38.Mendelsohn J. The epidermal growth factor receptor as a target for cancer therapy. Endocr Relat Cancer. 2001;8(1):3–9. doi: 10.1677/erc.0.0080003. [DOI] [PubMed] [Google Scholar]
- 39.Sandler A. Clinical experience with the HER1/EGFR tyrosine kinase inhibitor erlotinib. Oncology (Williston Park) 2003;17(11 Suppl 12):17–22. [PubMed] [Google Scholar]
- 40.Ready N. Inhibition of the epidermal growth factor receptor in combined modality treatment for locally advanced non-small cell lung cancer. Semin Oncol. 2005;32(2 Suppl 3):S35–41. doi: 10.1053/j.seminoncol.2005.03.008. [DOI] [PubMed] [Google Scholar]
- 41.Hidalgo M. Erlotinib: preclinical investigations. Oncology (Williston Park) 2003;17(11 Suppl 12):11–6. [PubMed] [Google Scholar]
- 42.Mitsiades CS, Mitsiades NS, McMullan CJ, et al. Inhibition of the insulin-like growth factor receptor-1 tyrosine kinase activity as a therapeutic strategy for multiple myeloma, other hematologic malignancies, and solid tumors. Cancer Cell. 2004;5(3):221–30. doi: 10.1016/s1535-6108(04)00050-9. [DOI] [PubMed] [Google Scholar]
- 43.Warshamana-Greene GS, Litz J, Buchdunger E, Garcia-Echeverria C, Hofmann F, Krystal GW. The insulin-like growth factor-I receptor kinase inhibitor, NVP-ADW742, sensitizes small cell lung cancer cell lines to the effects of chemotherapy. Clin Cancer Res. 2005;11(4):1563–71. doi: 10.1158/1078-0432.CCR-04-1544. [DOI] [PubMed] [Google Scholar]
- 44.Hu YP, Dominguez I, Hauser J, Sharratt E, Spernyak J, Vinci M, Howell G, Wang J, Ji Q, Gibson N, Rajput A, Brattain MG. Characterization of In Vitro and In Vivo Antitumor Activity for Novel IGF1R Kinase Inhibitors in Colon Cancer Cells. Mol Cancer Ther. 2007;6(12):3506s–7s. [Google Scholar]
- 45.Black JD, Brattain MG, Krishnamurthi SA, Dawson DM, Willson JK. ErbB family targeting. Curr Opin Investig Drugs. 2003;4(12):1451–4. [PubMed] [Google Scholar]
- 46.Adams TE, McKern NM, Ward CW. Signalling by the type 1 insulin-like growth factor receptor: interplay with the epidermal growth factor receptor. Growth Factors. 2004;22(2):89–95. doi: 10.1080/08977190410001700998. [DOI] [PubMed] [Google Scholar]
- 47.Morgillo F, Woo JK, Kim ES, Hong WK, Lee HY. Heterodimerization of insulin-like growth factor receptor/epidermal growth factor receptor and induction of survivin expression counteract the antitumor action of erlotinib. Cancer Res. 2006;66(20):10100–11. doi: 10.1158/0008-5472.CAN-06-1684. [DOI] [PubMed] [Google Scholar]
- 48.Hu YP, Ji Q, Kan J, Wang J, Zhou Y, Hauser J, Vinci M, Gibson N, Brattain MG. Proc AACR #5073. Washington DC: Annual Meeting for American Association for Cancer Research; 2006. The combination treatment with inhibitors targeting the type I insulin-like growth factor receptor and the epidermal growth factor receptor in human colon cancer. [Google Scholar]
- 49.Barnes CJ, Ohshiro K, Rayala SK, El-Naggar AK, Kumar R. Insulin-like growth factor receptor as a therapeutic target in head and neck cancer. Clin Cancer Res. 2007;13(14):4291–9. doi: 10.1158/1078-0432.CCR-06-2040. [DOI] [PubMed] [Google Scholar]