

Abstract
The effects of frozen storage on the anthocyanin and polyphenol content of elderberry fruit juice are investigated. Juice from three genotypes of American elderberry (Adams II, Bob Gordon, and Wyldewood) was screened for total phenolic (TP) and total monomeric anthocyanin (TMA) content with spectrophotometric methods. The individual anthocyanin content (IAC) of the juice was tested by coupling solid phase extraction with ultra-performance liquid chromatography/tandem mass spectrometry. Juice samples were tested initially upon harvest, then again after 3, 6, and 9 months of frozen storage. Juice from the three different genotypes had significantly different TP, TMA, and IAC profiles initially (p<0.05). The TP,, TMA, and IAC content of the juice from different genotypes were significantly affected (p<0.05) by the frozen storage time, suggesting that both genotype and length of frozen storage time can affect the anthocyanin content of elderberry fruit juice.
Keywords: Sambucus nigra, anthocyanins, elderberry, solid phase extraction, UPLC-MS/MS, total phenolic
INTRODUCTION
Fruit consumption is a vital part of the human diet. Fruits are a rich source of vitamins, minerals, and polyphenols. Elderberry is a small, dark purple fruit rich in anthocyanins, a subclass of polyphenols that are responsible for the colored pigments of fruits. The European elderberry (Sambucus nigra subsp. nigra) has been extensively studied1 but little research has been conducted concerning the stability of anthocyanins and other polyphenols in American elderberry (Sambucus nigra subsp. canadensis). The American elderberry grows wild throughout much of eastern North America, but is being increasingly cultivated in the United States for use in the dietary supplement market.
Elderberries have a variety of potential health benefits associated with their consumption.2,3 Research supports that anthocyanins and other polyphenols found in elderberry juice can help the body protect against oxidative stress through their ability to quench free radicals4 and their immunomodulatory and anti-inflammatory properties.5 Several in vitro and in vivo animal studies have successfully demonstrated antioxidant, anti-viral6 and chemoprotective7 activity of anthocyanins; although evidence in human trials is still limited. However, anthocyanin consumption through fruit has been associated with aiding in ailments such as certain cancers8,9, heart disease,3 and neurodegenerative disease.5 The proposed mechanisms of effects of polyphenols include enzyme function and the regulation of gene and protein expression.3 Several previous studies have focused on profiling and quantifying the anthocyanin and other polyphenol content in several different fruits.10–12
The total phenolic (TP) and total monomeric anthocyanin (TMA) spectrophotometric methods are commonly utilized to estimate their respective content in fruit. Studies have suggested that the cultivar or genotype, growing season, location, and storage affect the anthocyanin content of elderberry and other fruits.10,13–15 The effects of storage on the phytochemical profile of fruit are important because of the seasonal availability of fresh fruit, thus the need to adequately preserve vital nutraceuticals. One study showed that the anthocyanin content in several blackberry (Rubus spp.) fruit cultivars was unaffected during long term freezer storage, including both fast freezing using liquid nitrogen, and traditional slow freezing in the freezer.13 Most individual anthocyanins were cyanidin based, and cyanidin-3-O-glucoside was present at the highest concentrations amongst all the cultivars. However, measurements were only taken initially and after 7 months of frozen storage, and concerned the fruit. Additional studies have been conducted concerning anthocyanin stability in other small fruits during storage.13,16–18 Elderberry juice is a rich source of cyanidin-based anthocyanins, but research regarding the effects of frozen storage on the individual anthocyanin content (IAC) of American elderberry fruit juice is lacking. This study also includes screening for TP, TMA, and IAC periodically to understand the effects frozen storage has on the anthocyanin content of elderberry fruit juice.
MATERIALS AND METHODS
Plant Material
American elderberry fruit grown at the University of Missouri’s Southwest Research Center near Mt. Vernon (37.072073 N, -93.880829 W, 378 m alt.) was used. The soil is an upland Creldon silt loam that is deep, moderately well drained, and with a fragipan at 50 – 90 cm. Soil chemistry was evaluated prior to planting, with the analysis indicating a good soil for elderberry: pH 6.8, cation exchange capacity 13.2 meq/100g, organic matter 2.6%, and high to very high levels of P, K, Ca, and Mg based on recommendations for berry crops.
Three commercially available elderberry genotypes (Adams II, Bob Gordon, and Wyldewood) were used. These three genotypes have widely disparate geographic origins, originating from wild genetic material in New York, Missouri, and Oklahoma, respectively. Phenotypically, they behave differently when cultivated side-by-side, suggesting that there are inherent genetic differences among them.19 Experimental plots contained four plants of the same genotype, planted 1.2 m apart. Forty-eight plots were established in four rows, with plots separated 2.4 m within and 3.1 m between rows. The three genotypes were assigned to 16 of the 48 plots in a completely randomized manner. The total number of plants was 192 and the site covered 0.10 ha. The site was prepared by killing existing vegetation in the planting rows with glyphosate herbicide prior to planting, and alleyways of mixed grasses were maintained and mowed during the study. Throughout the study, plants were irrigated via drip lines to provide 2.5 to 4.0 cm water per week when rainfall was lacking. Weeds were managed with mulch, hand weeding, and herbicides (glyphosate, clethodim); no insecticides or fungicides were used.
For this study, fresh ripe fruit was harvested from 39 of the 48 plots on August 26–27, 2013, promptly refrigerated, and transported under refrigeration to the laboratory on August 28 for analysis, and stored at −80 °C for one week. Elderberry samples were then thawed, de-stemmed and hand pressed into juice. All other debris, pulp, and seeds were discarded. The juice obtained was filtered through a nylon filter (0.22 μm), and 1.5 mL of each replicate was individually aliquotted into 1.5 mL micro centrifuge tubes and stored at −20 °C The samples were screened for TP, TMA, and IAC initially, and after 3, 6, and 9 months of frozen storage. Samples were thawed, an aliquot removed for analysis, and then re-frozen for future analysis. The number of independent juice samples ranged from 11 to 14 for each of the three genotypes for all assays conducted.
Chemicals
Cyanidin 3-O-glucoside chloride analytical standard (≥95%), Folin-Ciocalteu’s phenol reagent, sodium acetate trihydrate (≥99.0%), and gallic acid (97.5–102.5%) were purchased from Sigma-Aldrich (St. Louis, MO, USA). Ammonium hydroxide (Optima), sodium carbonate anhydrous (certified ACS powder), potassium chloride (certified ACS crystalline), hydrochloric acid (Optima), water (HPLC-grade), formic acid (HPLC-grade) and acetonitrile (HPLC-grade) were purchased from Fisher Scientific (Fair Lawn, NJ, USA). Trifluoroacetic acid (99%) used for acidifying solid phase extraction (SPE) mobile phase, was purchased from Acros Organics (NJ, USA).
Total Phenolic (TP)
Folin-Ciocalteu’s method was used with slight modifications.20 Juice samples were initially diluted 100-fold with water, then 0.5 mL of Folin-Cicoalteu’s phenol reagent (diluted 10-fold) was added, followed by 0.4 mL of sodium carbonate (75 g/L) after 30 s, but before eight min. Samples equilibrated at room temperature, in absence of light, for two h.. Absorbance measurements were taken in triplicate at wavelength of 760 nm with a PerkinElmer Enspire 2300 multimode plate reader. Five gallic acid standards of 25, 50, 100, 200, and 400 μg/mL were prepared in the same manner as the samples. The TP concentrations are expressed as gallic acid equivalents (mg GAE/mL).
Total Monomeric Anthocyanin (TMA)
The TMA content of elderberry juice was measured utilizing the pH-differential method.21 Elderberry juice samples were diluted 200-fold in potassium chloride (pH 1.0) and sodium acetate (pH 4.5) buffers, and equilibrated for 60 min at room temperature. Five cyanidin 3-O-glucoside standards of 2, 4, 6, 8, and 10 μg/mL were prepared in the same manner as the samples. Absorbance measurements were taken in triplicate at a wavelength of 520 nm and 700 nm in each buffer solution. Equation 1 shows how the final absorbance values were obtained. TMA concentrations were determined using a standard curve and are expressed as cyanidin 3-O-glucoside equivalents (mg C3GE/mL). The standard solution concentrations were verified using the molar extinction coefficient of cyanidin 3-O-glucoside (M.W. 449.2 g/mol, ε = 26900 M−1cm, λ = 520 nm)22.
| (1) |
Solid Phase Extraction (SPE)
Mixed mode cation-exchange chromatography was employed to isolate the anthocyanins from the other potentially interfering compounds in the juice matrix.4 Oasis MCX 3cc (60mg) extraction cartridges were used with a Supelco Visiprep SPE vacuum manifold, operated at 10 ± 2 in. Hg. Columns were initially conditioned with 2 mL of acidified water (0.01% trifluoroacetic acid, TFA). After conditioning, 50 μL of juice was added, followed by an additional 2 mL of water (0.01% TFA), and 2 mL methanol (0.01% TFA). Then 1 mL of methanol (1% NH4OH) and 1 mL 40:60 water/methanol (1% NH4OH) was added, and these two eluates were combined for analysis. 10 μL of formic acid was added to re-acidify the solution. The solvent was evaporated with a constant flow of nitrogen gas. Dry samples were re-dissolved in 1 mL of water (4.5% formic acid) and refrigerated until analysis.
Juice samples were spiked with three concentrations of cyanidin 3-O-glucoside standard before the extraction step to assess the overall recovery rate of the SPE procedure. The cyanidin 3-O-glucoside concentration of the spiked juice sample was compared to a control juice sample. The percent recovery was calculated using equation 2.
| (2) |
The average SPE recovery of cyanidin-3-O-glucoside ranged from 94–107% (Table 1). Three different volumes of cyanidin-3-O-glucoside standard spiking solution were used to analyze recovery over a range of concentrations. Acceptable recovery was seen for all volumes of concentrations added.
Table 1.
Average Recovery of Elderberry Juice Spiked with Three Different Cyanidin-3-O-Glucoside Concentrations Before SPE. Three Independent Samples were Tested for Each Spike Concentration. Concentrations were Measured Using UPLC-MS/MS and are Represented as C3GE (ng/mL). Concentrations of the Spiked Juice Sample are Compared to the Concentration of the Control Juice Sample. Recoveries are Represented as a Percentage ± the Standard Error of the Mean (n=3).
| Average Response | C3GE (ng/mL) | C3GE added (ng/mL) | Average Recovery (%) | |
|---|---|---|---|---|
| Control | 220,956 | 525.2 | - | |
| 2 μL spike | 340,669 | 808.3 | 298.4 | 94.9 ± 0.8 |
| 3 μL spike | 395,931 | 938.0 | 439.2 | 94 ± 1 |
| 5 μL spike | 539,214 | 1,277.8 | 705.5 | 107 ± 1 |
Ultra-Performance Liquid Chromatography/Tandem Quadrupole Mass Spectrometry (UPLC-MS/MS)
A previously described UPLC-MS/MS method was followed for anthocyanin quantification.23 A Waters Acquity ultra-performance liquid chromatograph, with a quaternary solvent manager was used. A C18 column (Acquity BEH, 1.7-μm, 50-mm × 2.1-mm, Waters, Milford, MA, USA) was selected to separate anthocyanins. The mobile phases used were water A (4.5% formic acid) and acetonitrile B (0.01% formic acid). The gradient used was 95% A at 0 min, 91% A at 2.5 min, 85% A at 3.5 min, 5% A at 4 min, 95% A at 4.8 min. The flow rate was 400 μL/min and the sample injection volume was 10 μL in full loop mode. The column and sample chamber were kept at ambient temperature.
A Waters Xevo TQ-S triple quadrupole mass spectrometer with electrospray ionization (ESI) in the positive ion mode was used. Multiple reaction monitoring scans were conducted by selecting the parent and daughter ion masses of the anthocyanins. A desolvation temperature of 350 °C and source temperature of 150 °C were used. A capillary voltage of 2.0 kV and cone voltage of 20 V were used, and the nebulizer gas rate was 500 L N2/h. Individual collision energies were manually optimized. MassLynx software (version 4.1, Waters, Milford, MA, USA) was used for all data acquisition. Six cyanidin 3-O-glucoside external standards of 1, 10, 100, 200, 500, and 1,000 ng/mL were prepared and used to quantitate IAC. Samples were measured in triplicate and concentrations were determined based on their ion chromatographic peak areas. Individual anthocyanin concentrations are expressed as (μg C3GE/mL). Nine individual anthocyanin compounds were monitored during the experiment. Information regarding their parent and daughter ion mass-to-charge ratios (m/z) and retention times (Rt) are listed in Table 2 and are representative of the anthocyanin compounds in the juice samples.
Table 2.
Parent and Daughter Ion Mass-to-Charge Ratios (m/z) of Each Individual Anthocyanin Monitored, Along with the Retention Time (Rt) of Each Ion Chromatographic Peak.
| Anthocyanin | Parent Ion (m/z) | Daughter Ion (m/z) | Rt (min) |
|---|---|---|---|
| cyanidin-3-O-coumaroyl-sambubioside-5-glucoside | 889.4 | 287.1 | 4.61 |
| cyanidin-3-O-sambubioside-5-glucoside | 743.2 | 287.1 | 2.47 |
| cyanidin-3-O-coumaroyl-sambubioside | 727.4 | 287.1 | 4.67 |
| cyanidin-3-O-sophoroside | 611.1 | 287.1 | 2.37 |
| cyanidin-3-O-rutinoside | 595.1 | 287.1 | 4.63 |
| cyanidin-3-O-sambubioside | 581.0 | 287.1 | 3.78 |
| cyanidin-3-O-galactoside | 449.1 | 287.1 | 2.41 |
| cyanidin-3-O-glucoside | 449.1 | 287.1 | 3.66 |
| cyanidin based anthocyanin | 785.3 | 287.1 | 4.45 |
Statistical Analysis
Data analysis was carried out in Matlab, version 8.3 (Mathworks, Natick, MA). One-way ANOVA was performed to compare the effects of frozen storage on the TP and TMA content of the elderberry juice samples. The Tukey honestly significant difference (hsd) test was conducted to compare the TP and TMA values of the same genotype at different time points during long-term frozen storage, and also to compare the TP and TMA values of the three genotypes at the same time points, both done at the 95% confidence interval. Two-way t-tests were performed at the 95% confidence interval to analyze the difference in IAC during frozen storage.
RESULTS AND DISCUSSION
Freeze-thaw Analysis
The TMA content of juice samples was tested to determine if sample degradation occurs by repeated freeze-thaw cycles. Samples were initially thawed and analyzed for TMA content, frozen overnight (−20 °C) and tested each day for four days. Each genotype included seven independent samples (n=7). The TMA content of the juice did not have a significant difference between any of the freeze-thaw cycles (p>0.05). This was true for all three genotypes over the course of all freeze-thaw cycles.
TP Content
The TP content was significantly different among all three genotypes initially (p<0.05), suggesting the genotype plays a role in TP content of elderberry fruit juice, as also shown in other reports14,15. Bob Gordon contained the highest TP content initially (8.1 ± 0.3 mg GAE/mL) followed by Wyldewood (6.7 ± 0.1 mg GAE/mL) and Adams II (5.6 ± 0.3 mg GAE/mL) (Figure 1). After three months of frozen storage the Bob Gordon had a significantly higher TP content compared with Adams II and Wyldewood, however the latter two genotypes were not significantly different. Each genotype displayed the same trend of losing a statistically significant (p<0.05) amount of polyphenols during the first 3 months of storage (Figure 1) and then remained rather stable for the course of the storage study. By the end of 9 months of frozen storage, all of the genotypes still had at least 72% of their initial polyphenol content. Some of this TP loss can be attributed to anthocyanin degradation, which is discussed further below. Therefore, the other non-anthocyanin polyphenols in elderberry fruit juice exhibited greater stability during long term frozen storage.
Figure 1.

Total Phenolic (TP) content of Adams II, Bob Gordon, and Wyldewood genotypes. The data are represented as the mean ± the standard error of the mean (n=11–14). Each column indicates the time period of testing, starting with the initial test, 3 month, 6 month, and 9 month (left to right). Significant differences (p < 0.05) between TP content of frozen storage periods are represented by different letters (A is significantly different than B, but AB is equivalent to both A and B groups, for example), according to Tukey’s honest significance test. Significant differences (p < 0.05) between TP content between each genotype during the same time periods are indicated by different lower case letters.
TMA Content
The initial TMA content of the Bob Gordon juice was also significantly different than the Adams II and Wyldewood juice (p<0.05), suggesting that the genetics of the elderberry fruit is one factor that influences the anthocyanin content of the juice (Figure 2). Once again, Bob Gordon had the highest concentration initially, (3.8 ± 0.2 mg C3GE/mL) followed by Wyldewood (2.4 ± 0.2 mg C3GE/mL) and Adams II (1.8 ± 0.2 mg C3GE/mL). However, after three and six months of frozen storage the three genotypes possessed significantly different TMA contents from each other (Figure 2). Not only did the Bob Gordon genotype have the highest TMA content, but it also had the highest anthocyanin percentage of the TP content at 47% anthocyanin, followed by 36% and 32% for Wyldewood and Adams II, respectively. In another study involving American elderberry fruit, the TMA content of 14 different elderberry fruit accessions varied highly (37.5%), which was much more than the 14.4% TP variance amongst accessions.10 This suggests that the anthocyanin content is more susceptible to changes than other polyphenols based on the genotype, growing conditions, location, year, and other factors, which is in good agreement with our results. Future studies investigating these parameters would be helpful to understand how to optimize and the preservation of anthocyanins in elderberry fruit.
Figure 2.

Total Monomeric anthocyanin (TMA) content of Adams II, Bob Gordon, and Wyldewood genotypes. The data are represented as the mean ± the standard error of the mean (n=11–14). Each column indicates the time period of testing, starting with the initial test, 3 month, 6 month, and 9 month (left to right). Significant differences (p < 0.05) between TMA content of frozen storage periods are represented by different letters (A is significantly different than B, but AB is equivalent to both A and B groups, for example), according to Tukey’s honest significance test. Significant differences (p < 0.05) between TMA content between each genotype during the same time periods are indicated by different lower case letters.
There were large differences in the stability of the anthocyanins during frozen storage among genotypes. Bob Gordon showed the best TMA stability during the first three months of frozen storage (Figure 2), while the other two genotypes saw a significant decline in TMA content during this time. All three genotypes saw a significant and relatively similar decline in TMA content from three months to six months, and also from six months to nine months of frozen storage. The Bob Gordon retained 99%, 76%, and 58% of its initial anthocyanins during 3, 6, and 9 months of storage, respectively. Wyldewood retained 72%, 44%, and 28% and Adams II 42%, 30%, and 18% of their initial anthocyanins during 3, 6, and 9 months of storage, respectively. These large differences during frozen storage suggest that the genetics of the fruit also influence the stability of anthocyanins in the juice matrix, with an increase in storage time adversely affecting the TMA content of the juice.
Thomas et al., tested elderberry fruit for TMA and included the same three genotypes in this study.14 The TMA content of their samples are in good agreement with the values obtained from this study, showing that Bob Gordon was more concentrated in anthocyanins than Wyldewood and Adams II, strengthening the hypothesis that the genotype of elderberry is a primary factor influencing the anthocyanin composition of the berry.
There are a variety of processes that could cause a decrease in the TMA content of the juice during frozen storage. For instance, enzymatic degradation could have contributed to anthocyanin loss, especially since the juice samples were not heated during processing. During the study, the same samples were thawed and re-frozen every three months for analysis. Reactivation of enzymes upon repeated thawing could possibly cause anthocyanin degradation or polymerization. Non-enzymatic polymerization is also possible due to condensation reactions between anthocyanins and proanthocyanidins. To explore the role of sample degradation due to repeated freeze/thaw cycles, juice samples were tested for their integrity over multiple cycles to ensure any anthocyanin loss was due to long term frozen storage and not another cause. During this test, there were no significant differences (p>0.05) in TMA content of any of the genotypes of juice during the initial testing and after four days of daily freeze-thaw cycles, strengthening the theory that long term frozen storage contributes to anthocyanin loss in elderberry juice.
Individual Anthocyanin Content (IAC)
Three main individual anthocyanin compounds, among all three genotypes, were identified using SPE coupled with UPLC-MS/MS: cyanidin-3-O-coumaroyl-sambubioside-5-glucoside, cyanidin-3-O-sambubioside-5-glucoside, and cyanidin-3-O-sophoroside (Table 3). Six other cyanidin-based anthocyanins were also present in the juice samples in smaller quantities, including: cyanidin-3-O-coumaroyl-sambubioside, cyanidin-3-O-rutinoside, cyanidin-3-O-sambubioside, cyanidin-3-O-galactoside, cyanidin-3-O-glucoside, and a cyanidin based anthocyanin with a tentative identification (Table 3). These nine anthocyanins were the ones present in highest concentration after SPE and represent a cross section of the anthocyanins present in elderberry juice. An example of one MRM ion channel chromatogram of cyanidin-3-O-coumaroyl-sambubioside-5-glucoside of a Wyldewood juice sample is presented in Figure 3. The integrated ion signal listed under the retention time indicated in the figure is used to quantitate IAC. Four chromatograms, one for each test period, are presented and a decrease in ion signal over time was seen. A continual decrease in concentration of this particular individual anthocyanin occurs as a function of increased frozen storage time, since the area under the chromatographic peak decreases over time.
Table 3.
Individual Anthocyanin Content (IAC) of Adams II, Bob Gordon, and Wyldewood Genotypes During Different Durations of Frozen Storage. Data are Represented as Mean ± Standard Rrror of the Mean as μg C3GE/mL (n=11–14). Significant Differences Between the IAC of Samples During Frozen Storage Compared to the Initial IAC are Represented with Asterisks (p<0.05= *, p<0.01= **) According to Two-sample Mean t-test.
|
|
|||||||||
|---|---|---|---|---|---|---|---|---|---|
| Coum-samb-5-glca | Samb-5-glcb | Coum-sambc | Sophord | Rutine | Sambf | Galactg | Glch | Based-2i | |
|
|
|||||||||
| Adams II | |||||||||
| Initial | 28 ± 1 | 18.47 ± 0.07 | 4.4 ± 0.4 | 15.9 ± 0.2 | 0.97 ± 0.02 | 3.9 ± 0.3 | 2.46 ± 0.01 | 2.1 ± 0.1 | 2.05 ± 0.05 |
| 3 Month | 8.8 ± 0.2** | 5.5 ± 0.5** | 0.95 ± 0.03** | 3.6 ± 0.2** | 1.03 ± 0.01 | ndj | 0.86 ± 0.01** | 0.97 ± 0.03** | 1.01 ± 0.01** |
| 6 Month | 1.39 ± 0.06** | 0.9 ± 0.1** | 0.66 ± 0.01** | 0.83 ± 0.07** | nd | nd | nd | nd | nd |
| 9 Month | nd | nd | nd | nd | nd | nd | nd | nd | nd |
| Bob Gordon | |||||||||
| Initial | 56 ± 3 | 41 ± 4 | 7.8 ± 0.4 | 69 ± 7 | 1.28 ± 0.04 | 8.1 ± 0.7 | 6.7 ± 0.6 | 4.7 ± 0.3 | 3.8 ± 0.3 |
| 3 Month | 47 ± 4* | 32 ± 3* | 1.04 ± 0.05** | 38 ± 5** | nd | 3.2 ± 0.3** | 2.8 ± 0.3* | 1.8 ± 0.2* | 3.1 ± 0.3 |
| 6 Month | 12.2 ± 0.9** | 7.4 ± 0.9** | 1.2 ± 0.3** | 18 ± 3** | nd | nd | 3.0 ± 0.5* | 1.6 ± 0.1* | 0.85 ± 0.07* |
| 9 Month | 0.49 ± 0.03** | nd | 1.04 ± 0.06** | 0.28 ± 0.04** | nd | nd | nd | 1.5 ± 0.2* | nd |
| Wyldewood | |||||||||
| Initial | 32 ± 3 | 22 ±2 | 4.0 ± 0.3 | 16 ± 1 | 1.01 ± 0.04 | 2.6 ± 0.2 | 2.6 ± 0.1 | 1.54 ± 0.06 | 2.2 ± 0.2 |
| 3 Month | 24 ± 2* | 15 ± 1* | 1.5 ± 0.1* | 8.5 ± 0.9* | nd | 1.22 ± 0.08* | 1.29 ± 0.05* | 1.26 ± 0.06* | 1.7 ± 0.1 |
| 6 Month | 4.7 ± 0.3** | 2.64 ± 0.09** | 1.4 ± 0.1* | nd | nd | nd | nd | nd | nd |
| 9 Month | 0.21 ± 0.01** | nd | 0.45 ± 0.02** | nd | nd | nd | nd | nd | nd |
Coum-samb-5-glc = cyanidin-3-O-coumaroyl-sambubioside-5-glucoside;
Samb-5-glc = cyanidin-3-O-sambubioside-5-glucoside;
Coum-samb = cyanidin-3-O-coumaroyl-sambubioside;
Sophor = cyanidin-3-O-sophoroside;
Rutin= cyanidin-3-O-rutinoside;
Samb = cyanidin-3-O-sambubioside;
Galact = cyanidin-3-O-galactoside;
Glc = cyanidin-3-O-glucoside;
Based-2 = cyanidin based anthocyanin;
nd= not detected. Limit of detection (0.3 ng/mL).
Figure 3.
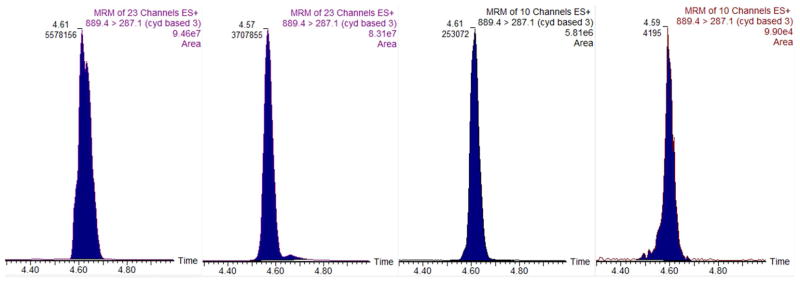
Ion chromatograms for cyanidin-3-O-coumaroyl-sambubioside-5-glucoside anthocyanin initially and after 3, 6, and 9 months of frozen storage (left to right). The retention time (min) and integrated area used for quantitation are listed at the top of the peak.
Lee and Finn showed that individual anthocyanin profile varies dramatically between Sambucus nigra subsp. canadensis and subsp. nigra.24 Cyanidin 3-coumaroyl-sambubioside-5-glucoside and cyanidin-3-sambubioside-5-glucoside were identified as the major individual anthocyanin components in subsp. canadensis in their study, and are also two of the three main individual anthocyanins found in the three subsp. canadensis genotypes in the present study. Most of the prior work analyzing the anthocyanin content of elderberry involves subsp. nigra,1 and identifies cyanidin-3-O-glucoside as a major individual anthocyanin. Cyanidin-3-O-glucoside is present in subsp. canadensis, but in much smaller quantities (Table 3), which agrees well with Lee and Finn, who tested both subspecies for IAC.23 Although the magnitudes of IAC were different initially among the three genotypes, the relative composition, or contribution of each individual anthocyanin to the total IAC were extremely similar, especially between Adams II and Wyldewood. Bob Gordon also had a similar relative composition, except the cyanidin-3-O-sophoroside content was almost two-fold higher than the other two genotypes. This could have relevance in future biochemical studies. Kamonpatana et al., showed that the structure of the anthocyanin affects the stability of the molecule in the human oral cavity, and some anthocyanins are more readily available for uptake by the buccal cells, while others degrade quickly in the mouth.25 Between their different stabilities in vivo and during storage, anthocyanins do not interact equally. This information regarding higher levels of certain anthocyanins in different genotypes underscores the importance of developing new cultivars of fruit with different anthocyanin profiles.
Bob Gordon (198 μg C3GE/mL) had the highest IAC, followed by Wyldewood (84 μg C3GE/mL) and Adams II (78 μg C3GE/mL), respectively (Table 3). A large decline in IAC in the Adams II genotype is seen after 3 months of frozen storage, and although there is a statistical difference between the Bob Gordon and Wyldewood IAC after 3 months of frozen storage, the anthocyanins are much more stable in these two genotypes during long term frozen storage (Table 3). This trend is seen in both the cyanidin-3-O-coumaroyl-sambubioside-5-glucoside and cyanidin-3-O-sambubioside-5-glucoside anthocyanins. It is also interesting to note that cyanidin-3-O-sophoroside content varies highly between the genotypes initially (Table 3).
The individual anthocyanins in elderberry juice are less stable during frozen storage compared to the monomeric anthocyanins. Bob Gordon retained 65%, 22%, and 2% of its total IAC during 3, 6, and 9 month of frozen storage, respectively (Table 3). Wyldewood and Adams II retained 65%, 10%, <1%, and 29%, 10%, and 0% of its IAC during 3, 6, and 9 months of frozen storage, respectively. These results suggest that prolonged frozen storage has a significant impact on the anthocyanin content of elderberry fruit juice. The different sugar-containing moieties may play a role in the stability of the anthocyanins during storage. It is difficult to identify a trend in the individual anthocyanins with a very small contribution since a majority fall below the detection limit after 3 months of frozen storage. Cyanidin-3-O-coumaroyl-sambubioside was the least stable during storage amongst all three genotypes, retaining less than 38% IAC in all three genotypes after 3 months of frozen storage. Cyanidin-3-O-coumaroyl-sambubioside-5-glucoside and cyanidin-3-O-sambubioside-5-glucoside showed much better stability in the Bob Gordon with 84% and 78% anthocyanin retention, respectively, and Wyldewood with 75% and 69% anthocyanin retention, respectively.
Individual anthocyanins also displayed different stabilities between genotypes. Cyanidin-3-O-sophorisde had very poor stability (23% retention) in Adams II, but >53% retention in both Bob Gordon and Wyldewood after 3 months of frozen storage. Cyanidin-3-O-sambubioside-5-glucoside displayed a very similar trend. Adams II once again had very poor stability (30%), while Bob Gordon (78%) and Wyldewood (68%) showed much higher anthocyanin stability after 3 months of frozen storage. Cyanidin-3-O-coumaroyl-sambubioside-5-glucoside had the best stability in all three genotypes during the first three months of frozen storage. Bob Gordon saw 84% anthocyanin retention, and Wyldewood and Adams II had 75% and 31% retention, respectively. Cyanidin-3-O-coumaroyl-sambubioside had the worst stability of the individual anthocyanins tested, with all genotypes having <38% of their IAC after 3 months of frozen storage. Further exploration of the juice matrix of different genotypes of elderberry fruit juice could provide insight into which compounds may contribute to increased anthocyanin stability and degradation.
We have shown that individual anthocyanin concentrations in elderberry fruit juice can vary during frozen storage and the UPLC-MS/MS method used here yields important information that is not obtained by commonly used TP and TMA testing methods. By conducting extensive sample clean up, potentially interfering juice matrix compounds were removed, allowing for more accurate anthocyanin quantification. More information was gathered regarding the stability of individual anthocyanins in three genotypes of elderberry juice. The TP, TMA, and IAC content of elderberry juice varied with genotype.
Acknowledgments
This project was made possible by Grant Number P50AT006273 from the National Center for Complementary and Alternative Medicines (NCCAM), the Office of Dietary Supplements (ODS), and the National Cancer Institute (NCI).
Abbreviations used
- alt
altitude
- BEH
ethylene bridged hybrid
- C18
octadecyl carbon chain
- ESI
electrospray ionization
- ha
hectare
- hsd
honestly significant difference
- HPLC
high-performance liquid chromatography
- IAC
individual anthocyanin content
- MCX
mixed-mode cation-exchange
- meq
milliequivalent
- SPE
solid phase extraction
- TFA
trifluoroacetic acid
- TMA
total monomeric anthocyanin
- TP
total phenolic
- UPLC-MS/MS
ultra-performance liquid chromatography/tandem mass spectrometry
Footnotes
Its contents are solely the responsibility of the authors and do not necessarily represent the official views of the NCCAM, ODS, NCI, or the National Institutes of Health.
References
- 1.Ulbricht C, Basch E, Cheung L, Goldberg H, Hammerness P, Isaac R, Khalsa KP, Romm A, Rychlik I, Varghese M, Weissner W, Windsor RC, Wortley J. An evidence-based systematic review of elderberry and elderflower (Sambucus nigra) by the natural standard research collaboration. J Diet Suppl. 2014;11:80–120. doi: 10.3109/19390211.2013.859852. [DOI] [PubMed] [Google Scholar]
- 2.Del Rio D, Borges G, Crozier A. Berry flavonoids and phenolics: bioavailability and evidence of protective effects. Br J Nutr. 2010;104:S67–S90. doi: 10.1017/S0007114510003958. [DOI] [PubMed] [Google Scholar]
- 3.González-Gallego J, García-Mediavilla MV, Sánchez-Campos S, Tuñón MJ. Fruit polyphenols, immunity and inflammation. Br J Nutr. 2010;104:S15–S27. doi: 10.1017/S0007114510003910. [DOI] [PubMed] [Google Scholar]
- 4.He J, Giusti MM. High-purity isolation of anthocyanins mixtures from fruits and vegetables – a novel solid-phase extraction method using mixed mode cation-exchange chromatography. J Chromatogr, A. 2011;1218:7914–7922. doi: 10.1016/j.chroma.2011.09.005. [DOI] [PubMed] [Google Scholar]
- 5.Tuñón MJ, García-Mediavilla MV, Sánchez-Campos S, González-Gallego J. Potential of flavonoids as anti-inflammatory agents: modulation of pro-inflammatory gene expression and signal transduction pathways. Curr Drug Metab. 2009;10:256–271. doi: 10.2174/138920009787846369. [DOI] [PubMed] [Google Scholar]
- 6.Kinoshita E, Hayashi K, Katayama H, Hayashi T, Obata A. Anti-influenza virus effects of elderberry juice and its fractions. Biosci Biotechnol Biochem. 2012;76:1633–1638. doi: 10.1271/bbb.120112. [DOI] [PubMed] [Google Scholar]
- 7.Yao LH, Jiang YM, Shi J, Tomás-Barberán FA, Datta N, Singanusong R, Chen SS. Flavonoids in food and their health benefits. Plant Foods Hum Nutr. 2004;59:113–122. doi: 10.1007/s11130-004-0049-7. [DOI] [PubMed] [Google Scholar]
- 8.Knekt P, Järvinen R, Seppänen R, Heliövaara M, Teppo L, Pukkala E, Aromaa A. Dietary flavonoids and the risk of lung cancer and other malignant neoplasms. Am J Epidemiol. 1997;146:223–230. doi: 10.1093/oxfordjournals.aje.a009257. [DOI] [PubMed] [Google Scholar]
- 9.Bosetti C, Rossi M, McLaughlin JK, Negri E, Talamini R, Lagiou P, Montella M, Ramazotti V, Franceshi S, LaVecchia C. Flavonoids and the risk of renal cell carcinoma. Cancer Epidemiol Biomarkers Prev. 2007;16:98–101. doi: 10.1158/1055-9965.EPI-06-0769. [DOI] [PubMed] [Google Scholar]
- 10.Ozgen M, Scheerens JC, Reese RN, Miller RA. Total phenolic, anthocyanin contents and antioxidant capacity of selected elderberry (Sambucus canadensis L.) accessions. Pharmacogn Mag. 2010;6:198–203. doi: 10.4103/0973-1296.66936. [DOI] [PMC free article] [PubMed] [Google Scholar]
- 11.Plaza M, Kariuki J, Turner C. Quantification of individual phenolic compounds’ contribution to antioxidant capacity in apple: a novel analytical tool based on liquid chromatography with diode array, electrochemical, and charged aerosol detection. J Agric Food Chem. 2014;62:409–418. doi: 10.1021/jf404263k. [DOI] [PubMed] [Google Scholar]
- 12.Tian Q, Giusti MM, Stoner GD, Schwartz SJ. Screening for anthocyanins using high-performance liquid chromatography coupled to electrospray ionization tandem mass spectrometry with precursor-ion analysis, product-ion analysis, common-neutral-loss analysis, and selected reaction monitoring. J Chromatogr, A. 2005;1091:72–82. doi: 10.1016/j.chroma.2005.07.036. [DOI] [PubMed] [Google Scholar]
- 13.Veberic R, Stampar F, Schmitzer V, Cunja V, Zupan A, Koron D, Mikulic-Petkovsek M. Changes in the contents of anthocyanins and other compounds in blackberry fruits due to freezing and long-term frozen storage. J Agric Food Chem. 2014;62:6926–6935. doi: 10.1021/jf405143w. [DOI] [PubMed] [Google Scholar]
- 14.Thomas AL, Veazie PP, Beyers PL, Finn CE, Lee J. A comparison of fruit characteristics among diverse elderberry genotypes grown in Missouri and Oregon. J Berry Res. 2013;3:159–168. doi: 10.3233/JBR-130054. [DOI] [PMC free article] [PubMed] [Google Scholar]
- 15.Thomas AL, Byers PL, Gu S, Avery JD, Jr, Kaps M, Datta A, Fernando L, Grossi P, Rottinghaus GE. Occurrence of polyphenols, organic acids, and sugars among diverse elderberry genotypes grown in three Missouri (USA) locations. Acta Hort. 2015;1061:147–154. doi: 10.17660/ActaHortic.2015.1061.14. in press. [DOI] [PMC free article] [PubMed] [Google Scholar]
- 16.Wilkes K, Howard LR, Brownmiller C, Prior RL. Changes in chokeberry (Aronia melanocarpa L.) polyphenols during juice processing and storage. J Agric Food Chem. 2014;62:4018–4025. doi: 10.1021/jf404281n. [DOI] [PubMed] [Google Scholar]
- 17.Hager A, Howard LR, Prior RL, Brownmiller C. Processing and storage effects on monomeric anthocyanins, percent polymeric color, and antioxidant capacity of processed black raspberry products. J Food Sci. 2008;73:H134–H140. doi: 10.1111/j.1750-3841.2008.00855.x. [DOI] [PubMed] [Google Scholar]
- 18.Brownmiller C, Howard LR, Prior RL. Processing and storage effects on procyanidin composition and concentration of processed blueberry products. J Agric Food Chem. 2009;57:1896–1902. doi: 10.1021/jf803015s. [DOI] [PubMed] [Google Scholar]
- 19.Finn CE, Thomas AL, Byers PL, Serce S. Evaluation of American (Sambucus canadensis) and European (S. nigra) Elderberry Genotypes Grown in Diverse Environments and Implications for Cultivar Development. Hort Sci. 2008;43:1385–1391. [Google Scholar]
- 20.Singelton VL, Rossi JJA. Colorimetry of total phenolics with phosphomolybdic-phosphotungstic acid reagents. Am J Enol Vitic. 1965;16:144–158. [Google Scholar]
- 21.Giusti M, Wrolstad RE. Curr Protoc Food Analyt Chem. John Wiley & Sons, Inc; Hoboken, NJ: 2001. Characterization and measurement of anthocyanins by UV-Visible spectroscopy; pp. F1.2.1–F1.2.6. [Google Scholar]
- 22.Jurd L, Asen S. The formation of metal and “co-pigment” complexes of cyanidin 3-glucoside. Phytochemistry. 1966;5:1263–1271. [Google Scholar]
- 23.Wu H, Johnson MC, Lu P, Fritsche KL, Thomas AL, Cai Z, Greenlief CM. Determination of anthocyanins and total polyphenols in a variety of elderberry juices by UPLC/MS and other methods. Acta Hort. 2015;1061:43–51. doi: 10.17660/ActaHortic.2015.1061.3. [DOI] [PMC free article] [PubMed] [Google Scholar]
- 24.Lee J, Finn CE. Anthocyanins and other polyphenolics in American elderberry (Sambucus canadensis) and European elderberry (S. nigra) cultivars. J Agric Food Chem. 2007;87:2665–2675. doi: 10.1002/jsfa.3029. [DOI] [PubMed] [Google Scholar]
- 25.Kamonpatana K, Failla ML, Kumar PS, Giusti MM. Anthocyanin structure determines susceptibility to microbial degradation and bioavailability to the buccal mucosa. J Agric Food Chem. 2014;62:6903–6910. doi: 10.1021/jf405180k. [DOI] [PubMed] [Google Scholar]