

SUMMARY:
At ultra-high magnetic fields, such as 7T, MR imaging can noninvasively visualize the brain in unprecedented detail and through enhanced contrast mechanisms. The increased SNR and enhanced contrast available at 7T enable higher resolution anatomic and vascular imaging. Greater spectral separation improves detection and characterization of metabolites in spectroscopic imaging. Enhanced blood oxygen level–dependent contrast affords higher resolution functional MR imaging. Ultra-high-field MR imaging also facilitates imaging of nonproton nuclei such as sodium and phosphorus. These improved imaging methods may be applied to detect subtle anatomic, functional, and metabolic abnormalities associated with a wide range of neurologic disorders, including epilepsy, brain tumors, multiple sclerosis, Alzheimer disease, and psychiatric conditions. At 7T, however, physical and hardware limitations cause conventional MR imaging pulse sequences to generate artifacts, requiring specialized pulse sequences and new hardware solutions to maximize the high-field gain in signal and contrast. Practical considerations for ultra-high-field MR imaging include cost, siting, and patient experience.
From the initial grainy images of the human brain obtained in the late 1970s,1 MR imaging has progressed to provide exquisite images of brain anatomy and function and metabolic composition, making MR imaging integral to nearly all current neurologic evaluations.2 Two major determinants of MR image quality, SNR and contrast, both increase with field strength (Table).3,4 Therefore, MR imaging scanners operating at field strengths of 7T (and up to 11.7T) have the potential to improve lesion detection, enhance lesion characterization, improve treatment planning, and help elucidate the mechanisms underlying disease. This review addresses the advantages and limitations of ultra-high-field MR imaging and MR spectroscopy and discusses some of the major clinical applications to the brain. Physical and technical challenges of high-field MR imaging and some current solutions to these challenges are outlined, as are practical aspects of placing an ultra-high-field scanner in an imaging facility.
Relationship of imaging parameters and main magnetic field strength
| Imaging Property | Relationship with Main Magnetic Field Strength | Observed Trend in Practice |
|---|---|---|
| SNR | SNR α B0 | SNR increases linearly with B0; however, a linear increase may not be achievable in the presence of inhomogeneity and changing tissue relaxation4,5 |
| Resolution | Resolution α n0.33 When B0 is increased by a factor of n |
In practice, further increases in resolution may be achieved because of improvements in detector and gradient design and enhanced contrast-to-noise ratio for some types of imaging sequences acting in conjunction with increased field strength |
| T1 (in sec) | T1 = 1/(0.35 + 0.64 × B0−0.7) | This is a heuristic approximation (in SI units) for cortical gray matter4; generally T1 values for different tissues lengthen and converge with field strength |
| T2* (in sec) | T2* = 1/(7 + 3.5 × B0) | This is a heuristic approximation (in SI units) for cortical gray matter4,97,98 |
| Apparent T2 | Decrease with B0 | Theoretically, field strength has little effect on the spin-spin relaxation governing intrinsic T299; however, due to effects such as spins diffusing through susceptibility microgradients, apparent T2 shortens for some spin-echo sequences98,100,101 |
| Sensitivity to susceptibility | Δϕ α B0 × TE | In practice, higher B0 enables the use of shorter TEs to maintain the same phase effect; coupled with higher SNR, this results in improved resolution and speed |
| Spectral resolution in MRSI | ΔF α B0 | Although the separation of spectral peaks increases with field strength, increased B0 inhomogeneity within a voxel will cause broadening of peaks, counteracting this benefit; better shimming and smaller voxel volumes are required to prevent peak broadening |
| CSL error | CSL α B0 × section thickness/(RF bandwidth) | In MRSI, this results in substantial shifts in selected volumes for metabolites resonating at different frequencies; high bandwidth RF pulses, such as adiabatic pulses can mitigate CSL error |
Note:—Δϕ indicates the phase difference between 2 tissues; ΔF, frequency separation between metabolite peaks; CSL, chemical shift localization; SI, International System of Units.
Improved Visualization of the Brain at 7T
Structural Imaging.
Because SNR scales with field strength (Table),4,5 7T MR imaging provides higher resolution images within reasonable scanning times, compared with lower field studies.6–13 At 7T, therefore, MR imaging displays finer anatomic detail, increases lesion conspicuity, and more accurately characterizes brain abnormalities. Figure 1, for example, illustrates 7T axial and coronal-oblique turbo spin-echo images of the hippocampus obtained from healthy volunteers at 450-μm in-plane resolution and 2-mm section thickness.
Fig 1.

High-resolution axial (A) and coronal oblique (B) images of the brain obtained at 7T. The 450-μm in-plane resolution enables visualization of the hippocampus in fine detail. C, Effective hippocampal subfield segmentation may be performed on a 7T TSE image. Subfields were manually traced courtesy of Dr Jason Bini on high-resolution coronal TSE images on OsiriX Image Viewing Software (http://www.osirix-viewer.com) by using the segmentation work by Van Leemput et al102 as a guide. Scanner: whole-body 7T MR imaging (Magnetom; Siemens). RF coil: Nova 32-channel head coil (Nova Medical, Wilmington, Massachusetts). Scan parameters: number of sections = 25, section thickness = 2 mm, FOV = 23 cm, grid size = 512 × 512, resolution = 0.44 × 0.44 × 2 mm3, scanning time = 6 minutes and 30 seconds.
Vascular and Functional Imaging.
Increasing the field strength provides opportunities for novel MR imaging contrast mechanisms, including improved susceptibility, blood oxygen level–dependent (BOLD) and flow-dependent contrast. MR imaging sensitivity to susceptibility effects scales with field strength (Table), making it possible to more effectively depict venous microvasculature, microbleeds, and iron and calcium deposits through susceptibility-weighted imaging.14 Figure 2 illustrates a MIP of an SWI obtained at 7T.
Fig 2.

MIP of a 7T susceptibility-weighted image of the brain of a healthy volunteer revealing tiny venules in the cortex. Scanner: whole-body 7T MR imaging (Magnetom; Siemens). RF coil: Nova 32-channel head coil. Scan parameters: resolution = 0.2 × 0.2 × 1.5 mm3, MIP thickness = 12 mm over the set of sections, scanning time = 6 minutes and 2 seconds.
The increased T2*dephasing due to deoxygenated blood should enhance BOLD contrast, permitting higher resolution functional MR imaging.15 Furthermore, the component of the BOLD signal that arises from smaller blood vessels also scales with field strength, so the BOLD signal has better spatial correlation to oxygen extraction and is more tightly coupled to the underlying neuronal activity.16,17
The T1 values of tissue increase with field strength (Table). At 7T, the higher SNR and longer T1 values for tissue enhance suppression of static background signal in TOF angiography, increasing overall contrast and the detectability of smaller arteries.18 Figure 3 shows a TOF image obtained at 7T depicting the multiple arterial branches arising from the anterior and middle cerebral trunks.
Fig 3.

Time-of-flight angiography performed on a healthy volunteer at 7T. Axial and sagittal MIP of TOF images are shown. Scanner: whole-body 7T MR imaging (Magnetom; Siemens). RF coil: Nova 32-channel head coil. Scan parameters: resolution = 0.26 × 0.26 × 0.4 mm3, scan time = 7 minutes and 56 seconds.
MR Spectroscopic Imaging.
The chemical shift differences among metabolite resonances are directly proportional to field strength (Table). The combination of increased SNR and increased spectral separation of metabolite peaks results in higher resolution spectroscopic images and improved spectral quantification.5 Figure 4 shows a spectrum obtained at 7T with a constant time point-resolved spectroscopic (CT-PRESS) pulse sequence described by Mayer and Spielman.19 Greater numbers of metabolites become detectable as SNR and peak separation increase.
Fig 4.

In vivo brain spectra acquired on a healthy volunteer by using a CT-PRESS sequence at 7T. Spectrum is courtesy of Drs Dirk Mayer and Daniel Spielman, Stanford University, Stanford, California. Plotted below the in vivo data are simulated spectra of individual metabolites, as generated by the CT-PRESS acquisitions.103 Metabolites shown are: phosphocreatine (PCr), creatine (Cr), myo-inositol (mI), scyllo-inositol (sI), N-acetylaspartate (NAA), N-acetyl aspartylglutamate (NAAG), alanine (Ala), aspartate (Asp), glutamate (Glu), glutamine (Gln), Choline (Cho), gamma-aminobutyric acid (GABA), glutathione (GSH), phosphoethanolamine (PE), glucose (Glc), taurine (Tau). Scanner: 7T whole-body scanner (MR950; GE Healthcare, Milwaukee, Wisconsin). RF coil: Nova head coil. Scan parameters: resolution = 2 × 2 × 2 cm3; voxel centrally located in the supertentorial brain, scanning time = 5 minutes.
DTI.
The increased SNR at 7T, coupled with improved receiver coils, has been shown to increase the certainty and accuracy of determining DTI-based parameters such as fractional anisotropy, compared with 3T and 1.5T.20 Figure 5 illustrates streamlines generated from diffusion-weighted data obtained on a 7T whole-body MR imaging scanner (Magnetom; Siemens, Erlangen, Germany) by using an optimized Stejskal-Tanner sequence.21 A readout-segmented EPI method proposed by Heidemann et al22 was used to overcome issues such as magnetic field (B0) inhomogeneity. Unfortunately, for such an acquisition, total scanning time is impractically long (75 minutes), so new approaches, such as multiband excitations, are being explored to obtain these types of results within reasonable scanning times.23,24
Fig 5.

Tractography performed by using diffusion imaging at 7T with readout-segmented EPI and parallel imaging. Image courtesy of Dr Robin Heidemann, Max Planck Institute for Human Cognitive and Brain Sciences, Leipzig, Germany. Scanner: whole-body 7T MR imaging (Magnetom; Siemens). RF coil: Nova 24-channel head coil. Scan parameters: b-value of 1000 s/mm2, resolution = 1 × 1 × 1 mm3, 30 diffusion directions, generalized autocalibrating partially parallel acquisition acceleration factor = 3, TE/TR = 60/11,000 ms, scanning time = 75 minutes.
Multinuclear Imaging.
Greater SNR provides a signal boost to nuclei other than protons, such as sodium-23 (23Na) and phosphorus-31 (31P), which provide a means of probing important cell processes, different metabolic pathways, and new relaxation mechanisms.25–34 Figure 6 illustrates a high-resolution 23Na image obtained at 7T using a 3D attenuation-adapted projection reconstruction method described in Nagel et al.26 The signal from sodium 23NA is 30,000 times lower than the signal from protons, due to the smaller gyromagnetic ratio of sodium, lower concentration in biologic tissue, and rapid biexponential decay.35 Nevertheless, the increased SNR available at 7T enables imaging at a resolution that depicts main anatomic features in the brain, even in the SNR-starved regime of the sodium nucleus. More recently, chlorine-35 (35Cl), a nucleus that exhibits even lower MR imaging sensitivity than 23Na, has been imaged within clinically feasible scanning times.27 Early work indicates that 35Cl imaging may reveal pathophysiologic changes associated with loss of chloride homeostasis.27
Fig 6.

Sodium brain image of a healthy volunteer obtained at 7T using a 3D attenuation-adapted projection reconstruction. Images courtesy of Dr Armin Nagel, the German Cancer Research Center, Heidelberg, Germany. Scanner: whole-body 7T MR imaging (Magnetom; Siemens). RF coil: double-resonant (1H = 297.2 MHz; 23Na = 78.6 MHz) quadrature birdcage coil (Rapid Biomed, Rimpar, Germany). Scan parameters: resolution = 2 × 2 × 2 mm3, scanning time = 20 minutes.
Clinical Applications of 7T in Neuroradiology
High-resolution 7T imaging may now be used to improve the detection and characterization of abnormalities associated with a wide range of neurologic disorders, including epilepsy, brain tumors, multiple sclerosis, Alzheimer disease/dementia, and neuropsychiatric disorders.9,10,12,36–42
Epilepsy.
The improved resolution and novel contrast mechanisms available at 7T show structural and biochemical abnormalities in greater detail to delineate seizure foci, aid in surgical planning, and improve patient outcome. 7T detection of abnormalities not visible at 3T may obviate invasive evaluation through depth electrodes or provide the data needed to establish concordance with invasive evaluations. 7T MR imaging has already shown value for characterizing hippocampal sclerosis,38,42 cortical dysplasias,43 and vascular malformations44 associated with epilepsy. Figure 7A compares 3T and 7T FSE images in a patient with epilepsy with subtle left hippocampal abnormalities. Figure 7B shows the benefit of 7T imaging in a second patient with mesial temporal lobe epilepsy.
Fig 7.

A, 3T and 7T coronal FSE images obtained for a patient with mesial temporal lobe epilepsy. Subtle left hippocampal abnormalities are visualized in greater detail in the 7T image. B, In a second patient with mesial temporal lobe epilepsy, loss of gray matter in the left hippocampus is detected at 7T (white arrow), after no abnormalities were reported at 3T. Images are courtesy of Drs Michael Zeineh, Manoj Saranathan, and Brian Rutt, Stanford University, Stanford, California. Scanners: whole-body 3T and 7T MR imaging (MR950; GE Healthcare). RF coils: standard 3T head coil (GE Healthcare) and Nova 7T head coil. Scan parameters: section thickness = 2 mm, resolution = 0.22 × 0.22 × 2 mm3, scanning time = 10 minutes.
Brain Tumors.
Ultra-high-field MR imaging may be applied in different ways to better visualize brain tumor pathology. Superior image quality and enhanced sensitivity to susceptibility have been leveraged at 8T to depict the neovasculature in a high-grade glioma.40 1H-MR spectroscopic imaging (MRSI) at 7T has been shown to provide a benefit for measuring metabolic markers of tumor tissue, such as choline and N-acetylaspartate, with increased spectral and spatial resolution compared with 3T.45
Sodium MR imaging greatly benefits from the increased SNR available at 7T. Sodium signal has been shown to increase in brain tumors.46–48 This signal increase is caused by the cellular energetic breakdown of Na+/potassium+–adenosine triphosphatase, by sustained cell depolarization initiating cell division and by increased extracellular space. Thus, the total sodium signal probes several aspects of tissue viability.29 7T 23Na MR imaging using optimized pulse sequences has been performed in patients with brain tumors (14 World Health Organization [WHO] grades I–IV and 2 metastases).25 Figure 8 shows total sodium (23NaT) images (A–C) and relaxation-weighted (23NaR) sodium images (D–F) of a glioblastoma (WHO grade IV) of the left mesial frontal lobe. The 2 pulse sequences used for these images are given in Nagel et al.25
Fig 8.

A–C, Images of total sodium content for a patient with a glioblastoma of the mesial frontal lobe. Total sodium signal is elevated in tumor tissue. D–F, Images of relaxation-weighted sodium signal of the same patient. This provides sodium levels from a different tissue compartment and is only elevated in the central portion of the tumor. Images are courtesy of Drs Armin Nagel and Armin Biller, German Cancer Research Center, Heidelberg, Germany. Scanner: whole-body 7T MR imaging (Magnetom; Siemens). RF coil: rapid double-resonant (1H = 297.2 MHz; 23Na = 78.6 MHz) quadrature birdcage coil. Scan parameters: resolution = 2.5 × 2.5 × 2.5 mm3, scanning time = 13 minutes (A–C); resolution = 5.5 × 5.5 × 5.5 mm3, scanning time = 10 minutes (D–F).
Total sodium images and relaxation-weighted sodium images provide complementary data. In particular, 23NaT images provide a volume-weighted average of the intra- and extracellular sodium concentration, while the 23NaR images provide signal from a compartment defined by 23Na relaxation properties rather than intra- or extracellular histologic compartments. Nagel et al25 found that total sodium was elevated in all tumor types. However, the relaxation-weighted sodium signal was elevated only in glioblastomas, not in WHO grades I–III tumors. 23NaR, therefore, provides a noninvasive method for correct MR imaging distinction between WHO grade IV gliomas and WHO grades I–III tumors. In Figure 8, the total sodium signal is elevated in the entire tumor, while the relaxation-weighted signal increase is localized to the central tumor portion, consistent with the influx of 23Na into cells in that region.
Another MR imaging parameter, intratumoral susceptibility signals (ITSSs), correlates with tumor malignancy and may contribute to a grading system for gliomas.49,50 Park et al50 showed that the Spearman correlation coefficients between ITSS degree and glioma grade were 0.88 (95% CI, 0.79–0.94). Microvascular proliferation is a primary feature of glioblastoma, often resulting in microhemorrhages. These act as the source of ITSS within these lesions. Hemorrhage is an uncommon feature of B-cell primary CNS lymphoma, resulting in little-to-no ITSS within these lesions.51 Therefore, in addition to helping to grade gliomas, ITSS is useful for differentiating glioblastoma and primary CNS lymphoma.51 Because 7T MR imaging enhances sensitivity to susceptibility effects, 7T offers improved contrast and more detailed assessment of ITSS. Figure 9 shows TSE imaging and SWI acquired at 3T and 7T for a patient with a histopathologically confirmed left temporal glioblastoma. The MR imaging was performed before neurosurgery or any other treatment. ITSSs are more apparent and better resolved in the 7T SWI. The structural appearance of the tumor may be assessed in fine detail in Fig 9A.
Fig 9.

A, High-resolution TSE image of a left temporal glioblastoma. B, 7T SWI provides improved depiction of intratumoral vessels and hemorrhages (white arrow) compared with SWI at 3T (C). Images are provided by Dr Alexander Radbruch, Heidelberg University Hospital and German Cancer Research Center, Heidelberg, Germany. Scanner: whole-body 7T MR imaging (Magnetom; Siemens). RF coil: Nova 32-channel head coil. Scan parameters: resolution = 0.3 × 0.3 × 2 mm3, scanning time = 4 minutes and 13 seconds (A); resolution = 0.7 × 0.7 × 2.5 mm3, scanning time = 3 minutes and 18 seconds (B); resolution = 0.4 × 0.4 × 0.4 mm3, scanning time = 6 minutes and 17 seconds (C).
Multiple Sclerosis.
7T MR imaging has particular utility for visualizing the pathologic features of MS. The addition of 7T anatomic scans to clinical 3T imaging protocols improves classification of lesions at the cortical boundary52 and improves the detection and display of gray matter lesions.10 Local field shift maps that are sensitive to susceptibility differences in tissue have been used to quantify the pathologic increase in iron concentration in the basal ganglia of patients with MS versus controls.53 This method has also been used to detect iron-rich macrophages at the periphery of MS plaques.53 Early active MS lesions may be associated with venular dilation, and chronic lesions, with venular pruning and loss.54 Any vascular pathology associated with MS lesions may be assessed in vivo through highly sensitive T2* and susceptibility-weighted imaging at 7T.55,56 SWI at ultra-high fields also allows very effective depiction of the tiny venules within plaques in the cortex as shown in the image obtained at 7T from a patient with MS in Fig 10.
Fig 10.

7T SWI of a patient with MS. MS plaques (white and yellow arrows) and tiny veins within MS plaques (yellow arrows) become visible with the high resolution and enhanced contrast afforded by the 7T scanner. Images courtesy of Professor Siegfried Trattnig and Dr Günther Grabner, Medical University of Vienna, Vienna, Austria. Scanner: whole-body 7T MR imaging (Magnetom; Siemens). RF coil: Nova 32-channel head coil. Scan parameters: SWI sequence: resolution = 0.3 × 0.3 × 1.2 mm3, scanning time = 10 minutes.
Alzheimer Disease.
One early pathologic change in Alzheimer disease is neuronal loss in specific subfields of the hippocampus.57 High-resolution hippocampal imaging at 7T has been proposed as an effective tool for revealing these changes.9 7T MR imaging has already shown differences in the cornu ammonis 1 hippocampal subfield of patients with mild Alzheimer disease compared with controls.35 Figure 11 illustrates 7T images of the left hippocampus of age-matched healthy individuals (A) versus those with amnestic mild cognitive impairment (B) and probable Alzheimer disease (C). With increasing disease severity, the stratum radiatum/lacunosum-moleculare (thin apical dark band of tissue) becomes thinner, the dentate gyrus/CA3 region becomes greatly diminished in size, and the entire hippocampus shrinks in relation to the surrounding CSF.
Fig 11.

Left hippocampus imaged at 7T across aged-matched patient populations. Healthy control (A), amnestic mild cognitive impairment (B), and probable Alzheimer disease (C). Images courtesy of Drs Jeffrey Bernstein, Brian Rutt, and Geoffrey Kerchner, Stanford University, Stanford, California. Scanner: whole-body 7T MR imaging (MR950; GE Healthcare). RF coil: Nova 32-channel head coil. Scan parameters: FSE sequence: section orientation = coronal oblique intersecting perpendicular to longitudinal axis of hippocampus, TE/TR = 49/6000 ms, 16 sections, section thickness = 1.5 mm, resolution = 0.22 × 0.22 × 1.5 mm3, scanning time = 13 minutes.
Ultra-high-field MR imaging is also being used to investigate the possible increase in tissue iron associated with early-stage amyloid pathology. The cerebral cortex of patients with Alzheimer disease was studied by 7T T2*-weighted imaging to calculate the relative phase shift, a parameter that is sensitive to iron content. This study revealed increased phase shift within the cortex of patients with Alzheimer disease versus controls.58 Therefore, relative phase shift, measured through 7T T2*-weighted imaging, may serve as a potential early imaging marker for Alzheimer disease.
Psychiatric Illness.
The etiology of mood and anxiety disorders such as major depressive disorder remains poorly understood.59 Study results have been divergent, with no clear consensus on proper neuroimaging markers for these conditions.2,60 However, it is known that the medial prefrontal cortex and temporolimbic structures, including the hippocampus and amygdala, are critical nodes in major depression.57,61–63 Furthermore, high-spatial-resolution MR imaging at 4.7T and 7T successfully differentiates among hippocampal subfields and should, therefore, provide a more sensitive marker for psychiatric disease than does total hippocampal volume.12,13,64 Huang et al65 have already conducted high-field (4.7T) hippocampal subfield analysis in a group of patients with major depressive disorder, showing volume reductions in the cornua ammonis 1–3 and dentate gyrus hippocampal subfields and the posterior hippocampal body and tail for unmedicated patients with major depressive disorder versus controls. Further comprehensive high-field studies combining high-resolution anatomic scans with DTI and 1H-MRSI should help in detecting morphologic abnormalities, disruptions in connectivity,66 and reduced glial and neuronal cell attenuation67–69 associated with psychiatric disorders.
Technical and Physical Limitations
The present use of ultra-high-field MR imaging is limited by technical and patient concerns. The technical issues include inhomogeneity of both the main magnetic field and the applied radiofrequency (RF) field (B1), errors in chemical shift localization, and increased deposition of RF power within the patient. These cause image artifacts, limit section number/spatial coverage, and limit the use of MR spectroscopy.
B0 Inhomogeneity.
B0 inhomogeneity directly scales with field strength (Table). In MR imaging, this results in distortion of both the geometry and the intensity of images. Single- or few-shot rapid acquisition schemes such as echo-planar imaging or spiral imaging are particularly susceptible to geometric distortions due to susceptibility effects. In MR spectroscopy, B0 changes among voxels manifest as spectral shifts for the metabolite peaks. As a result, frequency-selective pulses that are designed to operate on particular spectral bands are less effective. Water and lipid suppression techniques become less effective. The varying B0 field within a voxel broadens the metabolite peaks, reduces the SNR, and increases peak overlap. To combat this effect, robust referencing schemes, advanced B0 shimming, and decreased voxel volumes are required.
B1 Inhomogeneity.
One of the most difficult problems to overcome at high magnetic fields is the severe B1 inhomogeneity over the volume of interest. As the B0 field increases to 7T, the RF operating wavelength becomes comparable with the diameter of the human head, resulting in a severe reduction of B1 strength in the brain periphery compared with the isocenter.70 This ultimately leads to signal drop-out and unexpected changes in contrast. Standard pulse sequences using conventional RF pulses for excitation and refocusing are very susceptible to changes in B1, resulting in spatially varying contrast and SNR in structural and spectroscopic images.
Lack of an RF Transmit Body Coil.
A third major technical issue has been the lack of an RF transmit body coil, making it necessary to integrate a dedicated RF transmit coil into head RF coil designs. This integration increases the complexity of RF head coil design. A few robust transmit/receive head coils are now becoming available for use at 7T, potentially resolving this problem. Such coils are usually supplied by the manufacturer at the time of scanner purchase.
RF Power Deposition.
RF power deposition, measured as the specific absorption rate (SAR), theoretically increases as the square of B0. Although other effects may partially compensate for this in practice, there is still a tighter limit on the number, duration, and amplitude of applied RF pulses in a given time period at 7T compared with 3T. For some commonly used MR imaging pulse sequences that use many closely spaced high-flip-angle RF pulses, such as fast spin-echo or turbo spin-echo (depending on the vendor), these pulses severely limit the number of sections that may be acquired. See Fig 12 for the simulated B1 and SAR in the brain at 7T compared with 3T.
Fig 12.
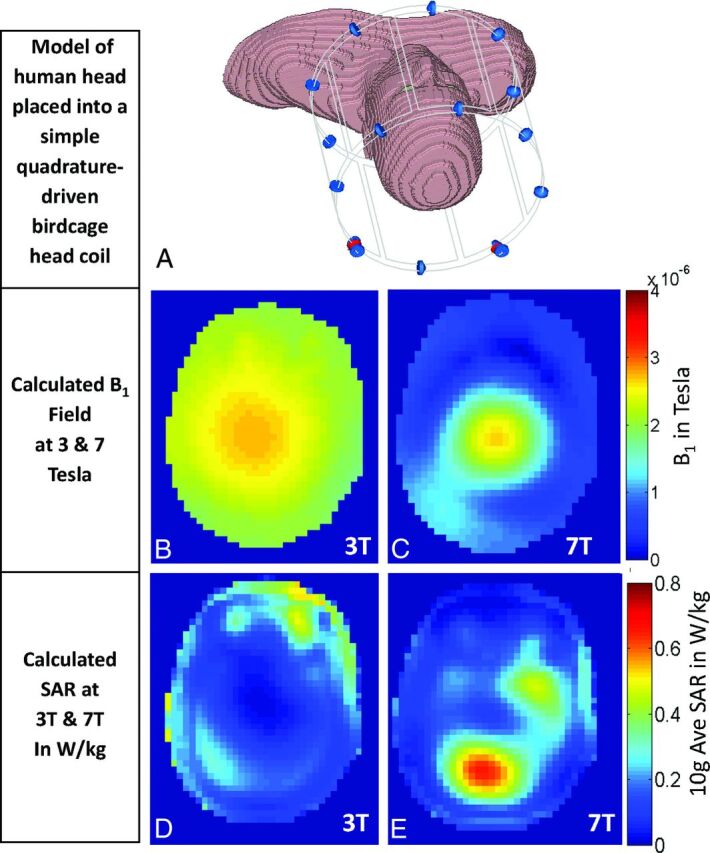
Differences between the transmitted B1 fields and the specific absorption rates at 3T and 7T. A, Model of a human head placed in a simple quadrature-driven birdcage head coil. B and C, Simulated transmitted B1 field (B1+) for 3T (B) and 7T (C). At 7T, wave-propagation effects cause more severe variation of the B1 field than is seen at 3T. D and E, Simulated SAR in the head model for 3T and 7T (in Watts per kilogram). SAR simulations show increased RF power deposition and greater spatial heterogeneity at 7T than at 3T. At 7T, one must contend with 2 physical limitations, the greater inhomogeneity in the transmit B1 field and the increased SAR deposition. These simulations were performed by Dr Bei Zhang at the Icahn School of Medicine, Mount Sinai, New York. A commercial finite-difference time domain software, CST Microwave Studio (Computer Simulation Technology, Darmstadt, Germany), was used to simulate electric and magnetic fields within the head for “Donna” in the Computer Simulation Technology virtual family. The B1 map was obtained by using 1W for the input power. The resolution of Donna is 1.875 × 1.875 × 2 mm3.
Changing Relaxation Behavior.
Relaxation constants change as a function of field strength (Table). T1 values lengthen and converge for most tissues as the field strength increases. T2* values decrease with field strength, resulting in enhanced contrast due to iron deposits, calcifications, and deoxygenated blood but also increased signal loss at tissue interfaces on gradient recalled-echo images. The exact, heuristically derived relationships between T1 and T2* and B0 are provided in the Table. At higher field strengths, apparent T2 values also shorten for spin-echo sequences due to diffusion effects through microgradients surrounding capillaries. The specific effect on T2 will depend on tissue type. The apparent T2 was experimentally found to shorten from 76 to 47 ms in frontal gray matter and from 71 to 47 ms in white matter, when moving from 3T to 7T.71 Single-echo sequences such as diffusion-weighted EPI are particularly vulnerable to such T2 shortening. In addition, such single-echo or few-echo series have distortions due to B0 and B1 inhomogeneity. Sequence timing must be changed to account for these effects and achieve the desired contrast. In particular, longer TRs and shorter TEs are required to maximize signal and contrast.
Increased Chemical Shift Localization Error.
MR spectroscopy is planned within a volume of interest specified at the scanner. However, the precise location of the volume achieved shifts with the RF pulse and with the resonant frequency of the metabolite. This spatial offset is called the chemical shift localization error. Because each metabolite to be studied has a different resonant frequency, each metabolite volume is spatially shifted with respect to the others. As a result, the volume in which all of the metabolites can be imaged together is smaller than the volume initially specified. The degree of the shift is proportional to the magnetic field strength (B0), proportional to the section width, and inversely proportional to the bandwidth of the applied RF pulse. Cho and NAA, for example, are separated by 1.2 ppm. This translates into a frequency separation of 153 Hz at 3T, but 360 Hz at 7T. Because chemical shift localization error is linearly proportional to this frequency shift, the usable volume in which MR spectroscopy can be performed is reduced at 7T.
Engineering Solutions
Solutions to some of the technical issues at 7T include customized RF pulse and pulse sequence designs to produce uniform transmission profiles while minimizing deposited RF energy (SAR). Development of specialized hardware such as multiple transmit coils for RF signal transmission is also necessary.
Customized RF Pulses and Pulse Sequences.
Creative RF pulse and pulse sequence design may be used to overcome many of the physical limitations of existing hardware so that the full signal gain and enhanced contrast afforded by 7T may be exploited. RF pulses are rapid changes in the amplitude and/or frequency of the applied RF field. They are designed to rotate the net magnetization into the transverse plane so that it is detected by an RF coil. A pulse sequence is a set of RF pulses followed by spatially varying magnetic field gradients to encode the received signal. Adiabatic pulses are a special class of RF pulses that, above a certain amplitude called the “adiabatic threshold,” uniformly rotate magnetization, independent of B1 field variations. These adiabatic RF pulses may be used to provide uniform flip angles in the presence of a nonuniform B1 field.72–74
Methods have been proposed to systematically design adiabatic pulses to achieve the same behavior as conventional RF pulses.75 2D selectivity may also be achieved by sampling an adiabatic pulse waveform with small-tip-angle spatial subpulses and coupling the pulse with an oscillating gradient waveform.76,77 The sampled envelope provides selectivity in the first dimension, while the subpulses provide selectivity in the second dimension. When the dimension selected by the sampled envelope is set to frequency (instead of space), the pulse acts as an adiabatic spatial-spectral pulse and provides spatial and spectral selectivity. Such specialized RF pulses may be used in existing and new MR imaging pulse sequences to enable robust operation at higher fields. Although new design considerations arise with the use of these pulses, they may be integrated seamlessly into many MR imaging pulse sequences, including those used for anatomic spectroscopic and diffusion-weighted imaging. Essentially, they provide the same contrast or tissue parameters, while combatting field inhomogeneity and remaining within safe RF power limits.73,77–83
Tailored RF Pulses to Compensate for B1 Inhomogeneities.
Another solution to B1 inhomogeneity is to create pulses that are specifically designed to compensate for the nonuniformities in the B1 field. The B1 field map for every subject may be measured by using new fast and accurate B1-mapping methods.84,85 Then, 2D tailored RF pulses may be designed to cancel the B1 variation and achieve a consistent flip angle throughout the FOV.86,87 These tailored 2D pulses require less RF power than adiabatic pulses but may have greater sensitivity to B0 inhomogeneity.
Parallel Imaging and Lower Flip Angle Schedules.
Parallel imaging may be used in conjunction with segmented readouts to accelerate acquisition times to overcome some of the SAR limitations and B0 field distortions.22 Lower flip angle schedules have been designed to achieve contrast similar to that achieved by trains of high flip angle RF pulses like TSE and FSE sequences. These may also help to reduce the amount of RF energy deposited.88
Specialized Parallel Transmit Hardware.
Another method to gain more control over the transmitted B1 profile is to use specialized hardware solutions such as parallel transmit arrays. By using multiple transmit coils, parallel transmit arrays divide the RF field into multiple, partially overlapping, spatial regions. These arrays may then be used to improve B1 field homogeneity in 2 ways: One way is by B1 shimming. This involves altering the amplitude and/or phase of the RF waveform transmitted on each channel to mitigate the B1 nonuniformity. The second way is by applying a different RF pulse to each transmit channel to customize the transmitted B1 field. This technique may be used to create a more nearly homogeneous B1 field over the full region of interest or to customize the B1 field in a specially defined region of interest.89–91
Currently, the heterogeneous SAR profiles resulting from multiple RF transmission are not fully understood, limiting flip angles to very small values to remain within safety limits. Furthermore, such an approach requires acquisition of subject-specific field maps to generate the custom RF pulses and requires the scanner to be equipped with parallel transmit hardware. Thus it remains valuable to have single-channel solutions for uniform B1-insensitive, section-selective RF excitation.
Multinuclear Imaging.
When imaging nuclei other than hydrogen, different physical considerations come into play. In fact, nuclei such as sodium, with lower gyromagnetic ratios, have more uniform B1 profiles and behave in a manner similar to that of protons at 1.5T. However, their resonant frequency, relatively low SNR, and different relaxation behavior require the use of custom-tuned RF coils and specialized sequences that rapidly encode spatial frequency space to capture the signal.26,30,92,93
Practical Considerations
Siting.
The ease of siting a 7T magnet has greatly improved in recent years. Because they are now actively shielded, 7T MR systems have become more compact and easy to site. Active shielding eliminates the need to place approximately 400 tons of iron shielding into the walls of the magnet room. Heretofore, such “passive” shielding may have been as thick as 12 inches (30.48 cm) to reduce the stray magnetic field that would otherwise emanate in all directions from the magnet.
Cost.
One factor in operating a 7T scanner has been helium boil-off. Newer magnets are “zero boil-off,” resulting in very little helium leak with time, reducing helium costs after initial magnet installation. A second factor has been economy of scale. Because manufacturers produce far fewer high-field magnets than 1.5T magnets, the unit cost of 7T MR imaging scanners remains high. Although prices vary according to vendor, 7T installations can cost approximately $10 million in the United States. As a larger number of research institutions and clinics adopt ultra-high-field scanners, these scanners will become mass produced, the manufacturing processes will become more streamlined, and the unit cost should decline.
The number of ultra-high-field scanner installations continues to grow as researchers harness the increased signal to push the boundaries of resolution and contrast. Currently, there are forty-three 7T installations worldwide, 19 of which are in the United States. Five magnets have been installed that are above 7T field strength and 7 more have been ordered.
FDA Approval.
7T whole-body human scanners are still pending 510K approval by the US FDA. However, the FDA has already designated MR imaging scanners functioning at 8T and below as nonsignificant risk for adults and children. For infants 1 month or younger, this limit is presently 4T. Human research at 7T at medical and academic institutions is governed by their respective institutional review boards. Some manufacturers have announced interest in obtaining the FDA 510K clearance for 7T human scanners. The role of researchers and clinicians in showing the clinical value of these scanners in humans will be pivotal to obtaining this approval.
Patient Experience
Risks at 7T are similar to those at 1.5T and 3T. However, there are some added considerations in terms of patient comfort and safety.
Transitory Physiologic Effects.
With regard to patient comfort level, the 7T scanner is very similar to 3T, except for limited transitory physiologic effects. Among the most frequently reported are dizziness and vertigo. These are due to magnetohydrodynamic forces exerted on ionic fluids in the inner ear as a person moves through the fringe field. To minimize these effects, patients are instructed not to move their heads quickly while near or in the magnet. For the same reason, 7T scan tables are programmed to move very slowly to ensure slow motion of the patient through the fringe field. Metallic taste in the mouth has also been reported and is likely due to electrolysis of metallic chemicals in dental fillings while moving through the field.94 All effects disappear when the person is out of the magnet.
Noise Levels, RF Energy Deposition, and Peripheral Nerve Stimulation.
Noise levels, RF energy deposition, and peripheral nerve stimulation are presently minimized by adherence to the conservative safety guidelines set by regulatory bodies such as the FDA and institutional safety committees. Acoustic noise in the scanner is a result of Lorentz forces on gradient windings producing bulk vibration. The Lorentz force is dependent on both the magnitude of the magnetic field and the orientation of the current-carrying gradient coil with respect to that field. For similar coil geometry and positioning, the Lorentz force should scale directly with the field strength. However, the exact scaling law between acoustic noise and field strength is difficult to determine because magnet bore and gradient coil geometry do play a significant role.95 Noise dampening, noise insulation, and encapsulation and sequence protocol design are used to bring noise down to comfortable levels, as specified by the FDA. At present, the safe noise level is set at 99 dB(A) with the use of ear protection.95 Systems have been tested to operate within these specified comfort levels.
RF energy deposition within the patient, quantified as the specific absorption rate, is closely tracked by SAR monitors to ensure that the sequences used do not exceed the conservative safety limits specified by the FDA. Peripheral nerve stimulation, which is related to the speed of switching gradients, is also monitored and limited. It is not field strength–dependent.
Implantable Devices.
Currently, only 2 contrast injectors and a radiofrequency identification device chip are approved for 7T scanners.96 However, researchers are testing a wide range of implantable devices to permit 7T MR scanning in a wider range of patients.
Conclusions and Future Directions
Ultra-high-field MR imaging has great potential to display in vivo subtle abnormalities that are not detectable at lower field strengths. Increasing the field strength provides opportunities to visualize subtle anatomic abnormalities associated with disease; reveal spatially varying metabolite ratios between smaller structures; isolate functional signal that is more tightly coupled to underlying neuronal activity; image microvasculature and blood products in great detail; and tap into the signal from nuclei other than protons, revealing new information about cellular activity. By using novel RF pulse and pulse sequence designs, we can overcome the technical barriers confounding ultra-high-field MR imaging and fully exploit the SNR advantage and enhanced contrast to visualize the brain in unprecedented detail. The combination of high-resolution anatomic, spectroscopic, and functional MR imaging at 7T has the potential to be a powerful, noninvasive toolset for improved diagnosis and treatment of a wide range of neurologic diseases and disorders.
Continued technical development of new signal transmission and readout methods is needed to overcome the physical limitations of performing high-field imaging in vivo within reasonable times and appropriate safety limits. Additional clinical studies are needed to demonstrate the value of 7T for disease diagnosis, treatment, and management. It is expected that continued advances in high-field imaging will lead to a new understanding of neurologic disease and improved detection and treatment of such diseases. These will propel the field forward.
Acknowledgments
We would like to thank Dr Christina Triantafyllou for providing information on the prevalence and availability of high-field MR imaging scanners and Dr Bernd Stoeckel for his input on current technical capabilities and limitations of 7T scanners.
ABBREVIATIONS:
- B0
magnetic field
- B1
radiofrequency field
- BOLD
blood oxygen level–dependent
- CT-PRESS
constant time point-resolved spectroscopic sequence
- ITSS
intratumoral susceptibility signal
- MRSI
MR spectroscopic imaging
- RF
radiofrequency
- SAR
specific absorption rate
- WHO
World Health Organization
Footnotes
Disclosures: Priti Balchandani—RELATED: Grant: National Institutes of Health, Comments: NIH-NINDS R00 NS070821, includes support for travel to meetings for the study or other purposes; Other: Siemens*; UNRELATED: Grants/Grants Pending: National Institutes of Health,* Comments: NIH-NINDS R00 NS070821; Patents (planned, pending or issued): patents filed with Stanford University and Icahn School of Medicine at Mount Sinai, Comments: 1) Priti Balchandani, Daniel Spielman, and John Pauly, “Method to Design Adiabatic RF Pulses Using the Shinnar-Le Roux Algorithm,” US patent 8,473,536; 2) Priti Balchandani, Daniel Spielman, and John Pauly, “Method for Magnetic Resonance Spectroscopic Imaging,” US patent 7,966,053; 3) Priti Balchandani, John Pauly, and Daniel Spielman, “Slice-selective Tunable-flip AdiaBatic Low peak-power Excitation Pulse,” US patent 7,683,618; 4) Priti Balchandani, John Pauly, and Daniel Spielman, “Self-Refocused Spatial-Spectral Pulse Pair,” US patent 7,821,263; 5) Priti Balchandani, Rebecca Feldman, and Haisam Islam, “Implementation of a Self-Refocused Adiabatic Spin Echo Pulse-Pair Modulated Using the Power Independent of the Number Of Slices (technique for simultaneous B1-insensitive multislice imaging.” US provisional patent submitted; Royalties: Some royalties received from patents listed above; Travel/Accommodations/Meeting Expenses Unrelated to Activities Listed: Siemens, Comments: visit to 7T sites; OTHER RELATIONSHIPS: I am employed by Icahn School of Medicine at Mount Sinai. Therefore, I am financially supported by the Icahn School of Medicine Capital Campaign, Translational and Molecular Imaging Institute, and Department of Radiology. Some of the images included in this article were obtained as part of my research at Mount Sinai. *Money paid to the institution.
This work was funded by the National Institutes of Health/National Institute of Neurological Disorders and Stroke grant R00 NS070821; Icahn School of Medicine Capital Campaign, Translational and Molecular Imaging Institute, and Department of Radiology, Icahn School of Medicine at Mount Sinai; and Siemens Healthcare.
REFERENCES
- 1. Clow H, Young IR. Britain's brains produce first NMR scans. New Scientist 1978;80:588 [Google Scholar]
- 2. Atlas SW. Magnetic Resonance Imaging of the Brain and Spine. Vol. 1. Philadelphia: Lippincott Williams & Wilkins; 2009 [Google Scholar]
- 3. Kraff O, Fischer A, Nagel AM, et al. MRI at 7 Tesla and above: demonstrated and potential capabilities. J Magn Reson Imaging 2015;41:13–33 [DOI] [PubMed] [Google Scholar]
- 4. Duyn JH. The future of ultra-high field MRI and fMRI for study of the human brain. Neuroimage 2012;62:1241–48 [DOI] [PMC free article] [PubMed] [Google Scholar]
- 5. Uğurbil K, Adriany G, Andersen P, et al. Ultrahigh field magnetic resonance imaging and spectroscopy. Magn Reson Imaging 2003;21:1263–81 [DOI] [PubMed] [Google Scholar]
- 6. Fatterpekar GM, Naidich TP, Delman BN, et al. Cytoarchitecture of the human cerebral cortex: MR microscopy of excised specimens at 9.4 Tesla. AJNR Am J Neuroradiol 2002;23:1313–21 [PMC free article] [PubMed] [Google Scholar]
- 7. Naidich TP, Duvernoy HM, Delman BN, et al. Vascularization of the Cerebellum and the Brain Stem. Vienna: Springer-Verlag; 2009 [Google Scholar]
- 8. Duvernoy H, Cattin F, Naidich TP, et al. The Human Hippocampus: Functional Anatomy, Vascularization and Serial Sections with MRI. 3rd ed. Berlin: Springer-Verlag; 2005 [Google Scholar]
- 9. Kerchner GA. Ultra-high field 7T MRI: a new tool for studying Alzheimer's disease. J Alzheimers Dis 2011;26(suppl 3):91–95 [DOI] [PubMed] [Google Scholar]
- 10. Kollia K, Maderwald S, Putzki N, et al. First clinical study on ultra-high-field MR imaging in patients with multiple sclerosis: comparison of 1.5T and 7T. AJNR Am J Neuroradiol 2009;30:699–702 [DOI] [PMC free article] [PubMed] [Google Scholar]
- 11. Thomas BP, Welch EB, Niederhauser BD, et al. High-resolution 7T MRI of the human hippocampus in vivo. J Magn Reson Imaging 2008;28:1266–72 [DOI] [PMC free article] [PubMed] [Google Scholar]
- 12. Wisse LE, Gerritsen L, Zwanenburg JJ, et al. Subfields of the hippocampal formation at 7 T MRI: in vivo volumetric assessment. Neuroimage 2012;61:1043–49 [DOI] [PubMed] [Google Scholar]
- 13. Prudent V, Kumar A, Liu S, et al. Human hippocampal subfields in young adults at 7.0 T: feasibility of imaging. Radiology 2010;254:900–06 [DOI] [PMC free article] [PubMed] [Google Scholar]
- 14. Haacke EM, Mittal S, Wu Z, et al. Susceptibility-weighted imaging: technical aspects and clinical applications, part 1. AJNR Am J Neuroradiol 2009;30:19–30 [DOI] [PMC free article] [PubMed] [Google Scholar]
- 15. Sanchez-Panchuelo RM, Besle J, Beckett A, et al. Within-digit functional parcellation of Brodmann areas of the human primary somatosensory cortex using functional magnetic resonance imaging at 7 Tesla. J Neurosci 2012;32:15815–22 [DOI] [PMC free article] [PubMed] [Google Scholar]
- 16. Duong TQ, Yacoub E, Adriany G, et al. Microvascular BOLD contribution at 4 and 7 T in the human brain: gradient-echo and spin-echo fMRI with suppression of blood effects. Magn Reson Med 2003;49:1019–27 [DOI] [PubMed] [Google Scholar]
- 17. Yacoub E, Duong TQ, Van De Moortele PF. Spin-echo fMRI in humans using high spatial resolutions and high magnetic fields. Magn Reson Med 2003;49:655–64 [DOI] [PubMed] [Google Scholar]
- 18. Bae KT, Park SH, Moon CH, et al. Dual-echo arteriovenography imaging with 7T MRI. J Magn Reson Imaging 2010;31:255–61 [DOI] [PMC free article] [PubMed] [Google Scholar]
- 19. Mayer D, Spielman DM. Detection of glutamate in the human brain at 3 T using optimized constant time point resolved spectroscopy. Magn Reson Med 2005;54:439–42 [DOI] [PubMed] [Google Scholar]
- 20. Polders DL, Leemans A, Hendrikse J, et al. Signal to noise ratio and uncertainty in diffusion tensor imaging at 1.5, 3.0, and 7.0 Tesla. J Magn Reson Imaging 2011;33:1456–63 [DOI] [PubMed] [Google Scholar]
- 21. Morelli JN, Runge VM, Feiweier T, et al. Evaluation of a modified Stejskal-Tanner diffusion encoding scheme, permitting a marked reduction in TE, in diffusion-weighted imaging of stroke patients at 3 T. Invest Radiol 2010;45:29–35 [DOI] [PubMed] [Google Scholar]
- 22. Heidemann RM, Porter DA, Anwander A, et al. Diffusion imaging in humans at 7T using readout-segmented EPI and GRAPPA. Magn Reson Med 2010;64:9–14 [DOI] [PubMed] [Google Scholar]
- 23. Feinberg DA, Setsompop K. Ultra-fast MRI of the human brain with simultaneous multi-slice imaging. J Magn Reson 2013;229:90–100 [DOI] [PMC free article] [PubMed] [Google Scholar]
- 24. Setsompop K, Cohen-Adad J, Gagoski BA, et al. Improving diffusion MRI using simultaneous multi-slice echo planar imaging. Neuroimage 2012;63:569–80 [DOI] [PMC free article] [PubMed] [Google Scholar]
- 25. Nagel AM, Bock M, Hartmann C, et al. The potential of relaxation-weighted sodium magnetic resonance imaging as demonstrated on brain tumors. Invest Radiol 2011;46:539–47 [DOI] [PubMed] [Google Scholar]
- 26. Nagel AM, Laun FB, Weber MA, et al. Sodium MRI using a density-adapted 3D radial acquisition technique. Magn Reson Med 2009;62:1565–73 [DOI] [PubMed] [Google Scholar]
- 27. Nagel AM, Lehmann-Horn F, Weber MA, et al. In vivo 35Cl MR imaging in humans: a feasibility study. Radiology 2014;271:585–95 [DOI] [PubMed] [Google Scholar]
- 28. Thulborn KR, Davis D, Snyder J, et al. Sodium MR imaging of acute and subacute stroke for assessment of tissue viability. Neuroimaging Clin N Am 2005;15:639–53, xi–xii [DOI] [PubMed] [Google Scholar]
- 29. Boada FE, LaVerde G, Jungreis C, et al. Loss of cell ion homeostasis and cell viability in the brain: what sodium MRI can tell us. Curr Top Dev Biol 2005;70:77–101 [DOI] [PubMed] [Google Scholar]
- 30. Qian Y, Zhao T, Wiggins GC, et al. Sodium imaging of human brain at 7 T with 15-channel array coil. Magn Reson Med 2012;68:1807–14 [DOI] [PMC free article] [PubMed] [Google Scholar]
- 31. Qian Y, Zhao T, Zheng H, et al. High-resolution sodium imaging of human brain at 7 T. Magn Reson Med 2012;68:227–33 [DOI] [PMC free article] [PubMed] [Google Scholar]
- 32. Qiao H, Zhang X, Zhu XH, et al. In vivo 31P MRS of human brain at high/ultrahigh fields: a quantitative comparison of NMR detection sensitivity and spectral resolution between 4 T and 7 T. Magn Reson Imaging 2006;24:1281–86 [DOI] [PMC free article] [PubMed] [Google Scholar]
- 33. Moser E, Stahlberg F, Ladd ME, et al. 7-T MR: from research to clinical applications? NMR Biomed 2012;25:695–716 [DOI] [PubMed] [Google Scholar]
- 34. Trattnig S, Zbýň S, Schmitt B, et al. Advanced MR methods at ultra-high field (7 Tesla) for clinical musculoskeletal applications. Eur Radiol 2012;22:2338–46 [DOI] [PubMed] [Google Scholar]
- 35. Madelin G, Kline R, Walvick R, et al. A method for estimating intracellular sodium concentration and extracellular volume fraction in brain in vivo using sodium magnetic resonance imaging. Sci Rep 2014;4:4763. [DOI] [PMC free article] [PubMed] [Google Scholar]
- 36. Kerchner GA, Hess CP, Hammond-Rosenbluth KE, et al. Hippocampal CA1 apical neuropil atrophy in mild Alzheimer disease visualized with 7-T MRI. Neurology 2010;75:1381–87 [DOI] [PMC free article] [PubMed] [Google Scholar]
- 37. Henry TR, Chupin M, Lehéricy S, et al. Hippocampal sclerosis in temporal lobe epilepsy: findings at 7 T. Radiology 2011;261:199–209 [DOI] [PMC free article] [PubMed] [Google Scholar]
- 38. Zeineh MM, Parvizi J, Balchandani P, et al. Ultra-high resolution 7.0T MRI of medial temporal lobe epilepsy. In: Proceedings of the Annual Meeting of the International Society for Magnetic Resonance in Medicine, Honolulu, Hawaii. April 18–24, 2009 [Google Scholar]
- 39. Grabner G, Nöbauer I, Elandt K, et al. Longitudinal brain imaging of five malignant glioma patients treated with bevacizumab using susceptibility-weighted magnetic resonance imaging at 7 T. Magn Reson Imaging 2012;30:139–47 [DOI] [PubMed] [Google Scholar]
- 40. Yuh WT, Christoforidis GA, Koch RM, et al. Clinical magnetic resonance imaging of brain tumors at ultrahigh field: a state-of-the-art review. Top Magn Reson Imaging 2006;17:53–61 [DOI] [PMC free article] [PubMed] [Google Scholar]
- 41. Eapen M, Zald DH, Gatenby JC, et al. Using high-resolution MR imaging at 7T to evaluate the anatomy of the midbrain dopaminergic system. AJNR Am J Neuroradiol 2011;32:688–94 [DOI] [PMC free article] [PubMed] [Google Scholar]
- 42. Breyer T, Wanke I, Maderwald S, et al. Imaging of patients with hippocampal sclerosis at 7 Tesla: initial results. Acad Radiol 20120;17:421–26 [DOI] [PubMed] [Google Scholar]
- 43. Madan N, Grant PE. New directions in clinical imaging of cortical dysplasias. Epilepsia 2009;50:9–18 [DOI] [PubMed] [Google Scholar]
- 44. Schlamann M, Maderwald S, Becker W, et al. Cerebral cavernous hemangiomas at 7 Tesla: initial experience. Acad Radiol 2010;17:3–6 [DOI] [PubMed] [Google Scholar]
- 45. Lupo JM, Li Y, Hess CP, et al. Advances in ultra-high field MRI for the clinical management of patients with brain tumors. Curr Opin Neurol 2011;24:605–15 [DOI] [PubMed] [Google Scholar]
- 46. Thulborn KR, Davis D, Adams H, et al. Quantitative tissue sodium concentration mapping of the growth of focal cerebral tumors with sodium magnetic resonance imaging. Magn Reson Med 1999;41:351–59 [DOI] [PubMed] [Google Scholar]
- 47. Thulborn KR, Lu A, Atkinson IC, et al. Quantitative sodium MR imaging and sodium bioscales for the management of brain tumors. Neuroimaging Clin N Am 2009;19:615–24 [DOI] [PMC free article] [PubMed] [Google Scholar]
- 48. Ouwerkerk R, Bleich KB, Gillen JS, et al. Tissue sodium concentration in human brain tumors as measured with 23Na MR imaging. Radiology 2003;227:529–37 [DOI] [PubMed] [Google Scholar]
- 49. Deistung A, Schweser F, Wiestler B, et al. Quantitative susceptibility mapping differentiates between blood depositions and calcifications in patients with glioblastoma. PloS One 2013;8:e57924. [DOI] [PMC free article] [PubMed] [Google Scholar]
- 50. Park MJ, Kim HS, Jahng GH, et al. Semiquantitative assessment of intratumoral susceptibility signals using non-contrast-enhanced high-field high-resolution susceptibility-weighted imaging in patients with gliomas: comparison with MR perfusion imaging. AJNR Am J Neuroradiol 2009;30:1402–08 [DOI] [PMC free article] [PubMed] [Google Scholar]
- 51. Radbruch A, Wiestler B, Kramp L, et al. Differentiation of glioblastoma and primary CNS lymphomas using susceptibility weighted imaging. Eur J Radiol 2013;82:552–56 [DOI] [PubMed] [Google Scholar]
- 52. Tallantyre EC, Morgan PS, Dixon JE, et al. 3 Tesla and 7 Tesla MRI of multiple sclerosis cortical lesions. J Magn Reson Imaging 2010;32:971–77 [DOI] [PubMed] [Google Scholar]
- 53. Hammond KE, Metcalf M, Carvajal L, et al. Quantitative in vivo magnetic resonance imaging of multiple sclerosis at 7 Tesla with sensitivity to iron. Ann Neurol 2008;64:707–13 [DOI] [PubMed] [Google Scholar]
- 54. Ge Y, Law M, Herbert J, et al. Prominent perivenular spaces in multiple sclerosis as a sign of perivascular inflammation in primary demyelination. AJNR Am J Neuroradiol 2005;26:2316–19 [PMC free article] [PubMed] [Google Scholar]
- 55. Ge Y, Zohrabian VM, Grossman RI. Seven-Tesla magnetic resonance imaging: new vision of microvascular abnormalities in multiple sclerosis. Arch Neurol 2008;65:812–16 [DOI] [PMC free article] [PubMed] [Google Scholar]
- 56. Quinn MP, Kremenchutzky M, Menon RS. Venocentric lesions: an MRI marker of MS? Front Neurol 2013;4:98. [DOI] [PMC free article] [PubMed] [Google Scholar]
- 57. Small SA, Schobel SA, Buxton RB, et al. A pathophysiological framework of hippocampal dysfunction in ageing and disease. Nat Rev Neurosci 2011;12:585–601 [DOI] [PMC free article] [PubMed] [Google Scholar]
- 58. van Rooden S, Versluis MJ, Liem MK, et al. Cortical phase changes in Alzheimer's disease at 7T MRI: a novel imaging marker. Alzheimers Dement 2014;10:e19–26 [DOI] [PubMed] [Google Scholar]
- 59. Drevets WC. Neuroimaging and neuropathological studies of depression: implications for the cognitive-emotional features of mood disorders. Curr Opin Neurobiol 2001;11:240–49 [DOI] [PubMed] [Google Scholar]
- 60. Wang Z, Neylan TC, Mueller SG, et al. Magnetic resonance imaging of hippocampal subfields in posttraumatic stress disorder. Arch Gen Psychiatry 2010;67:296–303 [DOI] [PMC free article] [PubMed] [Google Scholar]
- 61. Drevets WC. Neuroimaging studies of mood disorders. Biol Psychiatry 2000;48:813–29 [DOI] [PubMed] [Google Scholar]
- 62. Price JL, Drevets WC. Neurocircuitry of mood disorders. Neuropsychopharmacology 2010;35:192–216 [DOI] [PMC free article] [PubMed] [Google Scholar]
- 63. McKinnon MC, Yucel K, Nazarov A, et al. A meta-analysis examining clinical predictors of hippocampal volume in patients with major depressive disorder. J Psychiatry Neurosci 2009;34:41–54 [PMC free article] [PubMed] [Google Scholar]
- 64. Malykhin NV, Lebel RM, Coupland NJ, et al. In vivo quantification of hippocampal subfields using 4.7 T fast spin echo imaging. Neuroimage 2010;49:1224–30 [DOI] [PubMed] [Google Scholar]
- 65. Huang Y, Coupland NJ, Lebel RM, et al. Structural changes in hippocampal subfields in major depressive disorder: a high-field magnetic resonance imaging study. Biol Psychiatry 2013;74:62–68 [DOI] [PubMed] [Google Scholar]
- 66. Liao Y, Huang X, Wu Q, et al. Is depression a disconnection syndrome? Meta-analysis of diffusion tensor imaging studies in patients with MDD. J Psychiatry Neurosci 2013;38:49–56 [DOI] [PMC free article] [PubMed] [Google Scholar]
- 67. Miguel-Hidalgo JJ, Baucom C, Dilley G, et al. Glial fibrillary acidic protein immunoreactivity in the prefrontal cortex distinguishes younger from older adults in major depressive disorder. Biol Psychiatry 2000;48:861–73 [DOI] [PubMed] [Google Scholar]
- 68. Cotter D, Mackay D, Chana G, et al. Reduced neuronal size and glial cell density in area 9 of the dorsolateral prefrontal cortex in subjects with major depressive disorder. Cereb Cortex 2002;12:386–94 [DOI] [PubMed] [Google Scholar]
- 69. Si X, Miguel-Hidalgo JJ, O'Dwyer G, et al. Age-dependent reductions in the level of glial fibrillary acidic protein in the prefrontal cortex in major depression. Neuropsychopharmacology 2004;29:2088–96 [DOI] [PMC free article] [PubMed] [Google Scholar]
- 70. Vaughan JT, Garwood M, Collins CM, et al. 7T vs. 4T: RF power, homogeneity, and signal-to-noise comparison in head images. Magn Reson Med 2001;46:24–30 [DOI] [PubMed] [Google Scholar]
- 71. Cox EF, Gowland PA. Simultaneous quantification of T2 and T′2 using a combined gradient echo-spin echo sequence at ultrahigh field. Magn Reson Med 2010;64:1440–45 [DOI] [PubMed] [Google Scholar]
- 72. Tannús A, Garwood M. Adiabatic pulses. NMR Biomed 1997;10:423–34 [DOI] [PubMed] [Google Scholar]
- 73. Garwood M, DelaBarre L. The return of the frequency sweep: designing adiabatic pulses for contemporary NMR. J Magn Reson 2001;153:155–77 [DOI] [PubMed] [Google Scholar]
- 74. Balchandani P, Glover G, Pauly J, et al. Improved slice-selective adiabatic excitation. Magn Reson Med 2014;71:75–82 [DOI] [PMC free article] [PubMed] [Google Scholar]
- 75. Balchandani P, Pauly J, Spielman D. Designing adiabatic radio frequency pulses using the Shinnar-Le Roux algorithm. Magn Reson Med 2010;64:843–51 [DOI] [PMC free article] [PubMed] [Google Scholar]
- 76. Conolly S, Pauly J, Nishimura D, et al. Two-dimensional selective adiabatic pulses. Magn Reson Med 1992;24:302–13 [DOI] [PubMed] [Google Scholar]
- 77. Balchandani P, Pauly J, Spielman D. Interleaved narrow-band PRESS sequence with adiabatic spatial-spectral refocusing pulses for 1H MRSI at 7T. Magn Reson Med 2008;59:973–79 [DOI] [PMC free article] [PubMed] [Google Scholar]
- 78. Balchandani P, Spielman D. Fat suppression for 1H MRSI at 7T using spectrally selective adiabatic inversion recovery. Magn Reson Med 2008;59:980–88 [DOI] [PMC free article] [PubMed] [Google Scholar]
- 79. Balchandani P, Qiu D. Semi-adiabatic Shinnar-Le Roux pulses and their application to diffusion tensor imaging of humans at 7T. Magn Reson Imaging 2014;32:804–12 [DOI] [PMC free article] [PubMed] [Google Scholar]
- 80. Scheenen TW, Heerschap A, Klomp DW. Towards 1H-MRSI of the human brain at 7T with slice-selective adiabatic refocusing pulses. MAGMA 2008;21:95–101 [DOI] [PMC free article] [PubMed] [Google Scholar]
- 81. van Kalleveen IM, Koning W, Boer VO, et al. Adiabatic turbo spin echo in human applications at 7 T. Magn Reson Med 2012;68:580–87 [DOI] [PubMed] [Google Scholar]
- 82. Moore J, Jankiewicz M, Zeng H, et al. Composite RF pulses for B1+-insensitive volume excitation at 7 Tesla. J Magn Reson 2010;205:50–62 [DOI] [PMC free article] [PubMed] [Google Scholar]
- 83. Boer VO, Siero JC, Hoogduin H, et al. High-field MRS of the human brain at short TE and TR. NMR Biomed 2011;24:1081–88 [DOI] [PubMed] [Google Scholar]
- 84. Sacolick LI, Wiesinger F, Hancu I, et al. B1 mapping by Bloch-Siegert shift. Magn Reson Med 2010;63:1315–22 [DOI] [PMC free article] [PubMed] [Google Scholar]
- 85. Khalighi MM, Rutt BK, Kerr AB. Adiabatic RF pulse design for Bloch-Siegert B1+ mapping. Magn Reson Med 2013;70:829–35 [DOI] [PMC free article] [PubMed] [Google Scholar]
- 86. Saekho S, Yip CY, Noll DC, et al. Fast-kz three-dimensional tailored radiofrequency pulse for reduced B1 inhomogeneity. Magn Reson Med 2006;55:719–24 [DOI] [PMC free article] [PubMed] [Google Scholar]
- 87. Cloos MA, Boulant N, Luong M, et al. kT-points: short three-dimensional tailored RF pulses for flip-angle homogenization over an extended volume. Magn Reson Med 2012;67:72–80 [DOI] [PubMed] [Google Scholar]
- 88. Saranathan M, Tourdias T, Kerr AB, et al. Optimization of magnetization-prepared 3-dimensional fluid attenuated inversion recovery imaging for lesion detection at 7 T. Invest Radiol 2014;49:290–98 [DOI] [PMC free article] [PubMed] [Google Scholar]
- 89. Zhu Y. Parallel excitation with an array of transmit coils. Magn Reson Med 2004;51:775–84 [DOI] [PubMed] [Google Scholar]
- 90. Grissom W, Yip CY, Zhang Z, et al. Spatial domain method for the design of RF pulses in multicoil parallel excitation. Magn Reson Med 2006;56;620–69 [DOI] [PubMed] [Google Scholar]
- 91. Katscher U, Börnert P, Leussler C, et al. Transmit SENSE. Magn Reson Med 2003;49:144–50 [DOI] [PubMed] [Google Scholar]
- 92. Wang L, Wu Y, Chang G, et al. Rapid isotropic 3D-sodium MRI of the knee joint in vivo at 7T. J Magn Reson Imaging 2009;30:606–14 [DOI] [PMC free article] [PubMed] [Google Scholar]
- 93. Staroswiecki E, Bangerter NK, Gurney PT, et al. In vivo sodium imaging of human patellar cartilage with a 3D cones sequence at 3 T and 7 T. J Magn Reson Imaging 2010;32:446–51 [DOI] [PMC free article] [PubMed] [Google Scholar]
- 94. Chakeres DW, Kangarlu A, Boudoulas H, et al. Effect of static magnetic field exposure of up to 8 Tesla on sequential human vital sign measurements. J Magn Reson Imaging 2003;18:346–52 [DOI] [PubMed] [Google Scholar]
- 95. Robitaille P-M. Ultra high field magnetic resonance imaging: a historical perspective. In: Robitaille P-M, Berliner LJ, eds. Ultra High Field Magnetic Resonance Imaging. New York: Springer; 2006;26:1–17 [Google Scholar]
- 96. Shellock FG. MRISAFETY.com. . www.mrisafety.com. Accessed September 20, 2014.
- 97. Peters AM, Brookes MJ, Hoogenraad FG, et al. T2* measurements in human brain at 1.5, 3 and 7 T. Magn Reson Imaging 2007;25:748–53 [DOI] [PubMed] [Google Scholar]
- 98. Uludağ K, Müller-Bierl B, Uğurbil K. An integrative model for neuronal activity-induced signal changes for gradient and spin echo functional imaging. Neuroimage 2009;48:150–65 [DOI] [PubMed] [Google Scholar]
- 99. Solomon I. Relaxation processes in a system of two spins. Phys Rev 1955;99:559 [Google Scholar]
- 100. Bartha R, Michaeli S, Merkle H, et al. In vivo 1H2O T2+ measurement in the human occipital lobe at 4T and 7T by Carr-Purcell MRI: detection of microscopic susceptibility contrast. Magn Reson Med 2002;47:742–50 [DOI] [PubMed] [Google Scholar]
- 101. Michaeli S, Garwood M, Zhu XH, et al. Proton T2 relaxation study of water, N-acetylaspartate, and creatine in human brain using Hahn and Carr-Purcell spin echoes at 4T and 7T. Magn Reson Med 2002;47:629–33 [DOI] [PubMed] [Google Scholar]
- 102. Van Leemput K, Bakkour A, Benner T, et al. Automated segmentation of hippocampal subfields from ultra-high resolution in vivo MRI. Hippocampus 2009;19:549–57 [DOI] [PMC free article] [PubMed] [Google Scholar]
- 103. Gu M, Zahr NM, Spielman DM, et al. Quantification of glutamate and glutamine using constant-time point-resolved spectroscopy at 3 T. NMR Biomed 2013;26:164–72 [DOI] [PMC free article] [PubMed] [Google Scholar]