

Abstract
Hippocampal CA3 area generates temporally structured network activity such as sharp waves and gamma and theta oscillations. Parvalbumin-expressing basket cells, making GABAergic synapses onto cell bodies and proximal dendrites of pyramidal cells, control pyramidal cell activity and participate in network oscillations in slice preparations, but their roles in vivo remain to be tested. We have recorded the spike timing of parvalbumin-expressing basket cells in areas CA2/3 of anesthetized rats in relation to CA3 putative pyramidal cell firing and activity locally and in area CA1. During theta oscillations, CA2/3 basket cells fired on the same phase as putative pyramidal cells, but, surprisingly, significantly later than downstream CA1 basket cells. This indicates a distinct modulation of CA3 and CA1 pyramidal cells by basket cells, which receive different inputs. We observed unexpectedly large dendritic arborization of CA2/3 basket cells in stratum lacunosum moleculare (33% of length, 29% surface, and 24% synaptic input from a total of ∼35,000), different from the dendritic arborizations of CA1 basket cells. Area CA2/3 basket cells fired phase locked to both CA2/3 and CA1 gamma oscillations, and increased firing during CA1 sharp waves, thus supporting the role of CA3 networks in the generation of gamma oscillations and sharp waves. However, during ripples associated with sharp waves, firing of CA2/3 basket cells was phase locked only to local but not CA1 ripples, suggesting the independent generation of fast oscillations by basket cells in CA1 and CA2/3. The distinct spike timing of basket cells during oscillations in CA1 and CA2/3 suggests differences in synaptic inputs paralleled by differences in dendritic arborizations.
Introduction
Complex representations underlying memory, perception, and action are encoded by the synchronous activity of subpopulations of neurons, organized into cell assemblies (Hebb, 1949). Synchronous neuronal activity is reflected in extracellular currents and associated local field potential (LFP). Oscillations of the LFP in various frequency bands are correlated to behavioral states: theta (4–8 Hz) oscillations with exploratory behavior, sharp wave-associated ripples (SWRs; 90–200 Hz) with resting “consummatory behavior,” and gamma (30–80 Hz) oscillations with cognitive processing (Gray et al., 1989; Lisman and Idiart, 1995; Llinás et al., 1998; Engel et al., 2001; Howard et al., 2003). Cortical oscillations create “windows of synchrony” that form a basis for defining cell assemblies (Buzsáki and Draguhn, 2004) both within and between brain areas. These cell assemblies are thought to consist of subsets of temporally coactive pyramidal cells (Engel et al., 2001; Harris, 2005) and diverse populations of associated GABAergic interneurons (Freund and Buzsáki, 1996; Markram et al., 2004; Somogyi, 2010). In particular, parvalbumin (PV)-expressing basket cells, innervating pyramidal cell somata and proximal dendrites, are able to entrain and synchronize the firing of postsynaptic pyramidal cells (Cobb et al., 1995). The relatively short time constants and cable properties of PV-expressing basket cells enables them to follow high-frequency oscillations precisely (Glickfeld and Scanziani, 2006; Nörenberg et al., 2010). Because each PV-expressing basket cell innervates hundreds of pyramidal cells (Halasy et al., 1996; Mercer et al., 2007, 2012) and also connects to other PV-expressing basket cells via gap junctions (Fukuda and Kosaka, 2000) and synapses (Cobb et al., 1997; Pawelzik et al., 2003), they can fire synchronously and exert a powerful effect on pyramidal cells. The firing of PV-expressing basket cells in area CA1 correlates with network activity during a range of oscillations (Ylinen et al., 1995a,b; Klausberger et al., 2003; Tukker et al., 2007; Lapray et al., 2012). Furthermore, in vitro models of oscillations suggest an important role for perisomatic inhibition in the generation of theta and gamma oscillations (Fischer et al., 2002; Gillies et al., 2002; Hájos et al., 2004; Oren et al., 2006). Genetic modifications of PV-expressing cells, some of which are basket cells, have also shown their importance for oscillations and associated cognitive functions (Fuchs et al., 2007; Cardin et al., 2009; Racz et al., 2009; Sohal et al., 2009; Wulff et al., 2009; Lovett-Barron et al., 2012; Royer et al., 2012).
Observations from freely moving animals and in vitro models suggest that sharp waves and gamma oscillations are generated in area CA3 (Buzsáki, 1986; Csicsvari et al., 1999, 2003; Behrens et al., 2005), but the in vivo firing of identified basket cells is unknown. This area is important for the fast encoding and consolidation of memory traces (Nakazawa et al., 2002, 2003). To gain insight into the role of PV-expressing basket cells in the organization of network activity thought to underlie such functions, we have recorded the firing pattern of identified CA3 PV-expressing basket cells in relation to network oscillations.
Materials and Methods
All animal procedures were performed in accordance with the Animals (Scientific Procedures) Act, 1986 (United Kingdom) and associated regulations. After induction of anesthesia with isoflurane (IsoFlo; Abbott Laboratories), male Sprague Dawley rats (250–350 g; Charles River Laboratories) were anesthetized with urethane (1.25 g/kg body weight, i.p; Sigma-Aldrich) and an initial dose (0.1–0.2 ml, i.p.) of ketamine (67 mg/ml; Ketaset; Fort Dodge Animal Health) and xylazine (7 mg/ml; Rompun). Additional doses (0.02–0.05 ml, i.p.) were given as needed.
Juxtacellular recordings.
Extracellular recordings were performed with two glass electrodes (12–30 MΩ) filled with 1.5% neurobiotin (Vector Laboratories) in 0.5 m NaCl, to record action potentials (APs) and the LFP in CA2/3 (3.0–3.2 mm posterior, 2.7–3.5 mm right of bregma) and the LFP in CA1 stratum pyramidale (3.2–3.6 mm posterior, 2.0–2.2 mm right of bregma). Signals from both electrodes were amplified (Neurodata IR 283A amplifier and IR X83 HS-01 preamplifier; Cygnus Technology), bandpass filtered (LFP, 0.3–300 Hz, BF-48DGX; units, 0.8–5 kHz, DRA-2FS; NPI Electronic), and digitized at 1 kHz (LFP) or 20 kHz (units; Power1401 ADC; Cambridge Electronic Design). After unit recording (n = 6; 264–2723 s per recording), the cell was labeled juxtacellularly with neurobiotin, as described previously (Klausberger et al., 2003).
The stereotactic coordinates and physiological criteria (Tukker et al., 2007) indicated that the CA1 LFP electrode was in, or close to, stratum pyramidale in each case except one (J31a), where it was located at the stratum radiatum border.
Tetrode recordings.
In separate experiments (n = 5 rats), in addition to glass electrode recordings (as above) extracellular recordings were made from CA3 stratum pyramidale with a pair of wire tetrodes (wires, 12 μm diameter; California Fine Wire) with gold plated tips (noncyanide gold solution; SIFCO). Two tetrodes, together with a wire connected to a grounding screw in the skull above the cerebellum, were connected to a 16-channel headstage (RA16AC; Tucker-Davis Technologies). Signals were amplified 1000 times, low-pass filtered at 6 kHz (Lynx-8; Neuralynx), and digitized (20 kHz; same ADC as for the glass electrode). Clusters of APs (n = 15 putative pyramidal cells) were separated in two steps (Harris et al., 2000; Henze et al., 2000) using automated cluster separation by Klustakwik (Harris et al., 2000; K. D. Harris Imperial College, London, U.K.; http://klustakwik.sourceforge.net/) followed by manual refinement with Klusters (http://klusters.sourceforge.net; Hazan et al., 2006). Only clusters showing a clear refractory period were included in the analysis. Putative pyramidal cells were separated from interneurons based on their larger spike width, smaller average firing rate, and autocorrelogram showing a clear peak at 4–6 ms (typical for bursty firing). For all reported firing patterns of putative pyramidal cells, the CA3 LFP is derived from one designated tetrode channel.
In one case (B42) the extracellularly recorded and juxtacellularly labeled basket cell was recorded simultaneously with two putative pyramidal cells by tetrodes. The firing pattern of the interneuron was analyzed both with respect to the LFP recorded from the glass electrode in CA3 and from one channel of the tetrode (also in CA3); the LFP recordings were qualitatively similar. Only the result for the glass electrode is reported for the interneuron (B42c), whereas the LFP from the tetrode is reported for the putative pyramidal cells (B42o and B42p).
Analysis of oscillations.
Spike timing, determined by thresholding, was related to oscillations in various frequency bands, as described previously (Klausberger et al., 2003; Tukker et al., 2007). Unless indicated otherwise, all analyses were done with custom-written Spike2 scripts (Cambridge Electronic Design). Oscillation cycles were defined as intertrough intervals in the filtered signals (digital bandpass finite impulse response filters).
Theta oscillations were detected within episodes of at least 6 s (2 s for J31a) where the ratio of power (root mean square amplitude; 2 s windows) in the theta (3–6 Hz) to delta (2–3 Hz) frequency bands exceeded four. From the detected epochs, we selected a subset of clear theta epochs by visual inspection, sometimes adjusting the borders (start/end) manually. Theta oscillations were detected separately in CA1 and CA3.
Gamma oscillations were defined as all cycles in the filtered (30–80 Hz) LFP with a wavelength of 12.5–33.3 ms and an amplitude above the mean (Tukker et al., 2007). In one case (J31a), where CA1 LFP was recorded in proximal stratum radiatum (SR) rather than stratum pyramidale (SP), for the sake of comparability to other recordings where gamma phase was recorded in SP, we shifted the observed phase by 180°. Gamma oscillations in CA3 and CA1 were detected separately. For this first gamma analysis, no spike-artifact removal was used, but after visual inspection, LFP signals with large action potential artifacts were discarded to prevent detection of spurious correlations. In addition, a frequency-dependent spike coupling analysis was determined for CA3 basket cells in the 15–100 Hz range, as described previously (Lasztóczi et al., 2011). This second analysis was performed using the LFP recorded with the juxtacellular (local) CA3 electrode during periods of theta oscillations, with spike artifacts removed (linear interpolation). We performed control analyses to assess the effects of spike artifacts and their removal on gamma phase coupling. First, after testing phase coupling of basket cell B42c using the second analysis method, we found that the coupling phase was similar to the local LFP recorded by the glass electrode after artifact removal, and to the LFP recorded by the artifact-free tetrode in CA3. Frequency of maximal coupling (fmax) was 65.2 and 71.4 Hz, r(fmax) was 0.17 and 0.2, and mean phase (fmax) was 48.1° and 53.9° for the LFP from the glass electrode and for the LFP from the tetrode, respectively. Second, we compared the gamma phase coupling before and after artifact removal (linear interpolation) on data from basket cell recording B15a. The results were similar: r = 0.376 versus 0.379; mean phase, 109.9 versus 111.3°; n = 1005 and 1009 spikes during significant gamma cycles without or with artifact interpolation, respectively. These data, together with previous controls (Lasztóczi et al., 2011) indicate that conclusions on spike coupling to gamma phase, extracted from the local LFP, are not significantly affected under our conditions.
Ripple episodes were selected manually from periods where the maximum power (RMS; 10 ms windows) within the ripple (90–140 Hz) frequency band was at least five SDs above the mean and the minimal power remained at least one SD above the mean. Ripple oscillations were defined as cycles, occurring within ripple episodes detected in CA1 with a wavelength below 11.1 ms. Ripple frequency was computed as the inverse of the time between neighboring troughs. Mean ripple amplitude was computed based on the absolute amplitude for all troughs occurring during selected ripple episodes.
The phase of each AP relative to a coincident oscillation cycle was computed by linear interpolation between trough times. The direction of the normalized vector sum of all phase values (Zar, 1999) indicates the cell's preferred phase angle; its length (r) quantifies the coupling strength. Firing was regarded as oscillation modulated if APs were nonuniformly distributed (relative to the detected oscillations) according to the Rayleigh test (p < 0.05) (Zar, 1999). In phase histograms (36° bins, 0° marks the trough), the number of detected APs per bin was divided by the total number of detected APs.
To compare preferred phase angles of CA2/3 PV-expressing basket cells with those recorded previously in CA1 (Klausberger et al., 2003; Tukker et al., 2007), the angular difference between vector sums was computed. Significance was evaluated with a two-sample permutation test (Good, 2000) implemented in Matlab (MathWorks). Similar methods were used for comparison of noncircular data, where a two-tailed probability value was computed using pairwise exact Wilcoxon signed ranks (W) tests (SPSS Statistics).
Histological analysis.
Two to 4 h after labeling a cell, cardiac perfusion with saline was followed by ∼20 min fixation with 4% paraformaldehyde, 15% (v/v) saturated picric acid, and 0.05% glutaraldehyde in 0.1 m phosphate buffer (PB), pH 7.2–7.4. Coronal sections cut at nominally 70 μm thickness with a vibratome (Leica VT 1000S) were stored serially in tissue culture wells in 0.1 m PB containing 0.05% NaN3. An initial series of one in four sections was reacted with streptavidin conjugated to either Alexa488 (1:1000; Invitrogen), DyLight488 (1:500 or 1:1000; Jackson ImmunoResearch Laboratories), or 7-amino-4-methylcoumarin-3-acetic acid (AMCA; 1:100; Vector Laboratories) dissolved in 0.1 m PB containing 0.3% Triton. Sections mounted in Vectashield (Vector Laboratories) were assessed, and individual sections were processed in one of four ways: (1) Converting the streptavidin-fluorescence signal to polymerized 3,3′diaminobenzidine (DAB) horseradish peroxidase (HRP) end product for analysis of neuronal processes at high resolution; (2) immunofluorescence labeling of the section containing the labeled neuron(s) to detect molecules in, or in the inputs to labeled neurons; (3) processing new sections of the cell(s) for electron microscopy by HRP reaction without detergent treatment to evaluate synaptic inputs and outputs; (4) processing for visualizing both neurobiotin and one protein or peptide by double immunoperoxidase methods for either light (detergent used) or electron (detergent not used) microscopy to evaluate the nature of synaptic inputs to the labeled neuron, or the laminar boundaries of layers. For the latter we used labeling of the medial entorhinal afferents for mGluR2 to test the boundary of the stratum radiatum and stratum lacunosum moleculare. All sections for the reconstruction of labeled neurons were treated with OsO4 (0.1–1%) and mounted on slides in epoxy resin (Durcupan; Fluka).
The detailed methods, including specification for microscopic image acquisition and handling, have been published previously (Lasztóczi et al., 2011). Briefly, sections for electron microscopy were processed with freeze-thaw permeabilization. Reactions for HRP were done using DAB as chromogen. Neurobiotin was revealed by the glucose oxidase method either with or without Ni2+ intensification; immunoperoxidase visualization involved the use of H2O2 as substrate.
Immunohistochemistry.
Individual sections were treated with up to four primary antibodies (not all reported here), detected with secondary antibodies conjugated to fluorophores (Vector Laboratories, Invitrogen, Jackson Immunoresearch Laboratories) and mounted in Vectashield (Lasztóczi et al., 2011). Primary antibodies to the following molecules were used: PV, rabbit polyclonal (Swant); PV, mouse monoclonal (Swant); type 1 cannabinoid receptor (CB1), guinea pig polyclonal (gift from M. Watanabe, Hokkaido University, Sapporo, Japan); α-actinin-2, mouse monoclonal (Sigma); calbindin D-28k, mouse monoclonal (Swant); GABA-A receptor α1 subunit, rabbit polyclonal (gift from W. Sieghart, Medical University of Vienna, Vienna, Austria); mGluR2/3, rabbit polyclonal (gift from R. Shigemoto, National Institute for Physiological Sciences, Okazaki, Japan). Details of the antibodies and references to tests of antibody specificity can be found in our previous publications (Klausberger et al., 2005; Fuentealba et al., 2010; Lasztóczi et al., 2011). For the evaluation of most reactions standard epifluorescence, structured illumination or confocal microscopy were used, as described in detail previously (Ferraguti et al., 2004; Lasztóczi et al., 2011). Although we applied standard procedures, due to unavoidable differences in some parameters between experiments, the results of immunofluorescent reactions showed variability. Immunofluorescence signals in the neurobiotin-labeled axonal, dendritic, or somatic compartments, as appropriate, were compared to neighboring immunopositive and immunonegative structures of similar type in the same focal plane.
For delineating the boundaries of hippocampal areas for the flat map, a series of immunoperoxidase-processed coronal sections of one left hemisphere (rat B42) were used labeled by rabbit polyclonal antisera to calbindin D-28k (CB38; Swant) using 0.1% triton. The antibodies were visualized with a DAB reaction (swine anti-rabbit antibody conjugated to HRP; Dako).
The specificity of the methods for the immunoreactions was tested by omitting the primary antibodies and applying only the secondary antibodies to the sections. Under our conditions the signals considered to result from the primary antibodies were not detected in these reactions. No parts of the images were selectively modified in any way, and digital brightness and contrast adjustments were made on full frames.
Reconstruction of neurons labeled by neurobiotin.
Four neurobiotin-labeled PV-expressing basket cells (B13a, B15a, B42c, and J31a) were selected for digital reconstruction from resin-embedded, osmium-treated sections reacted for HRP. In addition, we have digitally reconstructed and analyzed four PV-expressing basket cells in the CA1 area (T44a, T75, J82a, and T119a) to compare the laminar distribution of their dendrites. Only one of these CA1 neurons (T44a) was shown previously in a two-dimensional manual reconstruction (Klausberger et al., 2003).
Cell bodies, complete dendritic trees, and representative axon segments (containing the axon initial segment and main collaterals) were traced [Neurolucida, MFB Bioscience; Nikon Eclipse 80i transmitted light microscope; Lucivid microdisplay, (MFB Bioscience) in continuous mode using a VC Plan Apo 100×/1.4 numerical aperture (NA) oil immersion lens]. Hippocampal laminar boundaries were introduced from one focal plane in the middle of each section, using a Plan Fluor 20×/0.5 NA dry lens.
Tissue shrinkage due to histological processing was corrected by expanding all elements within individually traced sections in X, Y, and Z dimensions (see below). Neighboring sections were aligned and individual dendritic branches were split at their crossing points of the laminar boundaries and color coded accordingly.
Measuring the thickness of vibratome sections and correcting for shrinkage in the Z dimension.
We measured section thickness to compensate for changes due to tissue processing. Sections were incubated in DAPI (1:1000) in 0.1 m PB for 1 min and mounted on glass slides in PB under a coverslip. Care was taken to keep the sections flat but to avoid the capillary force squashing the section and reducing its thickness. Measurements were performed using an AxioImager.Z1 microscope (Carl Zeiss) and a Plan-Apochromat 63×/1.4 oil objective. The top and bottom of the sections were identified at the focal depth where nuclei started to go out of focus using the Axiovision (Zeiss) software. The thickness of sections mounted in resin was measured using the Neurolucida system with a 100×/1.4 NA objective.
Whenever possible, the individual measurement of section thickness before processing was used for subsequent corrections for tissue shrinkage in the Z dimension. For a proportion of sections, the assumed thickness before processing was calculated using a formula based on the relationship between the thickness obtained before processing and after resin embedding from a set of sections where both measurements were taken. The relationship between section thicknesses before and after processing (n = 50; 7 cells) was Y(X(49, 78)) = 0.90 × X + 16, where Y is the vibratome section thickness before processing and X is the resin-embedded section thickness in micrometers. We expanded the dendritic Z dimensions in each section to the thickness of that section, either estimated or measured, before processing. Triton-treated section thicknesses were first expanded to the average for the freeze-thaw-treated sections of the same brain followed by the 4% shrinkage correction to the state before processing.
Measuring lateral tissue shrinkage of the vibratome sections.
To estimate the dimensions of the cells in the perfusion fixed brain, the measurements obtained in the HRP-reacted, resin-embedded sections needed to be expanded to the dimensions of the freshly sectioned brain. First, Vibratome sections mounted in PB under a coverslip were imaged using a Leica MZ6 stereomicroscope equipped with an Olympus SP-350 digital compact camera. Following processing and embedding in epoxy resin under a coverslip (see details above), these sections were imaged again. Distances (four to five per section) between conspicuous blood vessels were measured and compared, giving an average ratio for freeze-thaw-treated sections of 1.04 ± 0.01 for fresh/resin-embedded sections (n = 14), corresponding to 4% linear shrinkage. Triton treatment resulted in larger shrinkage in the X, Y, and Z dimensions. For these sections, the number of antibody cycles and consequent mounting/demounting and storage over months under coverslip has contributed to a variable shrinkage. The average shrinkage in the X and Y dimensions was 10%, and this factor was applied to all Triton-treated sections.
Measuring the thickness of electron microscopic resin sections.
A novel method was applied, whereby in electron microscopic (EM) images we first measured the thickness (z) of a layer of hippocampal tissue of ∼1 μm thickness embedded in epoxy resin. Subsequently we cut another part of this layer parallel with its surface completely on an ultramicrotome into n EM sections. The true thickness of EM sections is given by z/n, which was 65 ± 4 nm (n = 9 blocks). The following steps were used: (1) We cut a semithin section of 1.19 ± 0.05 μm thickness (n = 9) from a block with highly osmiophilic tissue (immunoperoxidase reaction for PV) and dried it on a glass slide without heating. (2) A cylinder of epoxy resin (EM block) was placed over it and polymerized. (3) The glass slide was removed so that the section remained in the block. (4) The height of the cylinder was reduced to ∼0.5 mm on a lathe. (5) The cylinder was cut perpendicular to the section plane with a razor blade into two half cylinders. (6) One half cylinder (Block A) was placed in an embedding mold so that the semithin section was cut edge on in the ultramicrotome. (7) The other half cylinder (Block B) was stuck flatly on a blank resin stub so that the section could be cut parallel with the original semithin section surface. (8) We cut EM sections of Block A, ensuring that the long edge of the semithin section was perpendicular to the diamond knife edge to avoid compression of its short dimension, which was measured (z) on EM images. (9) We cut Block B, the half semithin section, parallel to its original surface, ensuring that the first section is retrieved as the block reached the diamond knife until the complete semithin section was gone (18.6 ± 1.7 sections per block; n = 9). Altogether, 168 EM sections were counted.
Calculating EM section compression during sectioning and compensation for change in dendritic diameter.
The force applied by the diamond knife during the cutting of serial EM sections compresses the sections depending on the type of resin, knife angle, and cutting speed. Section compression was calculated by dividing the width of EM sections measured perpendicular to the diamond knife blade (X–Y plane) on low-magnification electron micrographs by the width of the tissue block face in the resin, measured on light microscopic tracings by a drawing tube. The sections were compressed to 79.5 ± 6.4% (n = 5) of the original block face width in the direction perpendicular to the knife edge. Therefore, the major and minor diameters of dendritic ellipse profiles were expanded accordingly using a factor of 1.26 ± 0.09 (mean quotient of the width of the block face divided by the width of the EM section) taking into account the orientation of the dendritic profile. The angle between the edge of the EM section parallel with the knife edge and the major axis of the dendritic profile fitted ellipse was measured on three EM sections in the series covering the whole segment and averaged. The average minor and major dendritic diameters of the ellipse were expanded using standard trigonometry. There was no change in the EM section dimension in the direction parallel with the knife edge; the mean quotient was 1.05 ± 0.03 (n = 4).
Dendritic length and cell surface estimates.
We measured the density of synapses on dendritic segments in freeze-thaw-treated sections of all hippocampal layers using EM (Fig. 1). The total dendritic lengths and surfaces were estimated first for the Neurolucida-measured resin-embedded dimensions (without detergent) as an intermediate step to estimating the number of input synapses. Then, we used shrinkage-correction factors to arrive at the dimensions for the freshly cut, fixed brain. For all dendritic sections, the tissue shrinkage in X, Y, and Z dimensions was corrected using the calculated appropriate shrinkage factors depending on the method of processing, as described above. The calculations were based on the data point of “dendritic segment, ” which is a length of dendrite between the soma and a branch point, the soma and a laminar boundary crossing, a branch point and a laminar boundary crossing, two branch points, or a branch point and a natural end. Finally, all dendritic segments were measured, layer by layer, using Neurolucida Explorer (MFB Bioscience) software. The dendritic lengths within each layer were summed, followed by summing laminar length values to provide the total dendritic length for a basket cell.
Figure 1.

Estimation of the dendritic surface area and the number of input synapses on PV-expressing basket cells in the CA3 area. A, Dendrogram of a basket cell (B15a) in CA3a. Resin-embedded sections of the dendritic tree were traced digitally using Neurolucida, and dendrite thickness was estimated using a 100× oil-immersion objective. The laminar positions of dendrites are color coded. Three areas, covering all layers among them, were reembedded for electron microscopic sectioning, and every dendritic segment present in the plane of the section was serially sectioned and recorded. Arrowheads mark the positions from which the EM samples were taken. B, The irregular membrane outlines of dendrites were traced in ImageJ, and the profiles were approximated with an ellipse of equivalent area (“Fit ellipse ” function); the minor (d) and major (D) diameters were derived for each EM section. Synapses (arrows) were counted (boutons, asterisks). C, Top, Schematic depiction of a dendritic segment (blue) in one EM section of thickness h, assumed to be an oblique elliptical cylinder with height λi and minor di (blue) and major diameters Di (red). Note that di also represents the diameter of the top circle. From trigonometry, λi = Di × h/di. Bottom, Due to the undulation of dendrites, each EM section (25 ± 5 per series) results in a different λi. D. The surface and length of each sampled dendritic segment was estimated from the sum of the EM sections. We calculated the membrane surface present in each EM section using the mean section thickness (h), the measured minor (di) and major (Di) diameters of the ellipse (which depend on the angle of the section cut relative to the dendrite), and the derived length (λ1…λn) of the dendrites present in each EM section. Note the resulting formula for Si depends only on the measured variable Di. All synapses present in the first and subsequent sections were counted, but those that were still present in the last section were not included. The surface density of synapses [σsurface (syn)] was obtained by dividing the number of synapses (Nsyn) by the surface area (∑Si) studied in EM. The total surface of all dendritic segments in a layer was estimated using their dimensions measured with Neurolucida after the diameters were corrected for overestimation due to diffraction (see Materials and Methods). For each layer, the total synaptic input was calculated based on the average synaptic density value of all dendrites measured in that layer.
For the estimation of dendritic surfaces for each cell, dendritic diameters were measured using the Neurolucida Explorer software. The values measured for dendrites are overestimates of the true membrane-delimited diameters due to diffraction (point spread function). Many dendritic segments had uneven diameters, and each segment was characterized by the mean diameter of all recorded points in Neurolucida. The outcome also depended on the strength of neurobiotin labeling and/or the quality of histological processing, i.e., the optical density of the end product of the DAB reaction. Dendritic segments from cells B13a and B15a, previously measured by Neurolucida Explorer, were also measured using electron microscopy. The diameters were then corrected for EM section compression during cutting (see above). The EM sampled dendritic diameters were smaller, on average, than those obtained using Neurolucida. The mean ratio was 0.86 ± 0.23 (n = 49 segments), and this factor was applied to calculate a corrected diameter (dcorr) for all Neurolucida recorded diameters (dNL): dcorr = dNL × 0.86. The surface (S) of a dendritic segment was calculated using the formula S = π × dcorr × length.
Finally, the dendritic surface in a layer was calculated by summing the calculated surfaces of all segments within the respective layer. The total dendritic surface of an interneuron was given by summing all laminar dendritic surfaces.
Measured surface density of input synapses on dendrites.
Synapse density values obtained from serial EM samples of individual dendrites (Fig. 1) layer by layer were compared among basket cells B13a (n = 18 dendrites), B15a (n = 40 dendrites), and B42c (n = 18 dendrites). Synapse density on dendrites in stratum lucidum could only be obtained for cell B42c (n = 3 dendrites), and the mean value for this cell was used for calculating the number of synapses on the dendritic segments of B15a and J31a in stratum lucidum. Synaptic densities were not different between cells in a layer by layer comparison; therefore they were pooled. The pooled synaptic mean densities were compared among layers and they were different (Kruskal–Wallis test; p = 0.0003). The post hoc Dunn test on all strata except stratum lucidum showed that dendrites in stratum lacunosum moleculare had a lower density of synapses than those in stratum oriens. Therefore, for each layer and cell we used the pooled, layer-specific mean density value to calculate the number of synapses for cells B13a, B15a, and J31a. We could not take a representative EM sample of J31a because not enough sections were processed for EM. The number of synapses received by cell B42c was not calculated due to section alignment problems.
Calculation of the surface of somata and numbers of synaptic inputs.
The Knud Thomsen approximation of a prolate ellipsoid was used for B13a, B15a, J31a, and J76b. The soma of cell J72a could not be measured. The outline of the somata was traced in the osmium-treated and resin-embedded section, using a drawing tube and a 100× oil-immersion objective. An ellipse of equal area was fitted using ImageJ. Because the major diameter of the ellipsoid was not always parallel with the sectioning plane, this method of measurement introduced some underestimation of the surface. The somata of cells B15a and J76b were in Triton-treated sections, hence the axes were expanded by 10% (see Measuring lateral tissue shrinkage of the vibratome, above), and all somatic parameters are given at the freeze-thaw-treated section scale. The somata of cells B13a, J31a, and B42a were in freeze-thaw-treated sections. Cell B42c had a radially oriented pyramidal shaped soma, which was approximated as a conical frustum, excluding from the surface of the frustum the area occupied by its major apical dendrite, but not the origin of the basal dendrites. The dimensions of this cell were measured on electron micrographs.
The parameters of the measured prolate ellipsoids were the following: B13a, minor diameter, 14.4 μm; major diameter, 21.9 μm; B15a, minor diameter, 14.6 μm; major diameter, 24.4 μm; J31a, minor diameter, 15.2 μm; major diameter, 19.5 μm; J76b, minor diameter, 15.2 μm; major diameter, 18.3 μm. Basket cell B42c had a base diameter of 16.0 μm, top diameter of 5.7 μm, and height of 16.0 μm.
EM serial sections were taken close to the largest diameters of the somata of cells B13a (21 sections), J31a (19 sections), and B42c (2 samples, 22 and 15 sections). When required, measurements were corrected for section compression by the EM sectioning (see above). Synapses were counted as for dendrites, including partially cut synapses only at one end of the series. The mean somatic synapse density of the three cells was applied to calculate total number of synapses received by the five somata.
Flat map of the hippocampus and characterizing the extent of dendritic and axonal arborizations.
The hippocampus can be considered as a two-dimensional sheet of pyramidal cells and has been displayed as a flattened surface (Swanson et al., 1978). We projected the areas occupied by the axonal and dendritic trees to reveal areas of influence of single cells and their access to inputs.
A partial flat map was constructed of the dorsal hippocampus from coronal sections immunolabeled for calbindin using an immunoperoxidase method. Calbindin distribution was used, as it is strongly expressed in CA2 pyramidal cells and mossy fibers, weakly expressed in a sublayer of CA1 pyramidal cells, and absent in CA3 pyramidal cells. We imaged 14 sections (nominal thickness, 70 μm; every other section in the series, having a total anteroposterior dimension of 1.89 mm) with a 10× objective, starting from the most anterior pole of the hippocampus. The pyramidal layer was traced on a digital image (ImageJ) from the midline to the end of CA3c in the hilus, and the borders of CA1, CA2, and CA3 were marked. We used a modified version of a custom-written Matlab script (gift from E. Henriksen and M. Witter, Kavli Institute for Systems Neuroscience, Trondheim, Norway) to plot the measured lengths, anteroposteriorly spaced by the nominal section thickness, to create a 2D map. The border of the CA1 and CA2 areas was used as a fixed reference point to line up the measured distances.
We fitted the recorded and reconstructed cells into this flat map by measuring the soma location as a distance along the pyramidal layer of the section and displaying the soma position on the flat map section that most closely corresponded to the anteroposterior level of the recorded cell. The dendritic trees of the seven three-dimensionally reconstructed cells were rotated in Neurolucida Explorer (MBF Bioscience) to obtain the minimal occupied area, as viewed radially from stratum oriens. These views were exported and scaled within the flat map. The distal tips of dendrites were connected by straight lines to represent a radial view of the area occupied by dendrites. The maximal extents of these areas in the CA1–CA3 and anteroposterior axes were used as metrics for their characterization. The axons of three cells (B13a, B15a, and J31a) were also represented on the flat map by measuring their extent in each section on the CA1–CA3 axis along the pyramidal cell layer and position relative to the CA1–CA2 boundary.
As the pyramidal layer is cut by the coronal section plane at varying angles at different mediolateral positions, depending on the curvature of the hippocampus, a section represents an anteroposterior hippocampal segment of the nominal section thickness only when cut perpendicularly to the pyramidal layer. This introduces an error, because we spaced the lines representing each section at a uniform 70 μm distance, even though larger segments of nonuniform thickness were present in the traced section of the curved CA3 area. This also applies to the axonal anteroposterior representations.
Dendritic trees were also characterized by the area of the minimal bounding rectangle in the radial view from stratum oriens perpendicular to the pyramidal layer (algorithm by J. D'Errico, adapted for the present calculations available from Matlab Central (MathWorks). Briefly, we computed the convex hull (CH) and the angles of the CH edges of the tree. Then the CH was rotated by all angles until one of them coincided with the edge of the bounding rectangle. Computing the area of the bounding rectangle for all possible edges, we accepted the minimum one.
Results
Basket cell identification
We recorded the activity of interneurons in anesthetized rats with extracellular glass electrodes. After recording the physiological activity, the recorded cells were approached by the electrode and filled with neurobiotin using the juxtacellular labeling technique. Six of the interneurons had axonal arbors concentrated in and around the stratum pyramidale (Fig. 2A) and were immunopositive for PV (Fig. 2E). All six cells were immunonegative for CB1 receptor, as tested on their axons and terminals. The cell bodies were in the pyramidal cell layers of areas CA3 (n = 4) or CA2 (n = 2; B13a, J72a). Their measured parameters are given in Table 1. The locations of cell bodies and dendritic and axonal arbors were ascertained on the basis of immunoreactions of some sections of cells B13a, B15a, and J72a for calbindin and α-actinin-2, which provide clear areal boundaries (Mercer et al., 2007). To delineate the area that the axon of a single basket cell influences in the hippocampus, we superimposed the axonal areas on a flattened view of the dorsal hippocampus (Fig. 2B). On average, a CA2/3 basket cell axon occupied an area of 0.666 ± 0.223 mm2 (n = 3), and the mediolateral and anterioposterior extents covered by the axons were 1.328 ± 0.279 and 0.920 ± 0.204 mm, respectively. The axonal distribution of PV-expressing basket cells having cell bodies in CA2 is quite variable (Mercer et al., 2007); basket cell J72a mainly innervated CA2 and to a lesser extent CA3, whereas most of the axon of cell B13a was in CA1, less in CA2, and very little in CA3.
Figure 2.
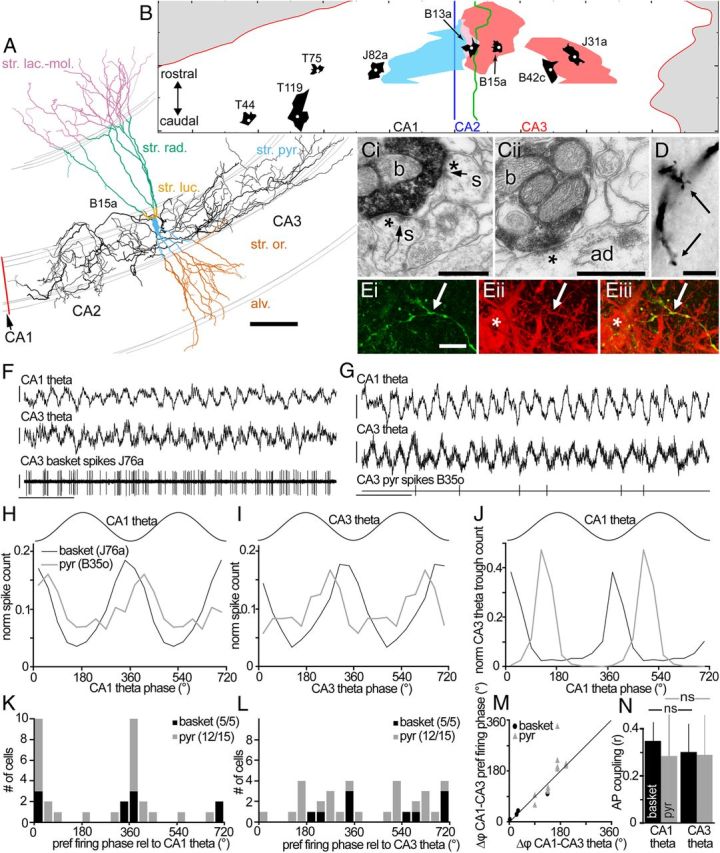
Identification of PV-expressing basket cells and comparison of their theta-related firing to that of putative pyramidal cells. A, Reconstructed basket cell (B15a) with soma in CA3a and axon innervating both CA3 and CA2; dendrites complete from nine sections, color coded by laminae; and partial axon (black), only from three sections. The reconstruction was rotated to provide a view approximately perpendicular to the laminar boundaries (axonal sections). Note the high proportion of dendritic length in stratum lacunosum moleculare and the thin stratum lucidum at this position. B, A flat map of the dorsal hippocampal pyramidal layer, with radial views of dendritic (black) and axonal (J31a, B15a, pink; B13a, blue) arbors of reconstructed basket cells (cell bodies, white dots). Basket cell B13a (soma in CA2) innervated only few CA3 pyramidal cells and had the largest part of its axon (pink) in the CA1 area. The radial view of four PV-expressing basket cells in CA1 is shown for comparison (Fig. 6). Ci, Cii, Electron micrographs of two boutons (b) of cell B15a making synapses (asterisks) with two somatic spines (Ci; s) and an apical dendritic shaft (Cii; ad). Arrows mark puncta adherentia bordering synapses. D, Light micrograph of a dendritic grapelike formation (arrows) in stratum radiatum on a dendrite of cell B15a. Ei–Eiii, Confocal microscopic images of PV immunoreactivity (cy3, red) in a neurobiotin-labeled axon collateral (Alexa 488, green) of cell J76a (arrows; SD projection of a stack of 41 optical sections; step size, 0.27 μm; total height, 10.6 μm). The terminals of this basket cell provide a small fraction of all PV-positive structures; a PV-positive interneuron soma is also seen (asterisk). F, Basket cell (J76a; bottom trace) firing is phase-locked to the trough of theta oscillations in CA1 (top trace) and CA3 (middle trace). G, A putative pyramidal cell (B35o; bottom line) also fired phase locked to both CA1 (top trace) and CA3 (middle trace) theta oscillations. Calibration: F, G: 0.5 mV, 1 s. H, I, Phase distribution histograms for spikes recorded from the cells shown in F and G. In H–J, the number of spikes (troughs) per bin were normalized to the total number of recorded spikes (troughs) for that cell. The key in H is valid for H–J; data are duplicated to show two cycles (36° per bin). J, Phase distribution histograms of CA3 theta troughs relative to theta cycles recorded in CA1. Note that for the J76a recording (black line), most CA3 theta troughs occurred in phase with CA1 theta troughs, consistent with the fact that this cell fired most on the same phase relative to CA1 (H) and CA3 (I) theta oscillations. For the B35o recording (gray line), CA3 theta troughs occurred slightly out of phase with CA1 theta; again this is consistent with this cell's different preferred phases of CA1 or CA3 theta. K, L, The preferred firing phase of cells with significantly coupled firing relative to CA1 (K) and CA3 theta (L). Numbers in parentheses indicate the number of significantly modulated cells per total number of analyzed cells per cell type. Note the homogeneous phase preferences relative to CA1 theta oscillations (K) in contrast to local theta (L). M, The differences in preferred firing phase relative to CA3 and CA1 theta oscillations roughly match the phase differences between CA1 and CA3 theta oscillations. Recordings could be used only with significant coupling of firing to both CA1 and CA3 theta, and between CA1 and CA3 theta (4 of 5 basket cell and 11 of 15 pyramidal cell recordings). A black line along the diagonal is shown for reference. N, The coupling of spikes from basket (black) and putative pyramidal (gray) cells to CA1 theta was not significantly different from their coupling to CA3 theta (exact paired Wilcoxon signed ranks tests, basket, p = 0.44, n = 5; pyr, p = 0.68, n = 15). ns, Not significant. Scale bars: A, 100 μm; B, long markers, 1 mm; C, 0.5 μm; D, E, 10 μm.
Table 1.
Quantitative analysis of CA2/3 PV-expressing basket cells
| Measurementsa | PV-expressing basket cells |
||||||
|---|---|---|---|---|---|---|---|
| B13a, CA2 | J72a, CA2 | B15a, CA3a | J76b, CA3a | B42c, CA3b | J31a, CA3c | Total | |
| Theta oscillation analysis | ✓ | ✓ | ✓ | ✓ | ✓ | 5 | |
| Gamma oscillation analysis | ✓ | ✓ | ✓ | ✓ | ✓ | ✓ | 6 |
| Sharp wave/ripple analysis | ✓ | ✓ | ✓ | ✓ | ✓ | ✓ | 6 |
| Flat-map of dendritic area | ✓ | ✓ | ✓ | ✓ | 4 | ||
| Flat-map of axonal area | ✓ | ✓ | ✓ | 3 | |||
| 3D dendritic measurements | ✓ | ✓ | ✓ | ✓ | 4 | ||
| Dendritic length per layer | ✓ | ✓ | ✓ | ✓ | 4 | ||
| Dendritic synaptic input measured (EM) | ✓ | ✓ | ✓ | 3 | |||
| Dendritic surface area per layer calculated | ✓ | ✓ | ✓ | 3 | |||
| str. lucidum input sample (EM) | ✓ | 1 | |||||
| Total synaptic input calculated | ✓ | ✓ | ✓ | 3 | |||
| Axonal synaptic targets (EM) | ✓ | ✓ | ✓ | 3 | |||
| Soma surface estimate | ✓ | ✓ | ✓ | ✓ | ✓ | 5 | |
| Soma synaptic input measured (EM) | ✓ | ✓ | 2 | ||||
a Due to absence of theta oscillations, tissue processing errors, suboptimal tissue preservation and/or incomplete labeling not all measurements could be performed on all cells.
To determine the area from which the cell collects inputs, we have reconstructed the dendritic trees of four basket cells in CA2/3 and rotated them to display the area occupied by each dendritic tree in a view perpendicular to the sheet of the pyramidal cell bodies. On average, a CA2/3 basket cell dendritic arbor, as viewed perpendicular to the layers, fitted into a minimal area bounding rectangle of 0.153 ± 0.056 mm2. The mediolateral and anteroposterior extents were 0.413 ± 0.109 and 0.593 ± 0.276 mm, respectively. This was similar (p > 0.1; Mann–Whitney test) to values obtained for four PV-expressing basket cells in the CA1 area, which were reported previously (Klausberger et al., 2003) and newly reconstructed here (Figs. 2B, 6). The latter had a minimal bounding rectangle dendritic arbor area of 0.227 ± 0.215 mm2, and mediolateral and anteroposterior extents of 0.413 ± 0.080 and 0.512 ± 0.366 mm, respectively (Fig. 2B). Because all six basket cells in CA2/3 innervated CA3 pyramidal cells (B13a to a small extent) and no obvious differences were recognized in the parameters of basket cells in the CA2 and CA3 areas, all data were pooled for convenience.
Figure 6.

Differences in the dendritic trees of PV-expressing basket cells in the CA2/3 and CA1 areas. A, Approximate somatic positions of the four reconstructed CA1 and the six recorded CA3 basket cells. The cells were distributed over ∼2.5 mm in the anteroposterior direction of the dorsal hippocampus, but their positions are collapsed here onto one plane. B, The dendritic trees of basket cells (color coded by laminae) greatly expand in st. lacunosum moleculare of the CA2/3 areas. C, Only a small proportion of the total dendritic trees of basket cells in the CA1 area is in str. lacunosum moleculare, and the dendritic length in this layer appears to increase from medial to lateral. Graphs on the right show that the dendritic length of basket cells was significantly longer (*p = 0.026; Mann–Whitney U test) in str. lacunosum moleculare of the CA2/3 than of the CA1 area. Scale bars: A, 0.5 mm; B, C, 100 μm.
An electron microscopic random sample of axonal synaptic targets (n = 12 targets for each cell; Fig. 2D) of three basket cells (B15a, B42c, and J31a) showed that they innervated the somata (64 ± 17%), including five somatic spines (Fig. 2Ci), and dendritic shafts (33 ± 14%) of pyramidal cells, and rarely innervated interneurons (n = 1; B42c). The dendritic shafts of basket cells had very few spines in general, except in the deep stratum oriens and alveus, where they could have a variable density of spines. Some of the cells (B15a and J31a) had up to five large complex grapelike appendages on their dendrites in stratum radiatum ending into numerous spines (Fig. 2D) and receiving type 1 synapses as tested by electron microscopy (data not shown). These complex appendages resembled the dendritic thorny excrescences of CA3 pyramidal cells innervated by mossy terminals, but in the case of these basket cells, they were always outside stratum lucidum. To our knowledge, they have not been described previously and may provide a structure for grouped and related glutamatergic inputs.
To understand the role of CA2/3 basket cells in the hippocampal network, we analyzed their spike timing relative to oscillations of the local field potential in areas CA2/3 and CA1 and also relative to the spike timing of putative pyramidal cells in CA3 (n = 15), which were recorded in separate experiments with tetrodes and have been reported previously (Lasztóczi et al., 2011).
Spike timing of CA2/3 PV-expressing basket cells during theta oscillations
In the description of the physiological results, for simplicity we refer to recordings in the CA2 and CA3 areas collectively as CA3, as no obvious differences were seen between the recorded cells. Theta oscillations occurred spontaneously (five of six recordings, with the exception of B42c), both in CA1 stratum pyramidale and at the cell recording site in CA2/3 (Fig. 2F,G). Although there was considerable overlap between theta epochs in CA1 and CA3, periods of theta only in CA3 or only in CA1 were also present. Field theta oscillations in CA3 were qualitatively different than in CA1, perhaps due to the curved shape of the CA3 region compared to CA1. However, the mean oscillation frequency per recording was the same in both areas [median (n = 5) for CA1, 4.0 Hz; for CA3, 4.0Hz; W test, p = 1.0], as was the mean peak-to-trough amplitude per recording [median (n = 5) for CA1, 0.40 mV; for CA3, 0.34 mV; W test, p = 1.0].
All five analyzed PV-expressing basket cells fired strongly phase locked to theta oscillations, regardless of whether the LFP was recorded in CA1 SP or in CA3 (Fig. 2). Relative to CA1-recorded theta oscillations, the firing patterns were remarkably homogeneous (Fig. 2K), with preferred firing phases ranging from 351 to 13° (where 0 and 360° indicate the troughs) and the length of the normalized vector sum, a measure of AP coupling strength, ranging from 0.28 to 0.47. In contrast, the spike timing relative to CA3 theta oscillations recorded locally at the cell soma site was more diverse, as only three of five cells fired roughly on the trough (Fig. 2L). It should be noted that, because of the curved shape of CA3, the field potential here is expected to be less spatially uniform than in the relatively flat CA1, which we used as reference across experiments. The firing phase of basket cells relative to CA3 theta LFP is expected to vary according to the phase difference of theta between CA1 and CA3. Indeed, we found that the phase relationship between theta oscillations in CA1 and CA3 was identical to the difference between a cell's preferred CA3 theta phase and its preferred CA1 theta phase (Fig. 2M). This suggests that although the phase relationship may vary depending on the precise recording location, CA1 and CA3 theta are not independent, consistent with previous reports.
Basket cell firing was not more related to local CA3 theta than to CA1 theta (Fig. 2N). If one assumes that the strength of AP coupling to the field is indicative of the contribution of a cell to the field, then it would seem that both CA1 and CA3 theta oscillations are equally determined by PV-expressing basket cells. Given that the influence of these cells on CA1 must be via CA3 pyramidal cells, this would suggest that CA1 pyramidal cell firing is strongly determined by CA3 pyramidal cells. Alternatively, both areas might be synchronized by a common input from the medial septum or entorhinal cortex.
Because we recorded the timing of CA2/3 PV-expressing basket cells relative to a second reference in CA1, we can compare their spike timing to previously reported basket cells in CA1 (Klausberger et al., 2003) relative to the same “clock.” CA3 PV-expressing basket cells as a population fired 81° later than PV-expressing basket cells recorded downstream in area CA1. Despite the very small samples (n = 5 for each group), a permutation test indicated that this difference was highly significant (p = 0.0079). At the slow timescales of theta cycles (4.0 Hz), the observed 81° shift corresponds to 56 ms. Although reported phase preferences for pyramidal cells in CA3 differ (Fox et al., 1986; Dragoi and Buzsáki, 2006), our results suggest a substantial difference between CA1 and CA3 in the relative spike timing of PV-expressing basket and putative pyramidal cells.
We observed that 12 of 15 physiologically identified putative pyramidal cells discharged action potentials significantly phase locked to theta oscillations in CA1 and CA3. Significantly theta-modulated putative CA3 pyramidal cells fired homogeneously around the trough of CA1 theta (Fig. 2K) but at different phases of CA3 theta (Fig. 2L), similar to the CA3 PV-expressing basket cells. Once again, for each cell, the difference between the preferred theta phase of spikes relative to CA1 and CA3 was roughly identical to the phase difference between CA1 and CA3 theta oscillations (Fig. 2M). Furthermore, the putative pyramidal cells were not more phase locked to the local field theta oscillations than to the CA1 theta (Fig. 2N), suggesting a strong effect on CA1 theta oscillations consistent with previous reports (Buzsáki et al., 1986; Fox et al., 1986; Brankack et al., 1993). When one considers the spike timing of putative pyramidal cells relative to PV-expressing basket cells, using CA1 as a reference (Fig. 2K), both cell types fire at the same phase in CA3. This may reflect the powerful, converging recurrent collateral input that PV-expressing basket cells in CA3 receive from pyramidal cells (Miles, 1990).
Spike timing of CA2/3 PV-expressing basket cells during gamma oscillations
In all examined recordings from CA3 PV-expressing basket cells, the LFPs in stratum pyramidale in both CA3 and CA1 were found to oscillate in the gamma frequency band (30–80 Hz). In CA1, significant (see Materials and Methods) gamma oscillations were detected during 34 ± 3% (mean ± SD) of the recorded time (duration, 264–2723 s; median, 950 s). The same percentage was found for CA3 recordings (34 ± 2%). In CA1, all recordings showed very similar average gamma cycle length (24.4 ± 0.6 ms; n = 6 recordings), corresponding to 41 ± 1 Hz. In single recordings (n = 3609–42001 gamma cycles), the standard deviations ranged from 6.8 to 8.5 Hz (median, 7.3 Hz). In CA3, the average lengths of gamma cycles were slightly shorter (22.3 ± 1.0 ms; W test, p = 0.03), corresponding to faster oscillations (45 ± 2 Hz) per recording (n = 3538–44260 cycles). The CA3 gamma oscillation frequency seemed to show a higher variability (SD range, 7.8–10.5 Hz; median, 9.1 Hz) than CA1 gamma. The amplitude of CA3 gamma cycles (0.26 ± 0.09 mV; n = 6 recordings) also appeared greater than for CA1 gamma (0.17 ± 0.03 mV; n = 6 recordings; W test, p = 0.09). During the selected CA1 gamma cycles, the average CA3 PV-expressing basket cell firing rate was 21 ± 7 Hz (n = 6), not different from the overall firing rate of these cells at 21 ± 8 Hz. The presence of gamma oscillations in CA3 also showed no effect on the firing rates (22 ± 9 Hz during gamma vs 20 ± 7 Hz) of these cells overall.
Although the firing rates of basket cells were not affected by the presence of gamma oscillations, their spike timing was clearly related to both CA1 and CA3 gamma oscillations (Fig. 3). For all recorded cells, the extent of phase-locked firing was evaluated by testing the uniformity of the distributions of action potentials relative to the phase of the gamma oscillation (Rayleigh test). By this measure, relative to gamma oscillations in both regions, a significant correlation was found for the firing of all six PV-expressing basket cells (p < 0.0005) and almost all putative pyramidal cells (relative to CA1 gamma, 13 of 15, p < 0.05; 9 of 15, p < 0.01; relative to CA3 gamma, 14 of 15, p < 0.05; 12 of 15, p < 0.01). When CA1 gamma is used as a reference, five of the six recorded PV-expressing basket cells preferentially fired around the troughs (mean phase values, 306–63°). The phase preferences of putative pyramidal cells were less uniform, but were still restricted to the peak and descending phase (range, 133–318°), i.e., earlier than the basket cells (Fig. 3F). Relative to CA3 gamma, all cells with significantly modulated firing patterns fired preferentially on the ascending phase of the CA3 gamma oscillations (Fig. 3G). However, we cannot exclude that some of the spikes and their afterhyperpolarization might influence the spike coupling to the oscillations detected locally in the CA3. Again, putative pyramidal cells appeared to fire earlier than PV-expressing basket cells, which would suggest that they are providing excitatory drive to the PV-expressing basket cells consistent with previous data (MacVicar and Dudek, 1980; Miles and Wong, 1984; Csicsvari et al., 2003; Mann et al., 2005).
Figure 3.

Firing of CA3 PV-expressing basket and putative pyramidal cells is phase locked to field gamma oscillations, both recorded locally in CA3 and downstream in area CA1. A, Basket cell J31a fired preferentially (bottom trace) at the trough of gamma oscillations in CA1 SP (top trace) and at the peak of CA3 gamma (middle trace). For this recording, CA1 SP gamma was approximated by reversal of gamma recorded from CA1 SR (see Materials and Methods). In both A and B, gray vertical lines indicate spike times. B, A putative pyramidal cell (B36o; bottom line) also fired phase locked to both CA1 (top trace) and CA3 (middle trace) gamma oscillations. Calibrations: 0.2 mV, 50 ms. C, D, Phase distribution histograms of normalized spike counts from the cells shown in A and B. The key in C is valid for C–E. E, CA3 gamma troughs were phase locked to those in CA1. For this recording (black line), most CA3 gamma troughs occurred 212° out of phase with CA1 gamma troughs, consistent with the fact that this cell tended to fire on the troughs of CA1 (C), but on the peaks of CA3 gamma oscillations (D; relative phase difference, 249°). Similarly, for the putative pyramidal cell recording (gray line), the fact that CA3 gamma troughs mostly occurred out of phase with CA1 gamma troughs is consistent with the different phase preferences of this cell's firing relative to gamma in CA1 (C) and CA3 (D). F, G, The preferred firing phase of cells with significantly coupled firing relative to CA1 (F) and CA3 gamma (G; in some cases selected periods to avoid spike artifacts). Numbers in parentheses indicate the number of significantly modulated cells per total number of analyzed cells per cell type. Note the homogeneous phase preferences relative to local gamma oscillations (G) in contrast to CA1 gamma (F). H, The differences in preferred firing phase relative to CA3 and CA1 gamma oscillations roughly match the phase differences between CA1 and CA3 gamma oscillations. Recordings were only used when there was significant coupling of firing to both CA1 and CA3 gamma, and between CA1 and CA3 gamma, and spike artifact did not influence the result in CA3 (5 of 6 basket cells and 12 of 15 pyramidal cells). A black line along the diagonal is for reference. I, The coupling of spikes from basket (black) and putative pyramidal (gray) cells to CA1 gamma was significantly different from their coupling to CA3 gamma (exact paired Wilcoxon signed ranks tests, *, basket, p = 0.031, n = 6; pyr, p = 0.015, n = 15). Error bars indicate SD. J, K, Mean phase angle spectra (J; only significant values are plotted) and mean vector length (K; gray, all values; black, significant values at p < 0.05; Rayleigh test) of CA3 basket cell spikes during periods of theta oscillations, relative to the LFP recorded by the local electrode in CA3.
A frequency-dependent analysis of spike coupling to gamma oscillations (Lasztóczi et al., 2011) largely confirmed the above results (Fig. 3J,K). We found that CA2/3 PV-expressing basket cells were significantly coupled to local gamma oscillations across most of the gamma frequency spectrum (>30 Hz; Fig. 3K). Furthermore, similarly to CA3 putative pyramidal cells (Lasztóczi et al., 2011), CA3 basket cells showed a forward shift in their preferred phase from high to low frequencies. The PV-expressing basket cells fired on the early and late ascending phase of CA3 gamma oscillations at ∼80 and ∼30 Hz, respectively (Fig. 3J). Consequently, across the whole spectrum, the basket cells follow the putative pyramidal cells by ∼30–40°. The latter fire on the trough and mid-ascending phase of CA3 gamma oscillations at ∼80 and ∼30 Hz, respectively (Lasztóczi et al., 2011).
The correlation between spike timing of cells in CA3 and the gamma oscillations in CA1 suggests that gamma in CA1 is not independent of CA3 gamma, supporting previous reports that both could be driven from a single source in CA3 (Fisahn et al., 1998; Csicsvari et al., 2003) in a brain state-dependent (Montgomery et al., 2008) and task-dependent (Montgomery and Buzsáki, 2007) manner. Consistent with this, both PV-expressing basket and putative pyramidal cells showed significantly stronger correlation to local CA3 than to CA1 gamma oscillations (Fig. 3I). A direct comparison of gamma oscillations in these two areas was made by comparing the timing of troughs in the gamma-filtered CA3 LFP to CA1 gamma oscillations (Fig. 3E), showing a significant correlation (Rayleigh test; p ≪ 0.01) for all six analyzed recordings. In fact, the phase differences between CA3 and CA1 gamma are very similar to the differences in the CA3 cell phase preferences relative to CA1 and CA3 gamma (Fig. 3H). This analysis amounts to using the CA3 cell spikes as a common reference to compare CA3 and CA1 gamma oscillations, confirming that these oscillations are correlated.
Spike timing of CA2/3 PV-expressing basket cells during sharp wave-associated ripples
Ripple oscillations detected in CA3 were significantly smaller (Mann–Whitney U test; p < 0.001) than ripples in CA1 (mean ± SD, CA1, 0.05 ± 0.03 mV, n = 8051 troughs; CA3, 0.03 ± 0.03 mV, n = 8452 troughs) and had lower frequency (p < 0.001; CA1, 107 ± 14 Hz, n = 688 ripples; CA3, 97 ± 13 Hz, n = 285 ripples). During sharp wave-associated ripple events (SWRs) detected in the CA1 area, all six CA3 PV-expressing basket cells showed a substantial increase of firing rate during ripple episodes (Fig. 4). The firing rate of basket cells during “participating” episodes (225 of 281 episodes) increased to 49–83 Hz (median, 63 Hz) from an average rate of 11–32 Hz (median, 19 Hz) overall. In fact, five of six cells fired on virtually every episode; only one cell (J76b) fired on a minority of episodes (21 of 70). Interestingly, CA3 PV-expressing basket cells start firing slightly before ripple onset; this is unlike CA1 basket cells recorded under similar circumstances with the same criteria for ripple detection (Klausberger et al., 2003), and may reflect a role for these cells in the entrainment of CA3 pyramidal cells that trigger ripples downstream in CA1 (Buzsáki, 1986; Csicsvari et al., 2000).
Figure 4.

A–D, Basket cells (A, C) and putative pyramidal cells (B, D) in area CA3 increase their firing rates during sharp-wave ripple episodes detected in area CA1. A, A basket cell (J72a; bottom trace) increases its firing rate before and during ripple episodes (top trace; ripple, filtered, 90–140 Hz) detected from the local field potential in CA1 (middle trace, filtered, 0.3–300 Hz). Calibrations: Vertical, top, 0.1 mV; middle, 1 mV; bottom, 0.3 mV; horizontal, 100 ms. B, A putative pyramidal cell (B42p) identified from a tetrode recording (bottom line) increased its firing rate during ripple episodes (top trace, ripple, filtered, 90–140 Hz) detected from the local field potential in area CA1 (middle trace, filtered, 0.3–300 Hz). Calibration is as in A. C, All identified PV-expressing basket cells (n = 6, gray lines) in area CA3 increased their firing rate during CA1 ripple episodes. Note that firing rate increase commences before ripple episode onset in CA1 (black line; average). Time is normalized separately before and after ripple episode peak (t = 0; vertical line), and ripple episode onset and end are marked by dashed vertical lines. Spike count is normalized per cell. D, Putative pyramidal cells (n = 15; gray lines) in area CA3 increased their firing rate during CA1 ripple episodes (black line; average). Time and spike count are normalized as above.
Nine of 15 putative pyramidal cells fired >10 spikes during recorded sharp waves and were analyzed further. During the active episodes (220 of 481) of these nine cells, they increased their firing rate from 0.7 to 3.5 Hz (medians; Fig. 4D). The selective increase in activity during CA1 SWRs suggests that CA3 pyramidal cells could contribute to the triggering of these episodes, as expected based on previous reports (Csicsvari et al., 2000; Sullivan et al., 2011).
During fast ripple oscillations that occurred during sharp waves, none of the six CA3 basket cells fired correlated to the ripple cycles detected in CA1 (Fig. 5). This is in marked contrast to the results for the much slower theta oscillations, suggesting that the CA3–CA1 network processes activity patterns differently at different frequencies. When the spike timing of PV-expressing basket cells was examined relative to local ripple oscillations in CA3 recorded during the same episodes, five of six cells showed spike discharges significantly phase locked to the locally recorded ripples, with preferred firing phases widely distributed around the ripple troughs (Fig. 5A,C). A similar analysis of the tetrode-recorded putative pyramidal cell firing relative to CA3 and CA1 ripples detected during CA1 SWRs showed that only one of nine sufficiently active putative pyramidal cells fired spikes phase locked to CA3 ripples, and none fired phase locked to CA1 ripples (Fig. 5B,C). We also tested the discharge pattern of all recorded putative pyramidal cells as a population, revealing a significant phase locking to the early ascending phase of CA3 ripples but not to CA1 ripples (Fig. 5D). When all recorded PV-expressing basket cells were considered as a population, they also fired APs in a significantly phase-locked manner around the trough of CA3 ripples, but not related to CA1 ripples (Fig. 5D). However, we cannot exclude that some of the spikes and their afterhyperpolarization might influence the spike coupling to the oscillations detected locally in the CA3. Overall, CA3 basket and putative pyramidal cells were significantly less phase related to CA1 than to CA3 ripples (Fig. 5E).
Figure 5.
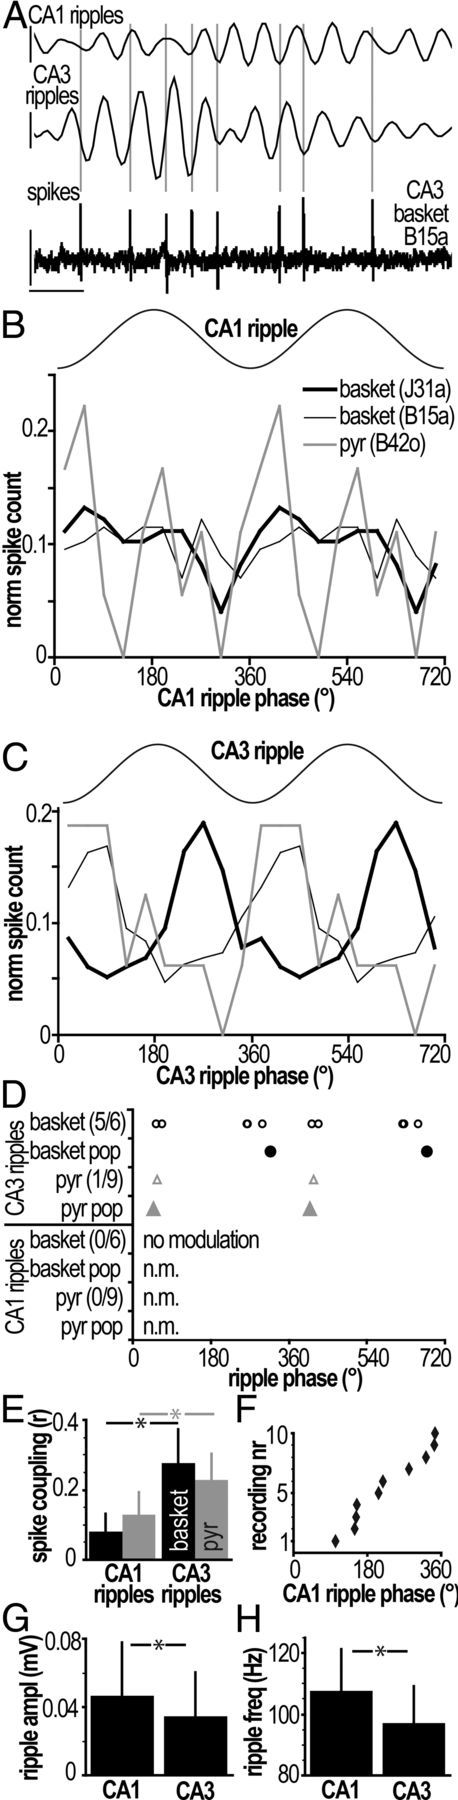
During fast ripple oscillations detected in area CA1, PV-expressing basket cells and putative pyramidal cells in CA3 fire weakly phase-locked to local CA3 but not CA1 ripple cycles. A, An example PV-expressing basket cell (B15a) discharges spikes (bottom trace) phase-locked to local CA3 ripples (middle trace) but not to ripples detected in CA1 (top trace). Gray vertical lines indicate spike times. Calibration: Vertical, top, middle, 0.1 mV; bottom, 0.3 mV; horizontal, 10 ms. B, C, Phase distribution histograms for spikes from two PV-basket cells and one putative pyramidal cell. Note that firing was not coupled to any particular phase of CA1 ripples (B), whereas the cells' firing was coupled to locally detected (CA3) ripples (C). The key in B is valid for C (normalized spike counts). D, Firing phase of cells with significantly coupled firing relative to ripples detected in CA1 [bottom 4 lines; no modulation (n.m.)] and CA3 (top 4 lines). None of the individual cells showed coupling to CA1 ripples. Note that the third circle from left in the top row represents two basket cells. Population (pop) phase preferences were computed as the direction of the summed vector of all spikes per cell type. As a population, putative pyramidal cells were significantly coupled to CA3 ascending ripple phase; neither cell type population showed coupling to CA1 ripple cycles. Numbers in parentheses indicate the number of significantly modulated cells per total number of analyzed cells per cell type. E, Both basket (black bars) and pyramid cells (gray bars) were significantly more coupled to local CA3 ripples than to ripples detected in CA1 (exact paired Wilcoxon signed ranks tests, *, basket, p = 0.031, n = 6; pyr, p = 0.008, n = 9). F, Ten recordings showed significant coupling of CA3 ripple troughs to CA1 ripples [Rayleigh test, p < 0.02 for 5 of 6 juxtacellular (basket) recordings; p < 0.001 for 5 of 5 tetrode (pyr) recordings]. G, H, Ripple oscillations detected in CA3 were significantly smaller than ripples in CA1 (absolute size of troughs; Mann–Whitney U test, *, p < 0.001). Error bars indicate SD.
These results indicate that although PV-expressing basket cells may be involved in the generation of local ripples in CA3, probably through their influence on somatic membrane currents and thus pyramidal cell firing, this signal does not influence the downstream CA1 network to an extent that would be detectable. Despite the lack of phase coupling of the recorded PV-expressing basket cells, either alone or as a population, to the CA1 ripple network activity (Fig. 5D), an analysis directly comparing CA3 and CA1 ripple trough times during SWR episodes showed that the network activity in these two areas was significantly correlated for 10 of 11 recordings (Fig. 5F). This result is in apparent contradiction with the finding that CA3 basket cells are phase locked to CA3 but not to CA1 ripples.
Ripples in CA3 and CA1 are thought to be generated independently, which could explain the coupling of CA3 cells to CA3 ripples and the lack of phase coupling to CA1 ripples. Indeed, the relative amplitude of the same ripple event was highly variable between the two regions. The correlation between ripples in CA1 and CA3 could be due to field interactions. In particular, the observation that both the amplitude and the frequency of ripples in CA1 are increased relative to CA3 ripples (Fig. 5G,H) suggests that ripples generated in CA1 could influence the LFP recorded in CA3. Furthermore, compared to lower frequencies, the LFP at ripple frequencies reflects less postsynaptic currents and more local AP firing, possibly explaining the local nature of phase-locked firing (Schomburg et al., 2012). The degree of coupling between ripples in CA1 and CA3 could reflect relatively small ensembles of highly active pyramidal cells, or possibly subthreshold influences on the network.
Dendritic arborization and number of synaptic inputs to PV-expressing basket cells
Many differences in intrinsic properties and synaptic connections could contribute to the observed differences in spike timing between CA1 and CA2/3 PV-expressing basket cells. The laminar distribution and shape of the dendritic tree may be one predictor of different electrical behavior, but until now the complete dendritic arborization of CA3 basket cells has not been revealed. Mercer et al. (2007, 2012) described two populations of PV-expressing basket cells with narrow and wide dendritic fields in stratum oriens of CA2, but they did not measure the laminar distribution of the dendrites or noted differences compared to CA1. Both of the basket cells recorded in CA2 would fall into their wide arbor category. To analyze the laminar distribution of dendrites, we reconstructed the complete dendritic arborizations of basket cells labeled in the CA1 and CA2/3 areas to relate dendritic distribution to the known layer specificity of afferent inputs (Fig. 6). The results suggested one hitherto unappreciated difference between basket cells in the CA1 and CA2/3 areas. We observed that dendrites of CA2/3 PV-expressing basket cells strongly expanded in str. lacunosum moleculare, in contrast to CA1 basket cells (Fig. 6; Table 2). The total dendritic lengths [n = 4 cells each area; CA1 coefficient of variation (CV), 0.15; CA2/3 CV, 0.11] appeared 16% longer on average in the CA2/3 areas, but they were not significantly different in these samples (p = 0.097, t test). The proportion of dendritic lengths in stratum lacunosum moleculare was significantly larger in the CA2/3 areas (Fig. 6; p < 0.05, t test). There was no difference in the other layers (p > 0.05). Another type of basket cell in CA3 that expresses CCK also has dendrites in stratum lacunosum moleculare, but these appear to branch less and represent a smaller proportion of the total dendritic tree than those of PV-expressing basket cells (Lasztóczi et al., 2011).
Table 2.
Dendritic lengths per layer and total dendritic lengths of individual reconstructed PV-expressing basket cells in micrometers
| Area |
CA1 |
CA2 |
CA3 |
CA2/3 |
||||||
|---|---|---|---|---|---|---|---|---|---|---|
| Cell ID | T44 | T75 | T119a | J82a | mean ± SD | B13a | B15a | J31a | B42c | mean ± SD |
| Layer | ||||||||||
| slm | 108 (2) | 979 (15) | 287 (3) | 758 (9) | 533 ± 405 (7) | 3337 (33) | 3894 (42) | 3311 (36) | 1559 (20) | 3025 ± 1014 (33) |
| sr | 3649 (55) | 3310 (50) | 2210 (26) | 4635 (54) | 3451 ± 1001 (46) | 3287 (33) | 1625 (18) | 2646 (29) | 2056 (27) | 2403 ± 723 (27) |
| sl | NA | NA | NA | NA | NA | NA | 131 (1) | 390 (4) | 104 (1) | 208 ± 158 (2) |
| sp | 392 (6) | 1069 (16) | 281 (3) | 283 (3) | 506 ± 379 (7) | 1232 (12) | 368 (4) | 584 (6) | 469 (6) | 663 ± 390 (7) |
| so/alv | 2441 (37) | 1261 (19) | 5774 (68) | 2830 (33) | 3076 ± 1918 (41) | 2180 (22) | 3195 (35) | 2287 (25) | 3475 (45) | 2784 ± 647 (31) |
| Total | 6589 | 6619 | 8551 | 8507 | 7566 ± 1112 | 10,037 | 9213 | 9218 | 7662 | 9032 ± 992 |
slm, str. lacunosum moleculare; sr, str. radiatum; sl, str. lucidum; sp, str. pyramidale; so/alv, str. oriens/alveus. Values in parentheses are percentages.
We have also calculated the total dendritic surface in each of the layers in the CA2/3 areas to estimate the number of synapses received by basket cells (Table 3). The estimates are based on electron microscopic samples of 76 dendritic segments (n = 3 basket cells) and a total of 1506 synapses counted. It is noteworthy that out of a mean dendritic membrane surface of 22,437 ± 2281 μm2, on average, 29% of the dendritic surface is in stratum lacunosum moleculare, compared to the 36% in stratum radiatum. Our shrinkage-corrected estimate of dendritic surface is higher than that of PV-expressing basket cells in the dentate gyrus (Nörenberg et al., 2010). Dendritic length correlates with the number of synapses received, but the latter strongly depends on the diameter of dendrites and the synaptic density in each layer, which were different. Pooled mean dendritic synapse densities per unit area (in square micrometers) measured on basket cells B13a, B15a and B42c were 1.36 ± 0.2 (n = 19, sampled dendrites) in st. lacunosum moleculare, 1.73 ± 0.4 (n = 18) in st. radiatum, 1.08 ± 0.4 (n = 3) in st. lucidum, 1.6 ± 0.5 (n = 12) in st. pyramidale, and 1.91 ± 0.4 (n = 24) in st. oriens/alveus. Synaptic densities were not significantly different between cells in any of the layers, but synaptic density pooled across cells was lower in stratum lacunosum moleculare by 22% than the mean density in the other layers (p < 0.05; Mann–Whitney test) and 22% higher in stratum oriens (Table 3). The estimated total number of synapses received by CA2/3 basket cells was 34,810 ± 2576 (n = 3). Although we were not able to differentiate glutamatergic and GABAergic synapses, the data show that CA2/3 PV-expressing basket cells receive, on average, 24% of their synapses in stratum lacunosum moleculare. Because this layer is densely innervated by layer 2 of the entorhinal cortex, this observation suggests that CA2/3 basket cells are more strongly influenced by the entorhinal cortex than basket cells in the CA1 area, where only 7% of dendritic length was in stratum lacunosum moleculare (Table 2). Based on measurement from one basket cell (B42c) and dendritic lengths in stratum lucidum, the estimated proportion of mossy fiber synapses in the total input was ∼4% (Table 3).
Table 3.
Dendritic surface areas in square micrometers (%) and derived number of input synapses (%) for individual PV-expressing basket cells in different layers of the CA2/3 areas
| Area | CA2 | CA3 | CA3 | CA2/3 Mean ± SD |
|---|---|---|---|---|
| Cell ID | B13a | B15a | J31a | |
| Dendritic surface area per layera | ||||
| Layer | ||||
| slm | 5944 (28) | 6571 (31) | 7133 (28) | 6549 ± 595 (29) |
| sr | 9217 (44) | 6504 (31) | 9291 (37) | 8337 ± 1588 (36) |
| sl | NA | 875 (4) | 2142 (9) | 1509 ± 896 (7) |
| sp | 3054 (15) | 1347 (6) | 1805 (7) | 2069 ± 884 (9) |
| so/alv | 2836 (13) | 5895 (28) | 4698 (19) | 4476 ± 1542 (20) |
| Total dendritic surface area | 21,050 | 21,191 | 25,070 | 22,437 ± 2281 (100) |
| Number of dendritic synapsesb | ||||
| Layer | ||||
| slm | 7590 (23) | 8600 (26) | 8907 (24) | 8366 ± 689 (24) |
| sr | 14,759 (45) | 10,681 (32) | 14,939 (40) | 13,460 ± 2408 (38) |
| slc | NA | 888 (3) | 2160 (6) | 1,524 ± 899 (4) |
| sp | 4589 (14) | 2,037 (6) | 2679 (7) | 3103 ± 1328 (9) |
| so/alv | 5284 (16) | 10,507 (31) | 8,277 (22) | 8023 ± 2621 (23) |
| Number of synapses on soma | 819 (2) | 911 (3) | 803 (2) | 844 ± 58 (2) |
| Total number of synapses per basket cell | 33,041 | 33,624 | 37,766 | 34,810 ± 2576 (100) |
a Calculated for fixed unprocessed brains.
b Calculated from EM processed sections. We used the following pooled mean dendritic synapse densities (number per square micrometer) measured from basket cells B13a, B15a, and B42c: st. lacunosum moleculare (slm), 1.36 ± 0.2 (n = 24); st. radiatum (sr), 1.73 ± 0.4 (n = 18); st. lucidum (sl), 1.08 ± 0.4 (n = 3); st. pyramidale (sp), 1.6 ± 0.5 (n = 9); st. oriens/alveus (so/alv), 1.91 ± 0.4 (n = 24); soma, 0.924 (n = 2). Note that dimensions in sections processed for EM are smaller than fixed nonprocessed tissue due to shrinkage. The same numbers of synapses apply also to unprocessed brain, thus dividing the surface values above with the number of synapses results in lower densities.
c Calculated from data measured only on three dendrites of basket cell B42c.
We could not measure total cell dendritic surface of PV-expressing basket cells in the CA1 area due to the variability of labeling quality, which influences dendritic diameter estimates by Neurolucida. Hence, the total number of input synapses was not calculated, but there is an estimate for PV-expressing neurons (Gulyás et al., 1999) using a different method. Assuming that the PV-positive cells reported by Gulyás et al. (1999) were basket cells in the CA1 area, and that the two methods are similarly reliable, the comparison of the two data sets predicts that CA2/3 PV-expressing basket cells receive 53% more synapses, on average, than CA1 basket cells.
In addition to synapses received by the cells on dendrites, we also estimated the synapses received on the soma (Table 3; 3 cells shown). The average soma surface was 870 ± 77 μm2 (n = 5; B13a, B15a, J31a, B42c, and J76a). Electron microscopic samples of the somatic surface of basket cells B13a and B42c resulted in a mean synaptic density of 0.924 synapses per square micrometer (B13a, 1.268; B42c, 0.941). Applying the mean density to the calculated somatic surface of the above five cells, the average basket cell in CA2/3 receives 804 ± 71 (n = 5) synapses on its soma.
Discussion
We have defined the previously unknown in vivo firing patterns of PV-expressing basket cells in CA3 in relation to three network oscillations and found that basket cells fire phase locked to theta, gamma, and local ripple oscillations. We are unaware of data on identified CA3 basket cell firing without anesthesia. In CA1, PV-expressing basket cells fired with a similar pattern during theta and ripple oscillations, with (Ylinen et al., 1995a,b) or without anesthesia (Lapray et al., 2012), but anesthesia greatly reduced firing rates, which could also apply to the rates in CA3. Evaluation of the complete dendritic trees in CA3 resulted in an estimated total ∼35,000 synaptic inputs per cell, the highest reported so far for any cortical interneuron. In addition to entorhinal, CA3 pyramidal and mossy fiber inputs, cholinergic (Frotscher and Leranth, 1985; Gulyás et al., 2010) and GABAergic inputs (Freund and Antal, 1988; Hangya et al., 2009) from the medial septum and from local CA3 interneurons shape their firing patterns. Cell types specifically innervating PV-expressing basket cells and their firing patterns are key unknowns in understanding the temporal organization of the hippocampus. Three main glutamatergic inputs impact on CA3 PV-expressing basket cells in the CA3 area.
Mossy fiber input
Our results indicate that <4% of synapses to PV-expressing basket cells originate from dentate granule cells. This input activates some interneurons, driving feedforward inhibition of pyramidal cells (Buzsáki, 1984; Frotscher, 1985, 1989; Miles, 1990; Acsady et al., 1998; Szabadics and Soltesz, 2009). The majority of type I synapses onto PV-positive dendrites derive from mossy fibers in strata lucidum and pyramidale (Seress et al., 2001). As each mossy fiber gives few synapses, PV-expressing basket cells receive input from convergent granule cells, which can drive CA3 interneuron firing (Toth et al., 2000; Henze et al., 2002; Lawrence et al., 2004; Mori et al., 2004). However, mossy fiber input differs for distinct GABAergic cell types; PV-expressing basket cells receive rather weak inputs from many mossy fibers, correlated to the high frequency of background excitation (Szabadics and Soltesz, 2009). This mossy fiber input might enable CA3 PV-expressing basket cells to coordinate the efficiency of signal transfer between the dentate gyrus and CA3. The cooperation of these areas is important for pattern separation and forming associations (Lee et al., 2004; Leutgeb et al., 2004, 2007; Knierim et al., 2006; Bakker et al., 2008). When granule cell firing increases, as the animal enters a cell's place field, the strong input to pyramidal cells is thought to trigger plasticity in the recurrent CA3 network (Kobayashi and Poo, 2004), strengthening and promoting connections, or reinforce particular cell assemblies. The relatively fast mossy fiber-evoked activation of CA3 basket cells may make them less sensitive to subsequent feedback excitation from the activated pyramidal cells through shunting or reducing the driving force of synaptic currents. Such disinhibition could contribute to plasticity between CA3 pyramidal cells (Ormond and Woodin, 2009).
During theta oscillations, granule cells are hyperpolarized, firing at very low frequencies (Ylinen et al., 1995a; Skaggs et al., 1996; Bland et al., 2002). A single granule cell can drive postsynaptic pyramidal cells only when firing at relatively high frequencies, as in the cell's place field (Henze et al., 2002). In CA3, we found that both putative pyramidal cells and PV-expressing basket cells fired around the trough of CA1 theta oscillations, consistent with an input from the dentate gyrus, where granule cells also preferentially fired around the trough or descending phase of CA1 theta, both in awake (Buzsáki, 1986; Fox et al., 1986; Skaggs et al., 1996; Mizuseki et al., 2009) and urethane anesthetized rats (Buzsáki, 1986; Ylinen et al., 1995a; Bland et al., 2002) (but see Fox et al., 1986). Furthermore, CA3 pyramidal cells and interneurons were most active when granule cells with high firing rates were also active in awake rats (Mizuseki et al., 2009).
Synaptic inputs from CA3 pyramidal cells
Assuming 10% GABAergic synaptic input to PV-expressing basket cells (Beaulieu et al., 1992; Gulyás et al., 1999) and considering the rest to be glutamatergic, the data suggest that ∼65% of synapses to basket cells come from CA3 pyramidal cells. PV-positive cells in CA3, CA1, and the hilus were shown to receive input from CA3 pyramidal cells (Sik et al., 1993), unlike some other interneurons (Wittner et al., 2006). Paired recordings of CA3 pyramidal cells and physiologically identified interneurons in vitro showed that CA3 pyramidal cells provide strong, fast, reliable excitatory input to nearby interneurons (Miles, 1990). Similarly to dentate (Geiger et al., 1997) and CA1 basket cells (Buhl et al., 1994; Ali et al., 1998; Thomson and Destexhe, 1999), CA2/3 basket cells are innervated with high probability by local pyramidal cells. A pyramidal cell provides a small, as yet unknown number of synapses to a basket cell (Gulyás et al., 1993; Sik et al., 1993; Mercer et al., 2012). Our counts of synapses suggest that if, on average, one pyramidal cell provides three synapses to a PV-expressing basket cell, then 7600 pyramidal cells will converge on each basket cell. If a pyramidal cell provides only two synapses, the number of converging pyramidal cells will be 11,500. The relative strength of these inputs might explain the high firing rates of PV-expressing basket cells. The recurrent and commissural CA3 pyramidal cell input to basket cells explains their strong activation and phase locking to CA3 ripples as found here and also in vitro (Ellender et al., 2010).
During gamma oscillations, CA3 pyramidal cells fire slightly before PV-expressing basket cells. This is consistent with proposals that gamma phasing of pyramidal cell activity by PV-expressing basket cells is influenced by a strong recurrent excitatory input (Miles, 1990), as suggested by previous recordings of interneurons in vitro (Mann et al., 2005) and in freely moving rats (Csicsvari et al., 2003).
Entorhinal cortical input
The complete visualization of CA2/3 basket cells has revealed unexpectedly large dendritic arborizations and many synaptic inputs in stratum lacunosum moleculare, compared to PV-basket cells in CA1. Our estimate is based on the membrane surface and the density of synapses in each layer. We have taken into account all relevant technical factors, and have calculated for the fixed, unprocessed brain dimensions. Due to fixation, linear shrinkage occurs to 0.88 times the living brain (Kisvárday and Eysel, 1993). As it is not known what fraction of this is due to loss of extracellular or intracellular space, we did not extrapolate the parameters for the living brain. The shrinkage from living to fixed brain would not affect the total synapse numbers, but dendritic length and surface would be higher and synaptic density would be lower in the living brain.
In CA1 and CA3, PV-positive dendrites receive synapses from the entorhinal cortex (Kiss et al., 1996), but the number of synapses received from single entorhinal neurons is not known. Assuming 10% GABAergic synapses on the dendrites and three synapses to a PV-expressing basket cell from a single entorhinal neuron produces an estimated convergence of ∼2500 presynaptic entorhinal cells per CA2/3 basket cell; assuming two synapses raises this to 3800 cells. As a population, layer 2 entorhinal glutamatergic cells innervating CA3 fire at a later theta phase than layer 3 pyramidal cells that innervate CA1 (Mizuseki et al., 2009). The increased dendritic surface of PV-expressing basket cells in stratum lacunosum moleculare, a synaptic target of the layer 2 entorhinal afferents in CA3, is a likely contributor to the later firing phase of basket cells in CA3 than in CA1.
This input contributes to the coordination of spike timing between entorhinal cortex and CA3, ensuring the encoding of new memories by modifying the recurrent connections within CA3 (Nakazawa et al., 2003; Nakashiba et al., 2008).
The effectiveness of synaptic inputs to distal PV-expressing basket cell dendrites in st. lacunosum moleculare may be regulated by distally evoked dendritic spikes as in some interneurons (Martina et al., 2000), and/or through a Kv3 channel mechanism discovered in dentate PV-expressing basket cells (Hu et al., 2010). Since the majority of PV-expressing cells express Kv3 channels (Du et al., 1996), the latter mechanism may also be present in CA3. Passive membrane properties could also contribute to increasing the efficacy of distal inputs (Nörenberg et al., 2010). Precise coincidence detection in basket cells could be important for synchronization of the CA3 network at higher frequencies, e.g., when gamma oscillations are coherent between CA1 and CA3 (Csicsvari et al., 2003), as also seen here.
The larger number of entorhinal inputs to basket cells in CA3 compared to CA1 supports the distinct roles of these two areas during network oscillations. The CA3 area is a generator of gamma oscillations (Csicsvari et al., 2003), whereas CA1 reflects more the inputs. PV-expressing basket cells in CA3 integrate input timing from both dentate gyrus and entorhinal cortex to reciprocally entrain CA3 pyramidal cells to gamma oscillations. In contrast, CA1 basket and pyramidal cells follow the CA3 gamma waves and input from the entorhinal cortex. Overall, we have revealed the specific patterns of firing and dendritic arborization of identified CA3 PV-expressing basket cells. The differences between CA1 and CA3 PV-expressing basket cells are specific adaptation of the same cell type to the distinct roles of these areas in information processing.
Footnotes
This work was supported by European Research Council Grant 242689, Vienna Science and Technology Fund Grant SCIC03, and the Medical Research Council, UK. B.L. was supported by the Blaschko European Visiting Research Fellowship at Oxford University. We are grateful to Agnes Baude for EM analysis; to Loránd Farkas, Károly Orbán-Kis, and Arturo Vega-González for help with the preparation of the hippocampal flat map; to Espen Henriksen and Menno Witter for sharing their script for flat-map construction; to Kristina Detzner for expert technical assistance; and to Ben Micklem for data analysis and image processing. We are grateful to Ryuichi Shigemoto and Masahiko Watanabe for the gift of antibodies, and to Ray Guillery, Norbert Hájos, and Pablo Henny for their critical comments on an earlier version of this manuscript.
The authors declare no competing financial interests.
References
- Acsády L, Kamondi A, Sík A, Freund T, Buzsáki G. GABAergic cells are the major postsynaptic targets of mossy fibers in the rat hippocampus. J Neurosci. 1998;18:3386–3403. doi: 10.1523/JNEUROSCI.18-09-03386.1998. [DOI] [PMC free article] [PubMed] [Google Scholar]
- Ali AB, Deuchars J, Pawelzik H, Thomson AM. CA1 pyramidal to basket and bistratified cell EPSPs: dual intracellular recordings in rat hippocampal slices. J Physiol. 1998;507:201–217. doi: 10.1111/j.1469-7793.1998.201bu.x. [DOI] [PMC free article] [PubMed] [Google Scholar]
- Bakker A, Kirwan CB, Miller M, Stark CE. Pattern separation in the human hippocampal CA3 and dentate gyrus. Science. 2008;319:1640–1642. doi: 10.1126/science.1152882. [DOI] [PMC free article] [PubMed] [Google Scholar]
- Beaulieu C, Kisvárday Z, Somogyi P, Cynader M, Cowey A. Quantitative distribution of GABA-immunopositive and -immunonegative neurons and synapses in the monkey striate cortex (area 17) Cereb Cortex. 1992;2:295–309. doi: 10.1093/cercor/2.4.295. [DOI] [PubMed] [Google Scholar]
- Behrens CJ, van den Boom LP, de Hoz L, Friedman A, Heinemann U. Induction of sharp wave-ripple complexes in vitro and reorganization of hippocampal networks. Nat Neurosci. 2005;8:1560–1567. doi: 10.1038/nn1571. [DOI] [PubMed] [Google Scholar]
- Bland BH, Konopacki J, Dyck RH. Relationship between membrane potential oscillations and rhythmic fischarges in identified hippocampal theta-related cells. J Neurophysiol. 2002;88:3046–3066. doi: 10.1152/jn.00315.2002. [DOI] [PubMed] [Google Scholar]
- Brankack J, Stewart M, Fox SE. Current source density analysis of the hippocampal theta rhythm: associated sustained potentials and candidate synaptic generators. Brain Res. 1993;615:310–327. doi: 10.1016/0006-8993(93)90043-M. [DOI] [PubMed] [Google Scholar]
- Buhl EH, Halasy K, Somogyi P. Diverse sources of hippocampal unitary inhibitory postsynaptic potentials and the number of synaptic release sites. Nature. 1994;368:823–828. doi: 10.1038/368823a0. [DOI] [PubMed] [Google Scholar]
- Buzsáki G. Feed-forward inhibition in the hippocampal formation. Prog Neurobiol. 1984;22:131–153. doi: 10.1016/0301-0082(84)90023-6. [DOI] [PubMed] [Google Scholar]
- Buzsáki G. Hippocampal sharp waves: their origin and significance. Brain Res. 1986;398:242–252. doi: 10.1016/0006-8993(86)91483-6. [DOI] [PubMed] [Google Scholar]
- Buzsáki G, Draguhn A. Neuronal oscillations in cortical networks. Science. 2004;304:1926–1929. doi: 10.1126/science.1099745. [DOI] [PubMed] [Google Scholar]
- Buzsáki G, Czopf J, Kondákor I, Kellényi L. Laminar distribution of hippocampal rhythmic slow activity (RSA) in the behaving rat: current-source density analysis, effects of urethane and atropine. Brain Res. 1986;365:125–137. doi: 10.1016/0006-8993(86)90729-8. [DOI] [PubMed] [Google Scholar]
- Cardin JA, Carlén M, Meletis K, Knoblich U, Zhang F, Deisseroth K, Tsai LH, Moore CI. Driving fast-spiking cells induces gamma rhythm and controls sensory responses. Nature. 2009;459:663–667. doi: 10.1038/nature08002. [DOI] [PMC free article] [PubMed] [Google Scholar]
- Cobb SR, Buhl EH, Halasy K, Paulsen O, Somogyi P. Synchronization of neuronal activity in hippocampus by individual GABAergic interneurons. Nature. 1995;378:75–78. doi: 10.1038/378075a0. [DOI] [PubMed] [Google Scholar]
- Cobb SR, Halasy K, Vida I, Nyiri G, Tamás G, Buhl EH, Somogyi P. Synaptic effects of identified interneurons innervating both interneurons and pyramidal cells in the rat hippocampus. Neuroscience. 1997;79:629–648. doi: 10.1016/S0306-4522(97)00055-9. [DOI] [PubMed] [Google Scholar]
- Csicsvari J, Hirase H, Czurko A, Mamiya A, Buzsáki G. Fast network oscillations in the hippocampal CA1 region of the behaving rat. J Neurosci. 1999;19:RC20. doi: 10.1523/JNEUROSCI.19-16-j0001.1999. [DOI] [PMC free article] [PubMed] [Google Scholar]
- Csicsvari J, Hirase H, Mamiya A, Buzsáki G. Ensemble patterns of hippocampal CA3-CA1 neurons during sharp wave-associated population events. Neuron. 2000;28:585–594. doi: 10.1016/S0896-6273(00)00135-5. [DOI] [PubMed] [Google Scholar]
- Csicsvari J, Jamieson B, Wise KD, Buzsáki G. Mechanisms of gamma oscillations in the hippocampus of the behaving rat. Neuron. 2003;37:311–322. doi: 10.1016/S0896-6273(02)01169-8. [DOI] [PubMed] [Google Scholar]
- Dragoi G, Buzsáki G. Temporal encoding of place sequences by hippocampal cell assemblies. Neuron. 2006;50:145–157. doi: 10.1016/j.neuron.2006.02.023. [DOI] [PubMed] [Google Scholar]
- Du J, Zhang L, Weiser M, Rudy B, McBain CJ. Developmental expression and functional characterization of the potassium-channel subunit Kv3.1b in parvalbumin-containing interneurons of the rat hippocampus. J Neurosci. 1996;16:506–518. doi: 10.1523/JNEUROSCI.16-02-00506.1996. [DOI] [PMC free article] [PubMed] [Google Scholar]
- Ellender TJ, Nissen W, Colgin LL, Mann EO, Paulsen O. Priming of hippocampal population bursts by individual perisomatic-targeting interneurons. J Neurosci. 2010;30:5979–5991. doi: 10.1523/JNEUROSCI.3962-09.2010. [DOI] [PMC free article] [PubMed] [Google Scholar]
- Engel AK, Fries P, Singer W. Dynamic predictions: Oscillations and synchrony in top-down processing. Nat Rev Neurosci. 2001;2:704–716. doi: 10.1038/35094565. [DOI] [PubMed] [Google Scholar]
- Ferraguti F, Cobden P, Pollard M, Cope D, Shigemoto R, Watanabe M, Somogyi P. Immunolocalization of metabotropic glutamate receptor 1a (mGluR1a) in distinct classes of interneuron in the CA1 region of the rat hippocampus. Hippocampus. 2004;14:193–215. doi: 10.1002/hipo.10163. [DOI] [PubMed] [Google Scholar]
- Fisahn A, Pike FG, Buhl EH, Paulsen O. Cholinergic induction of network oscillations at 40 Hz in the hippocampus in vitro. Nature. 1998;394:186–189. doi: 10.1038/28179. [DOI] [PubMed] [Google Scholar]
- Fischer Y, Wittner L, Freund TF, Gähwiler BH. Simultaneous activation of gamma and theta network oscillations in rat hippocampal slice cultures. J Physiol. 2002;539:857–868. doi: 10.1113/jphysiol.2001.013050. [DOI] [PMC free article] [PubMed] [Google Scholar]
- Fox SE, Wolfson S, Ranck JB., Jr Hippocampal theta rhythm and the firing of neurons in walking and urethane anesthetized rats. Exp Brain Res. 1986;62:495–508. doi: 10.1007/BF00236028. [DOI] [PubMed] [Google Scholar]
- Freund TF, Antal M. GABA-containing neurons in the septum control inhibitory interneurons in the hippocampus. Nature. 1988;336:170–173. doi: 10.1038/336170a0. [DOI] [PubMed] [Google Scholar]
- Freund TF, Buzsáki G. Interneurons of the hippocampus. Hippocampus. 1996;6:347–470. doi: 10.1002/(SICI)1098-1063(1996)6:4<347::AID-HIPO1>3.0.CO;2-I. [DOI] [PubMed] [Google Scholar]
- Frotscher M. Mossy fibres form synapses with identified pyramidal basket cells in the CA3 region of the guinea-pig hippocampus: a combined Golgi-electron microscope study. J Neurocytol. 1985;14:245–259. doi: 10.1007/BF01258450. [DOI] [PubMed] [Google Scholar]
- Frotscher M. Mossy fiber synapses on glutamate decarboxylase-immunoreactive neurons: evidence for feed-forward inhibition in the CA3 region of the hippocampus. Exp Brain Res. 1989;75:441–445. doi: 10.1007/BF00247950. [DOI] [PubMed] [Google Scholar]
- Frotscher M, Léránth C. Cholinergic innervation of the rat hippocampus as revealed by choline acetyltransferase immunocytochemistry: a combined light and electron microscopic study. J Comp Neurol. 1985;239:237–246. doi: 10.1002/cne.902390210. [DOI] [PubMed] [Google Scholar]
- Fuchs EC, Zivkovic AR, Cunningham MO, Middleton S, Lebeau FE, Bannerman DM, Rozov A, Whittington MA, Traub RD, Rawlins JN, Monyer H. Recruitment of parvalbumin-positive interneurons determines hippocampal function and associated behavior. Neuron. 2007;53:591–604. doi: 10.1016/j.neuron.2007.01.031. [DOI] [PubMed] [Google Scholar]
- Fuentealba P, Klausberger T, Karayannis T, Suen WY, Huck J, Tomioka R, Rockland K, Capogna M, Studer M, Morales M, Somogyi P. Expression of COUP-TFII nuclear receptor in restricted GABAergic neuronal populations in the adult rat hippocampus. J Neurosci. 2010;30:1595–1609. doi: 10.1523/JNEUROSCI.4199-09.2010. [DOI] [PMC free article] [PubMed] [Google Scholar]
- Fukuda T, Kosaka T. Gap junctions linking the dendritic network of GABAergic interneurons in the hippocampus. J Neurosci. 2000;20:1519–1528. doi: 10.1523/JNEUROSCI.20-04-01519.2000. [DOI] [PMC free article] [PubMed] [Google Scholar]
- Geiger JR, Lübke J, Roth A, Frotscher M, Jonas P. Submillisecond AMPA receptor-mediated signaling at a principal neuron-interneuron synapse. Neuron. 1997;18:1009–1023. doi: 10.1016/S0896-6273(00)80339-6. [DOI] [PubMed] [Google Scholar]
- Gillies MJ, Traub RD, LeBeau FE, Davies CH, Gloveli T, Buhl EH, Whittington MA. A model of atropine-resistant theta oscillations in rat hippocampal area CA1. J Physiol. 2002;543:779–793. doi: 10.1113/jphysiol.2002.024588. [DOI] [PMC free article] [PubMed] [Google Scholar]
- Glickfeld LL, Scanziani M. Distinct timing in the activity of cannabinoid-sensitive and cannabinoid-insensitive basket cells. Nat Neurosci. 2006;9:807–815. doi: 10.1038/nn1688. [DOI] [PMC free article] [PubMed] [Google Scholar]
- Good P. Permutation tests: a practical guide to resampling methods for testing hypotheses. Ed 2. New York: Springer; 2000. revised ed. [Google Scholar]
- Gray CM, König P, Engel AK, Singer W. Oscillatory responses in cat visual cortex exhibit inter-columnar synchronization which reflects global stimulus properties. Nature. 1989;338:334–337. doi: 10.1038/338334a0. [DOI] [PubMed] [Google Scholar]
- Gulyás AI, Miles R, Sík A, Tóth K, Tamamaki N, Freund TF. Hippocampal pyramidal cells excite inhibitory neurons through a single release site. Nature. 1993;366:683–687. doi: 10.1038/366683a0. [DOI] [PubMed] [Google Scholar]
- Gulyás AI, Megias M, Emri Z, Freund TF. Total number and ratio of excitatory and inhibitory synapses converging onto single interneurons of different types in the CA1 area of the rat hippocampus. J Neurosci. 1999;19:10082–10097. doi: 10.1523/JNEUROSCI.19-22-10082.1999. [DOI] [PMC free article] [PubMed] [Google Scholar]
- Gulyás AI, Szabó GG, Ulbert I, Holderith N, Monyer H, Erdélyi F, Szabó G, Freund TF, Hájos N. Parvalbumin-containing fast-spiking basket cells generate the field potential oscillations induced by cholinergic receptor activation in the hippocampus. J Neurosci. 2010;30:15134–15145. doi: 10.1523/JNEUROSCI.4104-10.2010. [DOI] [PMC free article] [PubMed] [Google Scholar]
- Hájos N, Pálhalmi J, Mann EO, Németh B, Paulsen O, Freund TF. Spike timing of distinct types of GABAergic interneuron during hippocampal gamma oscillations in vitro. J Neurosci. 2004;24:9127–9137. doi: 10.1523/JNEUROSCI.2113-04.2004. [DOI] [PMC free article] [PubMed] [Google Scholar]
- Halasy K, Buhl EH, Lörinczi Z, Tamás G, Somogyi P. Synaptic target selectivity and input of GABAergic basket and bistratified interneurons in the CA1 area of the rat hippocampus. Hippocampus. 1996;6:306–329. doi: 10.1002/(SICI)1098-1063(1996)6:3<306::AID-HIPO8>3.0.CO;2-K. [DOI] [PubMed] [Google Scholar]
- Hangya B, Borhegyi Z, Szilágyi N, Freund TF, Varga V. GABAergic neurons of the medial septum lead the hippocampal network during theta activity. J Neurosci. 2009;29:8094–8102. doi: 10.1523/JNEUROSCI.5665-08.2009. [DOI] [PMC free article] [PubMed] [Google Scholar]
- Harris KD. Neural signatures of cell assembly organization. Nat Rev Neurosci. 2005;6:399–407. doi: 10.1038/nrn1669. [DOI] [PubMed] [Google Scholar]
- Harris KD, Henze DA, Czicvari J, Hirase H, Buzsáki G. Accuracy of tetrode spike separation as determined by simultaneous intracellular and extracellular measurements. J Neurophysiol. 2000;84:401–414. doi: 10.1152/jn.2000.84.1.401. [DOI] [PubMed] [Google Scholar]
- Hazan L, Zugaro M, Buzsáki G. Klusters, NeuroScope, NDManager: a free software suite for neurophysiological data processing and visualization. J Neurosci Methods. 2006;155:207–216. doi: 10.1016/j.jneumeth.2006.01.017. [DOI] [PubMed] [Google Scholar]
- Hebb DO. The organization of behavior: a neuropsychological theory. New York: Wiley; 1949. [Google Scholar]
- Henze DA, Borhegyi Z, Csicsvari J, Mamiya A, Harris KD, Buzsáki G. Intracellular features predicted by extracellular recordings in the hippocampus in vivo. J Neurophysiol. 2000;84:390–400. doi: 10.1152/jn.2000.84.1.390. [DOI] [PubMed] [Google Scholar]
- Henze DA, Wittner L, Buzsáki G. Single granule cells reliably discharge targets in the hippocampal CA3 network in vivo. Nat Neurosci. 2002;5:790–795. doi: 10.1038/nn887. [DOI] [PubMed] [Google Scholar]
- Howard MW, Rizzuto DS, Caplan JB, Madsen JR, Lisman J, Aschenbrenner-Scheibe R, Schulze-Bonhage A, Kahana MJ. Gamma oscillations correlate with working memory load in humans. Cereb Cortex. 2003;13:1369–1374. doi: 10.1093/cercor/bhg084. [DOI] [PubMed] [Google Scholar]
- Hu H, Martina M, Jonas P. Dendritic mechanisms underlying rapid synaptic activation of fast-spiking hippocampal interneurons. Science. 2010;327:52–58. doi: 10.1126/science.1177876. [DOI] [PubMed] [Google Scholar]
- Kiss J, Buzsáki G, Morrow JS, Glantz SB, Leranth C. Entorhinal cortical innervation of parvalbumin-containing neurons (basket and chandelier cells) in the rat Ammon's horn. Hippocampus. 1996;6:239–246. doi: 10.1002/(SICI)1098-1063(1996)6:3<239::AID-HIPO3>3.0.CO;2-I. [DOI] [PubMed] [Google Scholar]
- Kisvárday ZF, Eysel UT. Functional and structural topography of horizontal inhibitory connections in cat visual cortex. Eur J Neurosci. 1993;5:1558–1572. doi: 10.1111/j.1460-9568.1993.tb00226.x. [DOI] [PubMed] [Google Scholar]
- Klausberger T, Magill PJ, Márton L, Roberts JD, Cobden PM, Buzsáki G, Somogyi P. Brain state- and cell type-specific firing of hippocampal interneurons in vivo. Nature. 2003;421:844–848. doi: 10.1038/nature01374. [DOI] [PubMed] [Google Scholar]
- Klausberger T, Marton LF, O'Neill J, Huck JH, Dalezios Y, Fuentealba P, Suen WY, Papp E, Kaneko T, Watanabe M, Csicsvari J, Somogyi P. Complementary roles of cholecystokinin- and parvalbumin-expressing GABAergic neurons in hippocampal network oscillations. J Neurosci. 2005;25:9782–9793. doi: 10.1523/JNEUROSCI.3269-05.2005. [DOI] [PMC free article] [PubMed] [Google Scholar]
- Knierim JJ, Lee I, Hargreaves EL. Hippocampal place cells: parallel input streams, subregional processing, and implications for episodic memory. Hippocampus. 2006;16:755–764. doi: 10.1002/hipo.20203. [DOI] [PubMed] [Google Scholar]
- Kobayashi K, Poo MM. Spike train timing-dependent associative modification of hippocampal CA3 recurrent synapses by mossy fibers. Neuron. 2004;41:445–454. doi: 10.1016/S0896-6273(03)00873-0. [DOI] [PubMed] [Google Scholar]
- Lapray D, Lasztoczi B, Lagler M, Viney TJ, Katona L, Valenti O, Hartwich K, Borhegyi Z, Somogyi P, Klausberger T. Behavior-dependent specialization of identified hippocampal interneurons. Nat Neurosci. 2012;15:1265–1271. doi: 10.1038/nn.3176. [DOI] [PMC free article] [PubMed] [Google Scholar]
- Lasztóczi B, Tukker JJ, Klausberger T, Somogyi P. Terminal field and firing selectivity of cholecystokinin-expressing interneurons in the hippocampal CA3 area. J Neurosci. 2011;31:18073–18093. doi: 10.1523/JNEUROSCI.3573-11.2011. [DOI] [PMC free article] [PubMed] [Google Scholar]
- Lawrence JJ, Grinspan ZM, McBain CJ. Quantal transmission at mossy fibre targets in the CA3 region of the rat hippocampus. J Physiol. 2004;554:175–193. doi: 10.1113/jphysiol.2003.049551. [DOI] [PMC free article] [PubMed] [Google Scholar]
- Lee I, Yoganarasimha D, Rao G, Knierim JJ. Comparison of population coherence of place cells in hippocampal subfields CA1 and CA3. Nature. 2004;430:456–459. doi: 10.1038/nature02739. [DOI] [PubMed] [Google Scholar]
- Leutgeb JK, Leutgeb S, Moser MB, Moser EI. Pattern separation in the dentate gyrus and CA3 of the hippocampus. Science. 2007;315:961–966. doi: 10.1126/science.1135801. [DOI] [PubMed] [Google Scholar]
- Leutgeb S, Leutgeb JK, Treves A, Moser MB, Moser EI. Distinct ensemble codes in hippocampal areas CA3 and CA1. Science. 2004;305:1295–1298. doi: 10.1126/science.1100265. [DOI] [PubMed] [Google Scholar]
- Lisman JE, Idiart MA. Storage of 7 ± 2 short-term memories in oscillatory subcycles. Science. 1995;267:1512–1515. doi: 10.1126/science.7878473. [DOI] [PubMed] [Google Scholar]
- Llinás R, Ribary U, Contreras D, Pedroarena C. The neuronal basis for consciousness. Philos Trans R Soc Lond B Biol Sci. 1998;353:1841–1849. doi: 10.1098/rstb.1998.0336. [DOI] [PMC free article] [PubMed] [Google Scholar]
- Lovett-Barron M, Turi GF, Kaifosh P, Lee PH, Bolze F, Sun XH, Nicoud JF, Zemelman BV, Sternson SM, Losonczy A. Regulation of neuronal input transformations by tunable dendritic inhibition. Nat Neurosci. 2012;15:423–430. S1–S3. doi: 10.1038/nn.3024. [DOI] [PubMed] [Google Scholar]
- MacVicar BA, Dudek FE. Local synaptic circuits in rat hippocampus: interactions between pyramidal cells. Brain Res. 1980;184:220–223. doi: 10.1016/0006-8993(80)90602-2. [DOI] [PubMed] [Google Scholar]
- Mann EO, Suckling JM, Hájos N, Greenfield SA, Paulsen O. Perisomatic feedback inhibition underlies cholinergically induced fast network oscillations in the rat hippocampus in vitro. Neuron. 2005;45:105–117. doi: 10.1016/j.neuron.2004.12.016. [DOI] [PubMed] [Google Scholar]
- Markram H, Toledo-Rodriguez M, Wang Y, Gupta A, Silberberg G, Wu C. Interneurons of the neocortical inhibitory system. Nat Rev Neurosci. 2004;5:793–807. doi: 10.1038/nrn1519. [DOI] [PubMed] [Google Scholar]
- Martina M, Vida I, Jonas P. Distal initiation and active propagation of action potentials in interneuron dendrites. Science. 2000;287:295–300. doi: 10.1126/science.287.5451.295. [DOI] [PubMed] [Google Scholar]
- Mercer A, Trigg HL, Thomson AM. Characterization of neurons in the CA2 subfield of the adult rat hippocampus. J Neurosci. 2007;27:7329–7338. doi: 10.1523/JNEUROSCI.1829-07.2007. [DOI] [PMC free article] [PubMed] [Google Scholar]
- Mercer A, Eastlake K, Trigg HL, Thomson AM. Local circuitry involving parvalbumin-positive basket cells in the CA2 region of the hippocampus. Hippocampus. 2012;22:43–56. doi: 10.1002/hipo.20841. [DOI] [PubMed] [Google Scholar]
- Miles R. Synaptic excitation of inhibitory cells by single CA3 hippocampal pyramidal cells of the guinea-pig in vitro. J Physiol. 1990;428:61–77. doi: 10.1113/jphysiol.1990.sp018200. [DOI] [PMC free article] [PubMed] [Google Scholar]
- Miles R, Wong RK. Unitary inhibitory synaptic potentials in the guinea-pig hippocampus in vitro. J Physiol. 1984;356:97–113. doi: 10.1113/jphysiol.1984.sp015455. [DOI] [PMC free article] [PubMed] [Google Scholar]
- Mizuseki K, Sirota A, Pastalkova E, Buzsáki G. Theta oscillations provide temporal windows for local circuit computation in the entorhinal-hippocampal loop. Neuron. 2009;64:267–280. doi: 10.1016/j.neuron.2009.08.037. [DOI] [PMC free article] [PubMed] [Google Scholar]
- Montgomery SM, Buzsáki G. Gamma oscillations dynamically couple hippocampal CA3 and CA1 regions during memory task performance. Proc Natl Acad Sci U S A. 2007;104:14495–14500. doi: 10.1073/pnas.0701826104. [DOI] [PMC free article] [PubMed] [Google Scholar]
- Montgomery SM, Sirota A, Buzsáki G. Theta and gamma coordination of hippocampal networks during waking and rapid eye movement sleep. J Neurosci. 2008;28:6731–6741. doi: 10.1523/JNEUROSCI.1227-08.2008. [DOI] [PMC free article] [PubMed] [Google Scholar]
- Mori M, Abegg MH, Gähwiler BH, Gerber U. A frequency-dependent switch from inhibition to excitation in a hippocampal unitary circuit. Nature. 2004;431:453–456. doi: 10.1038/nature02854. [DOI] [PubMed] [Google Scholar]
- Nakashiba T, Young JZ, McHugh TJ, Buhl DL, Tonegawa S. Transgenic inhibition of synaptic transmission reveals role of CA3 output in hippocampal learning. Science. 2008;319:1260–1264. doi: 10.1126/science.1151120. [DOI] [PubMed] [Google Scholar]
- Nakazawa K, Quirk MC, Chitwood RA, Watanabe M, Yeckel MF, Sun LD, Kato A, Carr CA, Johnston D, Wilson MA, Tonegawa S. Requirement for hippocampal CA3 NMDA receptors in associative memory recall. Science. 2002;297:211–218. doi: 10.1126/science.1071795. [DOI] [PMC free article] [PubMed] [Google Scholar]
- Nakazawa K, Sun LD, Quirk MC, Rondi-Reig L, Wilson MA, Tonegawa S. Hippocampal CA3 NMDA receptors are crucial for memory acquisition of one-time experience. Neuron. 2003;38:305–315. doi: 10.1016/S0896-6273(03)00165-X. [DOI] [PubMed] [Google Scholar]
- Nörenberg A, Hu H, Vida I, Bartos M, Jonas P. Distinct nonuniform cable properties optimize rapid and efficient activation of fast-spiking GABAergic interneurons. Proc Natl Acad Sci U S A. 2010;107:894–899. doi: 10.1073/pnas.0910716107. [DOI] [PMC free article] [PubMed] [Google Scholar]
- Oren I, Mann EO, Paulsen O, Hájos N. Synaptic currents in anatomically identified CA3 neurons during hippocampal gamma oscillations in vitro. J Neurosci. 2006;26:9923–9934. doi: 10.1523/JNEUROSCI.1580-06.2006. [DOI] [PMC free article] [PubMed] [Google Scholar]
- Ormond J, Woodin MA. Disinhibition mediates a form of hippocampal long-term potentiation in area CA1. PLoS One. 2009;4:e7224. doi: 10.1371/journal.pone.0007224. [DOI] [PMC free article] [PubMed] [Google Scholar]
- Pawelzik H, Hughes DI, Thomson AM. Modulation of inhibitory autapses and synapses on rat CA1 interneurones by GABAA receptor ligands. J Physiol. 2003;546:701–716. doi: 10.1113/jphysiol.2002.035121. [DOI] [PMC free article] [PubMed] [Google Scholar]
- Rácz A, Ponomarenko AA, Fuchs EC, Monyer H. Augmented hippocampal ripple oscillations in mice with reduced fast excitation onto parvalbumin-positive cells. J Neurosci. 2009;29:2563–2568. doi: 10.1523/JNEUROSCI.5036-08.2009. [DOI] [PMC free article] [PubMed] [Google Scholar]
- Royer S, Zemelman BV, Losonczy A, Kim J, Chance F, Magee JC, Buzsáki G. Control of timing, rate and bursts of hippocampal place cells by dendritic and somatic inhibition. Nat Neurosci. 2012;15:769–775. doi: 10.1038/nn.3077. [DOI] [PMC free article] [PubMed] [Google Scholar]
- Schomburg EW, Anastassiou CA, Buzsáki G, Koch C. The spiking component of oscillatory extracellular potentials in the rat hippocampus. J Neurosci. 2012;32:11798–11811. doi: 10.1523/JNEUROSCI.0656-12.2012. [DOI] [PMC free article] [PubMed] [Google Scholar]
- Seress L, Abrahám H, Paleszter M, Gallyas F. Granule cells are the main source of excitatory input to a subpopulation of GABAergic hippocampal neurons as revealed by electron microscopic double staining for zinc histochemistry and parvalbumin immunocytochemistry. Exp Brain Res. 2001;136:456–462. doi: 10.1007/s002210000601. [DOI] [PubMed] [Google Scholar]
- Sik A, Tamamaki N, Freund TF. Complete axon arborization of a single CA3 pyramidal cell in the rat hippocampus, and its relationship with postsynaptic parvalbumin-containing interneurons. Eur J Neurosci. 1993;5:1719–1728. doi: 10.1111/j.1460-9568.1993.tb00239.x. [DOI] [PubMed] [Google Scholar]
- Skaggs WE, McNaughton BL, Wilson MA, Barnes CA. Theta phase precession in hippocampal neuronal populations and the compression of temporal sequences. Hippocampus. 1996;6:149–172. doi: 10.1002/(SICI)1098-1063(1996)6:2<149::AID-HIPO6>3.0.CO;2-K. [DOI] [PubMed] [Google Scholar]
- Sohal VS, Zhang F, Yizhar O, Deisseroth K. Parvalbumin neurons and gamma rhythms enhance cortical circuit performance. Nature. 2009;459:698–702. doi: 10.1038/nature07991. [DOI] [PMC free article] [PubMed] [Google Scholar]
- Somogyi P. Hippocampus—intrinsic organisation. In: Shepherd GM, Grillner S, editors. Handbook of brain microcircuits. Oxford: Oxford UP; 2010. pp. 148–164. [Google Scholar]
- Sullivan D, Csicsvari J, Mizuseki K, Montgomery S, Diba K, Buzsáki G. Relationships between hippocampal sharp waves, ripples, and fast gamma oscillation: Influence of dentate and entorhinal cortical activity. J Neurosci. 2011;31:8605–8616. doi: 10.1523/JNEUROSCI.0294-11.2011. [DOI] [PMC free article] [PubMed] [Google Scholar]
- Swanson LW, Wyss JM, Cowan WM. An autoradiographic study of the organization of intrahippocampal association pathways in the rat. J Comp Neurol. 1978;181:681–715. doi: 10.1002/cne.901810402. [DOI] [PubMed] [Google Scholar]
- Szabadics J, Soltesz I. Functional specificity of mossy fiber innervation of GABAergic cells in the hippocampus. J Neurosci. 2009;29:4239–4251. doi: 10.1523/JNEUROSCI.5390-08.2009. [DOI] [PMC free article] [PubMed] [Google Scholar]
- Thomson AM, Destexhe A. Dual intracellular recordings and computational models of slow inhibitory postsynaptic potentials in rat neocortical and hippocampal slices. Neuroscience. 1999;92:1193–1215. doi: 10.1016/S0306-4522(99)00021-4. [DOI] [PubMed] [Google Scholar]
- Toth K, Suares G, Lawrence JJ, Philips-Tansey E, McBain CJ. Differential mechanisms of transmission at three types of mossy fiber synapse. J Neurosci. 2000;20:8279–8289. doi: 10.1523/JNEUROSCI.20-22-08279.2000. [DOI] [PMC free article] [PubMed] [Google Scholar]
- Tukker JJ, Fuentealba P, Hartwich K, Somogyi P, Klausberger T. Cell type-specific tuning of hippocampal interneuron firing during gamma oscillations in vivo. J Neurosci. 2007;27:8184–8189. doi: 10.1523/JNEUROSCI.1685-07.2007. [DOI] [PMC free article] [PubMed] [Google Scholar]
- Wittner L, Henze DA, Záborszky L, Buzsáki G. Hippocampal CA3 pyramidal cells selectively innervate aspiny interneurons. Eur J Neurosci. 2006;24:1286–1298. doi: 10.1111/j.1460-9568.2006.04992.x. [DOI] [PubMed] [Google Scholar]
- Wulff P, Ponomarenko AA, Bartos M, Korotkova TM, Fuchs EC, Bahner F, Both M, Tort AB, Kopell NJ, Wisden W, Monyer H. Hippocampal theta rhythm and its coupling with gamma oscillations require fast inhibition onto parvalbumin-positive interneurons. Proc Natl Acad Sci U S A. 2009;106:3561–3566. doi: 10.1073/pnas.0813176106. [DOI] [PMC free article] [PubMed] [Google Scholar]
- Ylinen A, Soltész I, Bragin A, Penttonen M, Sik A, Buzsáki G. Intracellular correlates of hippocampal theta rhythm in identified pyramidal cells, granule cells, and basket cells. Hippocampus. 1995a;5:78–90. doi: 10.1002/hipo.450050110. [DOI] [PubMed] [Google Scholar]
- Ylinen A, Bragin A, Nádasdy Z, Jandó G, Szabó I, Sik A, Buzsáki G. Sharp wave-associated high-frequency oscillation (200 Hz) in the intact hippocampus: network and intracellular mechanisms. J Neurosci. 1995b;15:30–46. doi: 10.1523/JNEUROSCI.15-01-00030.1995. [DOI] [PMC free article] [PubMed] [Google Scholar]
- Zar JH. Biostatistical analysis. Ed 4. Upper Saddle River, NJ: Prentice Hall; 1999. [Google Scholar]