

The metabolic profile in paediatric patients suffering from acute P. falciparum malaria carries sufficient information to grade disease severity.
Keywords: disease staging, malaria, metabolomics
Abstract
Background. Accuracy in malaria diagnosis and staging is vital to reduce mortality and post infectious sequelae. In this study, we present a metabolomics approach to diagnostic staging of malaria infection, specifically Plasmodium falciparum infection in children.
Methods. A group of 421 patients between 6 months and 6 years of age with mild and severe states of malaria with age-matched controls were included in the study, 107, 192, and 122, individuals, respectively. A multivariate design was used as basis for representative selection of 20 patients in each category. Patient plasma was subjected to gas chromatography-mass spectrometry analysis, and a full metabolite profile was produced from each patient. In addition, a proof-of-concept model was tested in a Plasmodium berghei in vivo model where metabolic profiles were discernible over time of infection.
Results. A 2-component principal component analysis revealed that the patients could be separated into disease categories according to metabolite profiles, independently of any clinical information. Furthermore, 2 subgroups could be identified in the mild malaria cohort who we believe represent patients with divergent prognoses.
Conclusions. Metabolite signature profiling could be used both for decision support in disease staging and prognostication.
Malaria infection caused by Plasmodium falciparum is one of the primary contributors to childhood mortality and obstetric complications in the developing world [1]. The development of new diagnostic measures is an uphill climb mainly because of socioeconomic issues and the lack of access to relevant technology in endemic regions. During the course of an infection, the parasite has to metabolically adapt through several developmental stages and also induce profound metabolic flux in the host. Metabolomics in turn aims at the identification and quantification of all metabolites present in specific biological sample, followed by characterization and classification of samples in relation to the question of study, with the final point being identification of biomarkers or biomarker patterns indicative of the physiological state (ie, disease). It has already been proven to be a valid approach in clinical infection studies [2, 3] and also in parasitology [4–6]. The erythrocytic stage in the parasite life cycle includes massive conversion of host molecules to energy and parasite constituents [7]. As a consequence, patients' blood will contain both metabolites excreted by the infected red blood cells, products of the erythrocyte lysis, products of parasite metabolism, and compounds that are produced by the host as a response to the parasite action. The wide exchange of nutrients and waste products between the host and the parasite will create a unique metabolic milieu in the host.
The specific in vivo P falciparum metabolite response needs to be differentiated from the response characteristic for all kinds of infections and from the metabolic “noise” not related to infection [3]. In vitro parasite growth induces a range of bias in the metabolism of the parasite due to a range of factors such as abundance of nutrients and the absence of an active immune response. It is known that alternative parasite biological states occur in the natural host that cannot be observed in in vitro-cultivated parasites [8]. Metabolomics comparison between rodent and human malaria may be of value, but they display differences in certain key metabolic processes [9]. Therefore, we reason that the metabolic profile of P falciparum is best assessed in patient samples. The aim of this study is to gain insight into the biochemical processes found in human P falciparum infection, the ulterior goal being the advancement of diagnostics and novel methods to assess disease progression and therapeutic effects. We have applied a multivariate experimental design to a select representative set of samples from a larger patient cohort of controls, mild and severe malaria patients. This selection was followed by mass spectrometry profiling and multivariate data analysis of the samples. The methodology we applied enabled us to obtain metabolite profiles characteristic of each studied groups of patients. The ability of the method to follow disease progression over time was further confirmed in a Plasmodium berghei murine model. Our findings clearly demonstrate the use of metabolomics as a valuable tool to assess and predict the course of acute P falciparum infection.
METHODS
Study Approval
The in vivo murine model was approved by the Laboratory Animal Ethical Committee in Umeå (No: A44-11). Ethical clearance for this study was obtained both from the Rwanda National Ethics Committee (No: 279/RNEC/2010) as well as the Regional Ethical Committee in Umeå (No: 09-064). Written informed consent was provided by the parent or legal guardian of each participant.
Animals and Infectious Agents
Groups of 4 female BALB/c mice were given intravenous injections of 1 × 10⁷ blood stage P berghei NK65. The mice were sacrificed early (day 1–2), mid (day 5), and late in infection (day 11). The mice were anesthetized and plasma was acquired via heart bleed exsanguination.
Patients
A total of 421 patients between 6 months and 6 years of age were enrolled from January 2011 to September 2013 at Nyagatare Hospital in Nyagatare district, Kiziguro Hospital and Ngarama Hospital in Gatsibo district or health centres in the catchment areas of the 3 hospitals in the Eastern Province of Rwanda. Written informed consent was provided by the parent or legal guardian of each participant. The patients were assessed on site by the attending pediatrician or study medical officer, and biometric and clinical parameters were recorded, as listed in Supplementary Tables 1–3. The patients were categorized according to the World Health Organization categories of severe malaria as well as mild malaria with age-matched healthy controls [10]. There were 107, 192, and 122 patients included in each group, respectively. Patients with a known human immunodeficiency virus positive status were excluded from the study. Blood samples were drawn on site, and bright field microscopy assessment of parasite presence was done in the routine laboratory facilities coupled to each clinic. Parasitemia percentages were done by manual counting of Giemsa-stained thin blood smears.
Patient Selection
Representative samples were chosen from the 421 samples, based on the clinical information. We selected 20 samples from each group of diagnostic categories (healthy controls, mild and severe malaria), 10 of each sex using a full factorial design (see Results and Supplementary Material). The design was applied to principal component analysis (PCA) plots of 2-component models with clinical data as X variables, resulting in a total of 60 samples selected for further investigation. Clinical information for the patients selected for this study is given in Supplementary Tables 1–3, and parameters of the models used to select the samples are given in Supplementary Table 4. Three cases warranted further attention after the initial analysis (see Supplementary Methods).
Sample Preparation
Plasma was prepared on site in Rwanda, and it was transported in liquid nitrogen to Sweden, thawed once for aliquoting, and frozen again in −80°C. Extraction, derivatization, and gas chromatography-mass spectrometry (GC-MS) analysis of all samples were done as described previously [11].
Data Processing
Hierarchical multivariate curve resolution was performed in MATLAB (MathWorks, Natick, MA) using custom scripts as described previously [12]. Only identified metabolites (84, excluding drugs) were used in further modeling. Before the multivariate comparison of data, peak areas were normalized using the peak areas of the 9 internal standards, which eluted across the whole chromatographic time range.
Multivariate and Univariate Data Analysis
The SIMCA software version 13.0 from MKS Umetrics AB (Umeå, Sweden) was used for all data modeling. The data was column mean centered, and the mean was divided by its standard deviation, ie, scaled to unit variance. We used PCA to investigate overall variability within the data and orthogonal partial least square discriminant analysis (OPLS-DA) to model between-class differences. Orthogonal partial least square was used to find metabolites correlated with parasitemia. A summary of the studied PCA and OPLS/OPLS-DA models is given in Supplementary Table 5. An outline of the multivariate analysis method can be found in Supplementary Methods.
Fold changes were calculated as the quotient of average values of the metabolite levels in each group, with samples that had missing values excluded from calculations. P values were calculated in Excel by performing 2-sample unequal variance t test with 2-tailed distribution. Receiver operatic characteristic (ROC) curves were calculated in MATLAB (R2014a; MathWorks).
RESULTS
A Representative Set of Patients Was Selected for Analysis
We applied a multivariate design approach [13] to select samples representative for the whole cohort of patients. The multidimensional clinical data were used as basis for representative selection of the patients. Principal component analysis modeling was used to summarize clinical data into a low-dimensional hyperplane, which was visualized as a score scatter plot. A full factorial experimental design was applied for sample selection. In each of the 4 corners of the scatter plot, 2 samples (patients) were selected along with 2 center points. This procedure was repeated for each gender. In this way, we selected representative samples of the multivariate space (defined as samples and clinical variables related to them). The sample selection for severe malaria cases was visualized in Figure 1; related plots for mild and severe cases can be found on Supplementary Figures 1 and 2.
Figure 1.
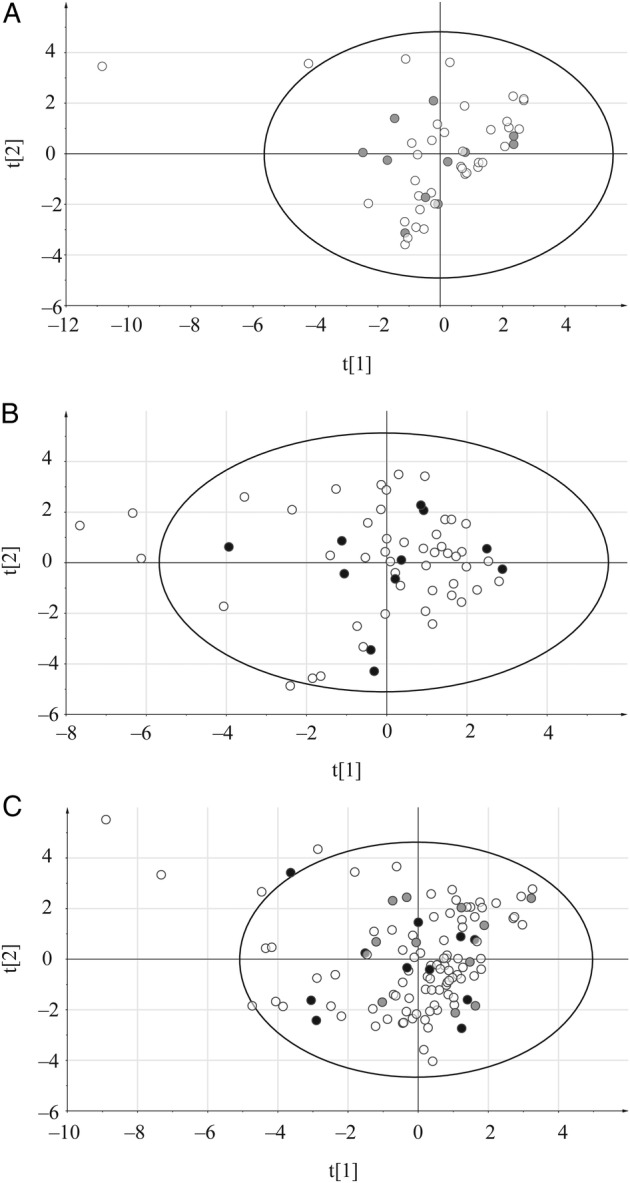
Principal component analysis score plots used for the selection of samples. The DOE, Design of Experiment approach was used for severe malaria patients with clinical data as X variables; samples selected for this study are marked in gray (females) and black (males); (A) females, (B) males, (C) all patients; x axis – t[1] first score, y axis – t[2], second score.
Separation of Patients Into Disease Categories According to Metabolite Profiles
The primary objective of the study was to find archetypal patterns in the metabolomics data that could be correlated to the clinical data. In the PCA model presented herein, a clear separation between controls and severe cases with mild malaria samples placed between them could be seen in the resulting score plot (Figure 2). This shows that metabolite profiles themselves, without any added clinical parameters, carry the information about the state of the disease.
Figure 2.
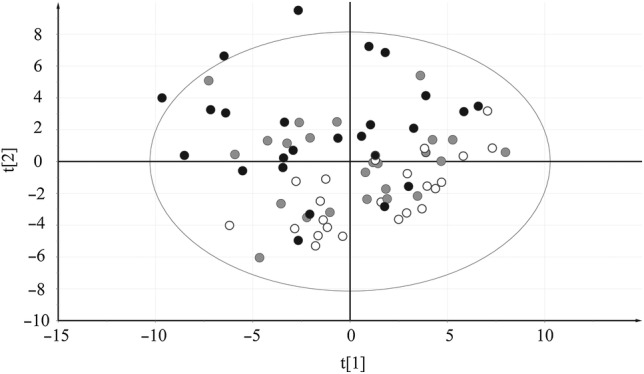
Principal component analysis score plot of identified metabolites. These are shown as X variables with samples colored according to their respective group: black dots signify severe malaria samples, gray dots signify mild malaria, and white dots signify controls. The separation of clinical groups according to their metabolic profiles is visualized in the plot: x axis, t[1], first score; y axis, t[2], second score.
Because the objective was to study the difference between 3 groups of samples, a more focused analysis method was required. Supervised modeling provided by OPLS-DA was used to obtain better interpretability of the data. It allows separation of systematic variation in the data into 2 components, one predictive (in this case, variation between groups) and the second orthogonal (within-group variation). Thus, we used OPLS-DA to elucidate which metabolite levels differ between the patient categories by comparing mild versus controls, severe versus controls, and severe versus mild for all samples. Significant models with coefficient of variation-analysis of variation (CV-ANOVA) values below 0.01 (Supplementary Table 5) were obtained for all OPLS-DA models. Overall, good separation and predictive capacity of each of the studied 2 groups were found as visualized in the cross-validated OPLS-DA score plots (Figure 3A–C), verifying applicability of this approach for studying between-group differences.
Figure 3.
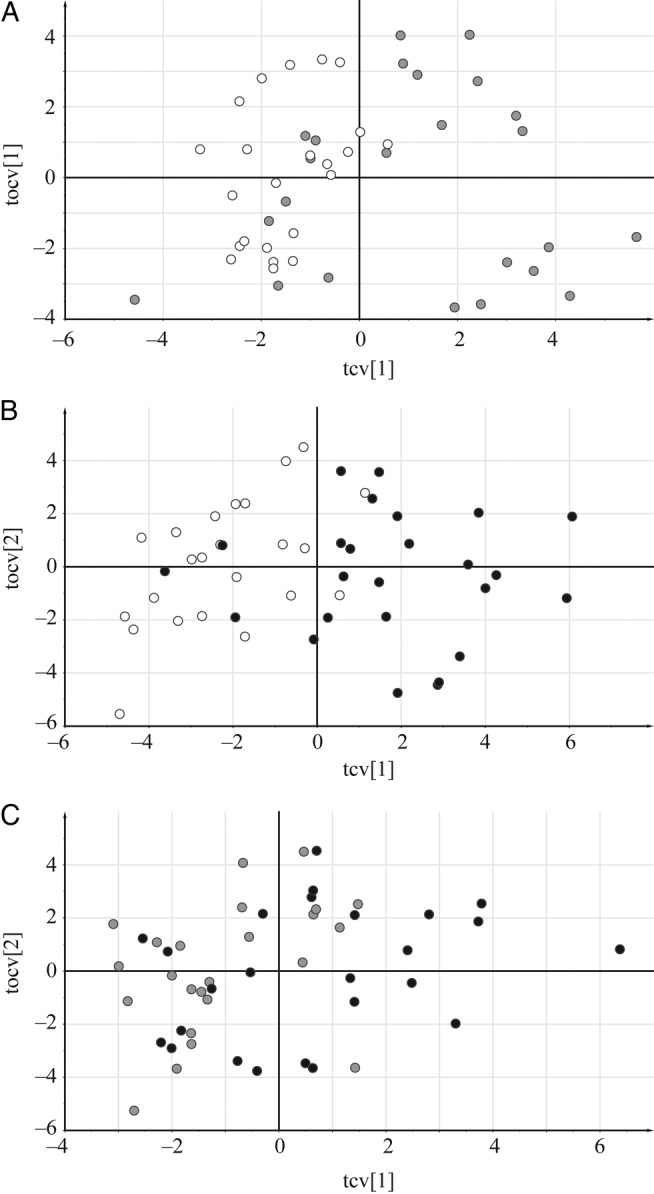
Orthogonal partial least square discriminant analysis cross-validated score plots. The identified metabolites are shown as X variables for the following: (A) mild malaria vs controls, (B) severe malaria vs controls, and (C) severe malaria vs mild. Black dots signify severe malaria samples, gray dots signify mild malaria, and white dots signify controls: x axis, tcv[1], cross-validated predictive score; y axis, tocv[1], cross-validated orthogonal score.
The Diagnostic Performance of the Metabolite Profile Models
Receiver operatic characteristic curve [14] is a common method of choice for evaluating performance of diagnostics in clinical studies. In our study, we decided to test ROC performance of the OPLS-DA models, based on the predictions resulting from the cross-validated procedure [15]. Receiver operatic characteristic curves created for each model are shown in Figure 4. The accuracy of each model was calculated by the area under curve (AUC), which was: 0.8442 for mild versus control model, 0.9165 for severe versus control model, and 0.7367 for the severe versus mild model.
Figure 4.
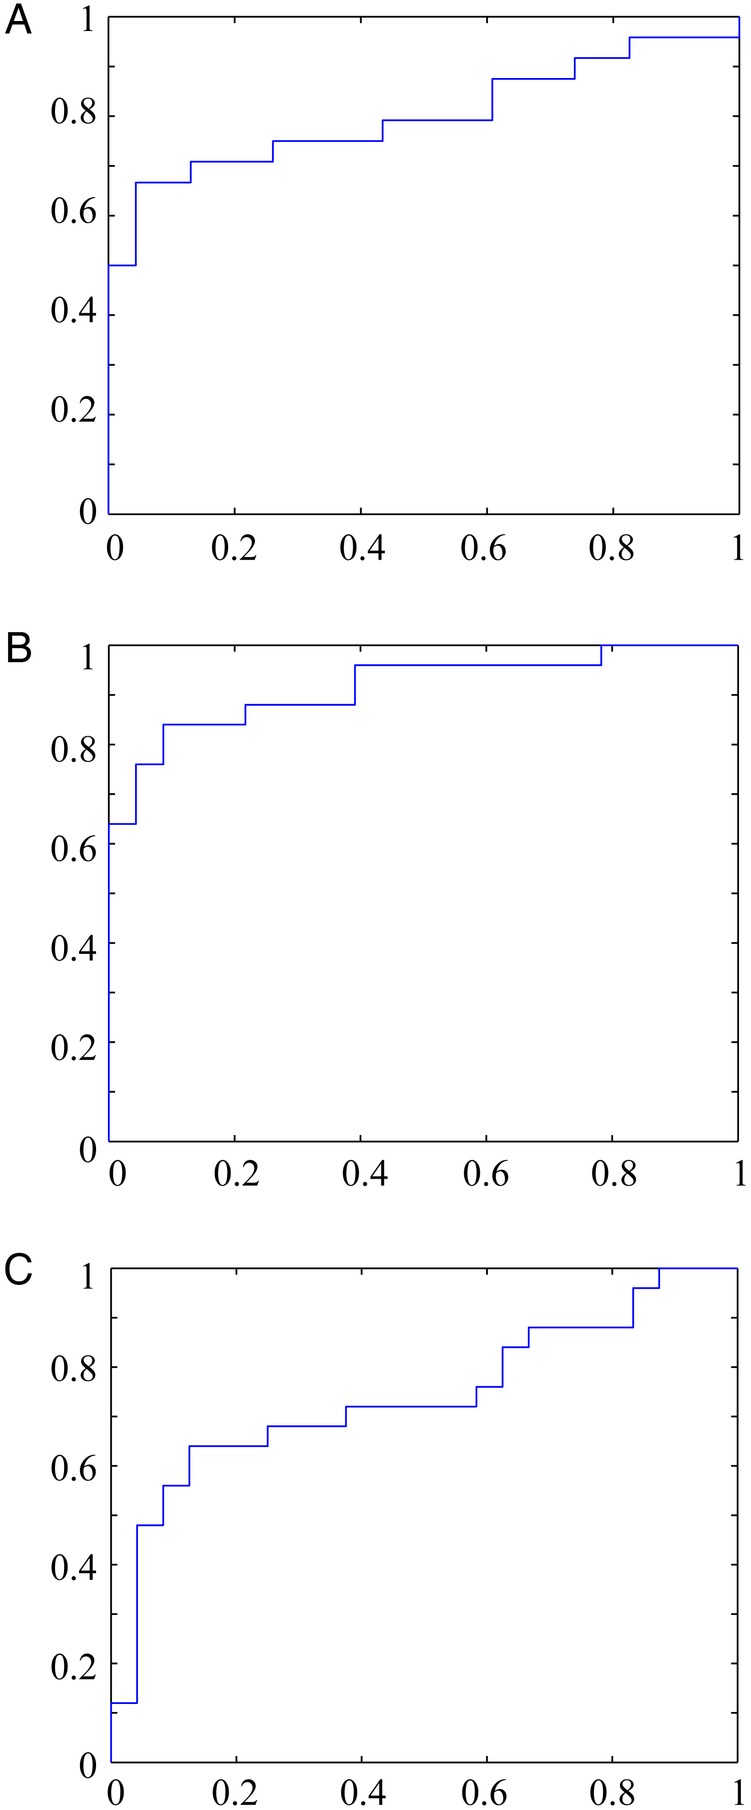
Receiver operatic characteristic curves calculated from the orthogonal partial least square discriminant analysis (OPLS-DA) models. These were calculated from predicted values of the fitted Ys for observations in the dataset, computed from the cross-validation procedure: (A) mild malaria vs controls (area under the curve [AUC] = 0.8442), (B) severe malaria vs controls (AUC = 0.9165), and (C) severe malaria vs mild malaria (AUC = 0.7367); false-positive rate at x axis and true positive rate at y axis, using class-belonging values predicted by the OPLS-DA models.
An orthogonal projections to latent structures (OPLS) model was constructed with parasitemia index as the response variable, an important variable in malaria diagnostics. The model parameters are outlined in Supplementary Table 5.
A list of 84 metabolites identified in the study is presented in Supplementary Table 6, together with their relative differences in the multivariate models. Arrows show whether compounds were present in higher or lower amounts in group-wise relationships (mild in comparison to controls, severe in comparison to controls, and severe in comparison to mild malaria patients) or whether they were positively or negatively correlated to parasitemia. Changes that were significant according to all studied OPLS models are marked in red, and significant P values between groups are marked with asterisks (* for P value below .05 and ** for P value below .01). Fold changes of metabolite levels when comparing each of the 2 groups of patients were also added to Supplementary Table 6 and are visualized in Figure 5. The levels of selected metabolites discussed in the text are visualized in Figure 6.
Figure 5.

Fold changes differences of metabolite levels in different disease states. (A) Differences between mild malaria compared with controls, (B) severe malaria compared with controls, and (C) severe malaria compared with mild cases; in black changes above 1.0; redirection of metabolism between studied groups of samples can be observed; metabolites are represented at the x axis and their fold change values in respective group comparisons at y axis.
Figure 6.

Group distribution of the levels of the most significant metabolites. Metabolite peak areas were normalized to the peak areas of the 9 internal standards, which were eluted across the whole chromatographic time range. The values are displayed on the y axis for each respective patient category. (A) glycerol, (B) palmitoleic acid, (C) hexadecanoic acid, (D) linoleic acid, (E) oleic acid, (F) stearic acid, (G) 3-hydroxybutyric acid, (H) alanine, (I) serine, (J) pyruvic acid, (K) valine.
Different States of Plasmodium falciparum Malaria Exhibited Specific Metabolite Patterns
The majority of all metabolites assayed in this study have been previously described in the context of malaria infection in humans. We can confirm numerous studies where the metabolite levels in plasma correspond to the result we present herein. This is true for lipids and lipid-related molecules [16–19], energy metabolites [20–23], amino acids [24–28], and other miscellaneous metabolite makers [29–31]. In short, we could observe the advent of acidosis and production of ketone bodies, consumption of energy metabolites, kidney dysfunction, lipolysis, and redistribution of protein biosynthesis during disease progression. The metabolite patterns were analyzed in the Metabolite Set Enrichment Analysis (MSEA) software [32], and the pathways that were detected as significantly altered were as follows: protein biosynthesis, ammonia recycling, urea cycle, and glutathione metabolism (data not shown). In the case of lipids, we could observe a consistent increase in the content of long-chain fatty acids and lipid-related metabolites in the plasma of patients when moving from the control to the severe malaria group (Supplementary Table 6 and Figure 5A–C). All long-chain fatty acids also showed positive correlation to the parasitemia, although these correlations were not significant according to the OPLS model. No significant changes in the levels of compounds from the tricarboxylic acid cycle could be observed.
With a few exceptions, amino acid concentration differences were not significant according to models nor based on P values or fold changes between groups (Supplementary Table 6). However, clear trends for their changes could be observed between studied groups of patients. Lower levels of practically all amino acids were observed in mild malaria patients compared with controls and compared with severe cases. In total, 11 amino acids showed increased concentrations and 10 reduced concentrations in severe cases compared with controls.
Approximately half of the amino acids showed increased, and the other half reduced amounts in relationship to high parasitemia values. A significant positive correlation with parasitemia values was observed for urea, glutamine, histidine, and tryptophan, whereas significant negative correlations were found for glutamic acid, pyroglutamic acid, erythritol, and serine.
Metabolomic Subgroups Were Revealed in Mild Malaria Patients
The general PCA plots of all studied groups did not show any clear subgrouping; however, investigation using a 2-group PCA revealed clear subgroups in the mild category (Supplementary Figure 3). This could also be observed in the PCA plots of all samples as an overlap between the mild and the severe malaria samples (Supplementary Figure 4). This subgroup was named mild(severe), whereas other mild samples were named mild(mild). There were 7 patients that could be classified in the mild(severe) subgroup, and they are marked bold in Supplementary Table 2. All patients in this group showed consistent behavior in their metabolic profiles compared with other mild patients and compared with other classes of patients (Supplementary Table 7). Parameters of the OPLS-DA models that were focused on the comparison of the new malaria subgroups with each other and with other groups are shown in Supplementary Table 8. Significant CV-ANOVA values were obtained when comparing the mild(severe) subgroup to the mild(mild) counterpart and to the controls and when comparing severe malaria patients to the mild(mild) subgroup.
Primarily long-chain fatty acids, steroids, glycerol as well as other organic acids were present in higher concentrations in the mild(severe) subgroup compared with the mild(mild) group. When the severe group was compared with the mild(severe) group, increased levels of fatty acids and other organic acids were observed in mild(severe) subgroup, but these changes were not statistically significant. No clear differences could be observed in other groups of compounds in this comparison. In addition, CV-ANOVA value for the OPLS-DA model between these 2 groups was not significant, which indicates that the groups are not clearly distinguishable based on the metabolomics profiles.
The mild(mild) subgroup in comparison to the severe malaria patient group showed lower levels of long-chain fatty acids, glycerol, most amino acids, and other organic acids. The mild(mild) subgroup also showed reduced amino acid content, increased sugar levels, and no consistent change in lipid content compared with controls. Metabolic changes characteristic for the mild malaria subgroups in comparison to each other and other classes of samples are summarized in Supplementary Table 7.
Metabolite Level Alterations Can Be Followed Over Time in an In Vivo Model
To test metabolic signature profiling as a possible tool to observe malaria disease progression, we performed GC-MS on plasma from BALB/c mice infected with P berghei parasites. Fifty metabolites could be identified. One sample was lost during analysis, day 11. A multivariate PCA analysis was performed on the metabolite data, and the resulting 2-component model was visualized as a sample scatterplot (Figure 7). The individual samples aggregated in a time-wise manner, and the mid and late infection animals were discernible from each other and also from early infection. The corresponding metabolite profiles of these samples over time can be found in Supplementary Table 9, showing that although there are some similarities between human samples and murine model (eg, increase in phenylalanine levels and increased lactic acidosis with time of infection), the general profiles are not fully comparable. This again proves that malaria infection is best studied in humans.
Figure 7.
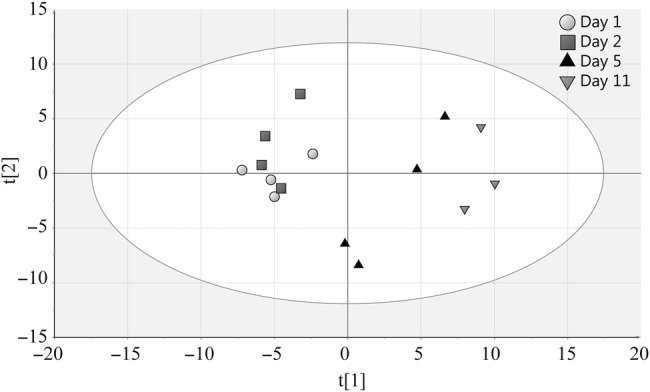
Principal component analysis score plot of metabolites from BALB/c mice. The graph shows the separation of samples according to the day of infection (number of mice, N = 3–4 in each group). Gray circles indicate day 1, gray squares indicate day 2, black triangles indicate day 5, and inverted gray triangles indicate day 11.
DISCUSSION
In this study, we were able to subcategorize malaria patients into distinct disease categories by the use of metabolite levels. To our knowledge, this is the first study that utilizes both a Design of Experiment DOE approach for sample selection and global GC-MS analysis to explore metabolic alterations in pediatric malaria patients. Our study shows that the strategy applied by us to select subset of samples from the bigger pool enabled us to obtain relevant results. In other words, good to excellent accuracy of the described approach based on OPLS-DA modeling of metabolic profiles could be observed from the ROC curves.
We also found distinct metabolic subgroups in the mild category of patients. These groups do not correspond to any subgrouping in the clinical data. We postulate the presence of 2 mild-malaria subcategories—one with the metabolic profile resembling the profile of the severe malaria group (increased presence of long-chain fatty acids and other organic acids compared with controls) and the other, with a “true” mild profile, signifying a reduction of most of amino acids and increased levels of sugars compared with controls. This profile could be interpreted as a scenario in which an organism starts to convert amino acids to sugars to acquire energy for fighting the infection. Detection of the severe subgroup in the mild malaria patients could be used as an early diagnostic marker for the severity of the disease, before the onset of clinical symptoms. In such a case, markers that differentiate this subgroup from other mild patients would be of crucial importance in clinical diagnostics.
To draw conclusions from metabolic parasite-host interactions, it is essential to understand the host response to acute infections. Microbial invasion induces a constellation of host responses collectively referred to as the acute-phase response [33], which is characterized by immunological, neuroendocrine, metabolic, and behavioral alternations [34]. As seen in Figure 6, metabolite levels generally increased with the severity of the disease. This indicates a general increase of metabolite deposition in the host compartment with the progression of Plasmodium infection. The majority of studies performed by metabolomics profiling in the malaria field has focused on in vitro-adapted P falciparum strains [35, 36] or on murine malaria models [16, 37–40]. To our knowledge, so far, only 2 studies have been focused on malaria infection in humans [41, 42], although there are currently several groups at work using this methodology for human and primate malaria studies.
The most striking metabolic effects we can show are the increased levels of fatty acids and lipid-related compounds in severe malaria patients. This effect is most likely related to the catabolic host response to infection, but it may also be induced by the parasite to meet its demand. The rapid growth rate throughout the erythrocytic stage requires intense membrane neogenesis, and hence lipids are crucial for parasite growth [43]. A meta study [44] concluded that cholesterol, high-density lipoproteins, and low-density lipoproteins concentrations are lower in malaria patients compared to both healthy controls and patients suffering from other febrile diseases. Triglycerides were shown to be elevated during malaria infection compared with healthy controls but not statistically significant compared with symptomatic controls. Although the quantity of lipid changes seems to be related to the severity of malaria in some studies [19, 45], others found no correlation [46, 47]. In our study, we identified a positive correlation of lipid-related molecules to parasitemia, reinforcing the finding.
The malaria parasite depends on glucose supplied by the host to meet its energy requirements. Alanine is a gluconeogenic precursor; its elevation together with higher lactate levels and hypoglycemia suggest an impairment of gluconeogenesis—hepatic use of alanine and its conversion to glucose is impaired in severe malaria [20, 23]. The lactate peak was not assessable in our study because of the chromatographic overload; however, alanine and pyruvate levels were lower in severe malaria patients compared with other groups (Supplementary Table 6, Figure 6H and J), making alanine the only metabolite in our study found to differ from previous literature. Alanine and pyruvic acid were also negatively correlated to parasitemia values. Relative hypopyruvatemia has been associated to poor outcome in severe malaria as a consequence of lactic acidosis expressed as an increase in lactate/pyruvate ratio in whole blood [48]. In our study, the levels of 3-hydroxybutyric acid were higher in the severe cases, reinforcing a situation of ketoacidosis and hypoglycaemia in the severe category (Supplementary Table 6, Figure 6G) [49]. The levels of valine, previously not explored in a malaria context, were also raised in severe disease, presumably related to hemoglobin digestion (Supplementary Table 6, Figure 6K). We also observed a depletion of serine (Supplementary Table 6, Figure 6I) associated to disease severity. This may be a result of uptake by the parasite and subsequent synthesis of phosphatidylcholine, which is the most abundant membrane phospholipid in P falciparum [50].
CONCLUSIONS
Taken together, these results show that metabolite profiling has the potential to be used as diagnostic tool and perhaps also to identify risk patients, assess disease progression, and even assess the evaluation of therapy. Further work includes identification of subsets of metabolites and subsequent transition to biochemical assays or point-of-care kits as a first route into clinical practice.
Supplementary Material
Supplementary material is available online at Open Forum Infectious Diseases (http://OpenForumInfectiousDiseases.oxfordjournals.org/).
Acknowledgments
This work is dedicated to the late Dr. Charles Murego. We thank Jimmy Magambo, Olivia Magara, Vincent Kayigire, Bob Kagoro, Tony Bazatsinda, Lisa Wiklund, Viktor Manberg, Ingela Ahlström, Charles Muhinda, and Christine Kubwimana for assistance in the clinic and Ingela Nilsson for technical assistance. We also thank Dr. Hans Stenlund from the Swedish Metabolomics Centre.
Author contributions. J. N., J. T., S. B., and J. O. designed research. I. S., J. O., E. K., M. B., M. N., and J. N. performed research. P. K. and B. K. contributed vital new reagents or analytical tools. I. S., J. O., E. K., S. B., J. T., and J. N. analyzed data. I. S., J. O., E. K., S. B., J. T., and J. N. wrote the paper.
Financial support. This work was supported by grants from the Swedish Research Council, The Jeansson Foundations, Molecular Infection Medicine Sweden, and the Erling Persson Foundation.
Potential conflicts of interest. All authors: No reported conflicts.
All authors have submitted the ICMJE Form for Disclosure of Potential Conflicts of Interest.
References
- 1.Beales PF, Brabin B, Dorman E, et al. Severe falciparum malaria. T Roy Soc Trop Med H 2000; 94:S1–90. [PubMed] [Google Scholar]
- 2.Fitzpatrick MA, Young SP. Metabolomics - a novel window into inflammatory disease. Swiss Med Wkly 2013; 143:w13743. [DOI] [PMC free article] [PubMed] [Google Scholar]
- 3.Laiakis EC, Morris GA, Fornace AJ, Howie SR. Metabolomic analysis in severe childhood pneumonia in The Gambia, West Africa: findings from a Pilot Study. PloS One 2010; 5:e12655. [DOI] [PMC free article] [PubMed] [Google Scholar]
- 4.MacRae JI, Dixon MW, Dearnley MK, et al. Mitochondrial metabolism of sexual and asexual blood stages of the malaria parasite Plasmodium falciparum. BMC Biology 2013; 11:67. [DOI] [PMC free article] [PubMed] [Google Scholar]
- 5.t'Kindt R, Scheltema RA, Jankevics A, et al. Metabolomics to unveil and understand phenotypic diversity between pathogen populations. PLoS Negl Trop Dis 2010; 4:e904. [DOI] [PMC free article] [PubMed] [Google Scholar]
- 6.Balog CI, Meissner A, Göraler S, et al. Metabonomic investigation of human Schistosoma mansoni infection. Mol Biosyst 2011; 7:1473–80. [DOI] [PubMed] [Google Scholar]
- 7.Fang X, Reifman J, Wallqvist A. Modeling metabolism and stage-specific growth of Plasmodium falciparum HB3 during the intraerythrocytic developmental cycle. Mol Biosyst 2014; 10:2526–37. [DOI] [PubMed] [Google Scholar]
- 8.LeRoux M, Lakshmanan V, Daily JP. Plasmodium falciparum biology: analysis of in vitro versus in vivo growth conditions. Trends Parasitol 2009; 25:474–81. [DOI] [PubMed] [Google Scholar]
- 9.Dechamps S, Maynadier M, Wein S, et al. Rodent and nonrodent malaria parasites differ in their phospholipid metabolic pathways. J Lipid Res 2010; 51:81–96. [DOI] [PMC free article] [PubMed] [Google Scholar]
- 10.Guidelines for the Treatment of Malaria. Second Edition Geneva: World Health Organization, 2010 [PubMed] [Google Scholar]
- 11.Jiye A, Trygg J, Gullberg J, et al. Extraction and GC/MS analysis of the human blood plasma metabolome. Anal Chem 2005; 77:8086–94. [DOI] [PubMed] [Google Scholar]
- 12.Jonsson P, Johansson AI, Gullberg J, et al. High-throughput data analysis for detecting and identifying differences between samples in GC/MS-based metabolomic analyses. Anal Chem 2005; 77:5635–42. [DOI] [PubMed] [Google Scholar]
- 13.Eriksson L, Johansson E, Kettaneh-Wold N, Wikstrom C, Wold S. Design of experiments. Principles and applications. Third ed Umea: UMETRICS AB, 2008 [Google Scholar]
- 14.Egan JP. Signal detection theory and ROC analysis. New York: Academic Press, 1975 [Google Scholar]
- 15.Martens H, Naes T. Multivariate calibration. New York: Wiley, 1989 [Google Scholar]
- 16.Basant A, Rege M, Sharma S, Sonawat HM. Alterations in urine, serum and brain metabolomic profiles exhibit sexual dimorphism during malaria disease progression. Malaria J 2010; 9:110–22. [DOI] [PMC free article] [PubMed] [Google Scholar]
- 17.Faucher JF, Ngou-Milama E, Missinou MA, et al. The impact of malaria on common lipid parameters. Parasitol Res 2002; 88:1040–3. [DOI] [PubMed] [Google Scholar]
- 18.Mohanty S, Mishra SK, Das BS, et al. Altered plasma-lipid pattern in falciparum-malaria. Ann Trop Med Parasit 1992; 86:601–6. [DOI] [PubMed] [Google Scholar]
- 19.Parola P, Gazin P, Patella F, et al. Hypertriglyceridemia as an indicator of the severity of falciparum malaria in returned travelers: a clinical retrospective study. Parasitol Res 2004; 92:464–6. [DOI] [PubMed] [Google Scholar]
- 20.Pukrittayakamee S, Krishna S, ter Kuile F, et al. Alanine metabolism in acute falciparum malaria. Trop Med Int Health 2002; 7:911–8. [DOI] [PubMed] [Google Scholar]
- 21.Das BS, Thurnham DI, Das DB. Plasma alpha-tocopherol, retinol, and carotenoids in children with falciparum malaria. Am J Clin Nutr 1996; 64:94–100. [DOI] [PubMed] [Google Scholar]
- 22.Krishna S, Waller DW, Terkuile F, et al. Lactic-acidosis and hypoglycemia in children with severe malaria - pathophysiological and prognostic-significance. T Roy Soc Trop Med H 1994; 88:67–73. [DOI] [PubMed] [Google Scholar]
- 23.White NJ, Marsh K, Turner RC, et al. Hypoglycemia in African children with severe malaria. Lancet 1987; 1:708–11. [DOI] [PubMed] [Google Scholar]
- 24.Lopansri BK, Anstey NM, Stoddard GJ, et al. Elevated plasma phenylalanine in severe malaria and implications for pathophysiology of neurological complications. Infect Immun 2006; 74:3355–9. [DOI] [PMC free article] [PubMed] [Google Scholar]
- 25.Enwonwu CO, Afolabi BM, Salako LA, et al. Hyperphenylalaninaemia in children with falciparum malaria. Qjm-Mon J Assoc Phys 1999; 92:495–503. [DOI] [PubMed] [Google Scholar]
- 26.Enwonwu CO, Afolabi BM, Salako LO, et al. Increased plasma levels of histidine and histamine in falciparum malaria: relevance to severity of infection. J Neural Transm 2000; 107:1273–87. [DOI] [PubMed] [Google Scholar]
- 27.Peterson JW, Boldogh I, Popov VL, et al. Anti-inflammatory and antisecretory potential of histidine in Salmonella-challenged mouse small intestine. Lab Invest 1998; 78:523–34. [PubMed] [Google Scholar]
- 28.Planche T, Dzeing A, Emmerson AC, et al. Plasma glutamine and glutamate concentrations in Gabonese children with Plasmodium falciparum infection. Qjm-Int J Med 2002; 95:89–97. [DOI] [PubMed] [Google Scholar]
- 29.Gunther A, Burchard GD, Slevogt H, et al. Renal dysfunction in falciparum-malaria is detected more often when assessed by serum concentration of cystatin C instead of creatinine. Trop Med Int Health 2002; 7:931–4. [DOI] [PubMed] [Google Scholar]
- 30.Lopera-Mesa TM, Mita-Mendoza NK, van de Hoef DL, et al. Plasma uric acid levels correlate with inflammation and disease severity in Malian children with Plasmodium falciparum malaria. PloS One 2012; 7:e46424. [DOI] [PMC free article] [PubMed] [Google Scholar]
- 31.Adeosun OG, Oduola T, Akanji BO, et al. Biochemical alteration in Nigerian children with acute falciparum malaria. Afr J Biotechnol 2007; 6:881–5. [Google Scholar]
- 32.Xia JG, Wishart DS. MSEA: a web-based tool to identify biologically meaningful patterns in quantitative metabolomic data. Nucleic Acids Res 2010; 38:W71–7. [DOI] [PMC free article] [PubMed] [Google Scholar]
- 33.Dinarello CA. Interleukin-1 and the pathogenesis of the acute-phase response. New Engl J Med 1984; 311:1413–8. [DOI] [PubMed] [Google Scholar]
- 34.Kushner I. The acute phase response - an overview. Method Enzymol 1988; 163:373–83. [DOI] [PubMed] [Google Scholar]
- 35.Sana TR, Gordon DB, Fischer SM, et al. Global mass spectrometry based metabolomics profiling of erythrocytes infected with Plasmodium falciparum. PloS One 2013; 8:e60840. [DOI] [PMC free article] [PubMed] [Google Scholar]
- 36.Duy SV, Besteiro S, Berry L, et al. A quantitative liquid chromatography tandem mass spectrometry method for metabolomic analysis of Plasmodium falciparum lipid related metabolites. Anal Chim Acta 2012; 739:47–55. [DOI] [PubMed] [Google Scholar]
- 37.Li JV, Wang Y, Saric J, et al. Global metabolic responses of NMRI mice to an experimental Plasmodium berghei infection. J Proteome Res 2008; 7:3948–56. [DOI] [PubMed] [Google Scholar]
- 38.Ghosh S, Sengupta A, Sharma S, Sonawat HM. Metabolic fingerprints of serum, brain, and liver are distinct for mice with cerebral and noncerebral malaria: A H-1 NMR spectroscopy-based metabonomic study. J Proteome Res 2012; 11:4992–5004. [DOI] [PubMed] [Google Scholar]
- 39.Ghosh S, Sengupta A, Sharma S, Sonawat HM. Metabolic perturbations of kidney and spleen in murine cerebral malaria: H-1 NMR-based metabolomic study. PloS One 2013; 8:e73113. [DOI] [PMC free article] [PubMed] [Google Scholar]
- 40.Penet MF, Kober F, Confort-Gouny S, et al. Magnetic resonance spectroscopy reveals an impaired brain metabolic profile in mice resistant to cerebral malaria infected with Plasmodium berghei ANKA. J Biol Chem 2007; 282:14505–14. [DOI] [PubMed] [Google Scholar]
- 41.Sengupta A, Ghosh S, Basant A, et al. Global host metabolic response to Plasmodium vivax infection: a H-1 NMR based urinary metabonomic study. Malaria J 2011; 10:384–96. [DOI] [PMC free article] [PubMed] [Google Scholar]
- 42.Lakshmanan V, Rhee KY, Wang W, et al. Metabolomic analysis of patient plasma yields evidence of plant-like alpha-linolenic acid metabolism in Plasmodium falciparum. J Infect Dis 2012; 206:238–48. [DOI] [PMC free article] [PubMed] [Google Scholar]
- 43.Dechamps S, Shastri S, Wengelnik K, Vial HJ. Glycerophospholipid acquisition in Plasmodium - A puzzling assembly of biosynthetic pathways. Int J Parasitol 2010; 40:1347–65. [DOI] [PubMed] [Google Scholar]
- 44.Visser BJ, Wieten RW, Nagel IM, Grobusch MP. Serum lipids and lipoproteins in malaria - a systematic review and meta-analysis. Malaria J 2013; 12:442–56. [DOI] [PMC free article] [PubMed] [Google Scholar]
- 45.Davis TM, Sturm M, Zhang YR, et al. Platelet-activating-factor and lipid-metabolism in acute malaria. J Infect 1993; 26:279–85. [DOI] [PubMed] [Google Scholar]
- 46.Kittl EM, Diridl G, Lenhart V, et al. HDL-cholesterol as a sensitive diagnostic criterion in malaria. Wien Klin Wochenschr 1992; 104:21–4. [PubMed] [Google Scholar]
- 47.Baptista JL, Vervoort T, VanderStuyft P, Wery M. Lipid plasma levels and Plasmodium falciparum infection in Sao Tome. Parasite 1996; 3:335–40. [DOI] [PubMed] [Google Scholar]
- 48.Day NPJ, Phu NH, Mai NT, et al. The pathophysiologic and prognostic significance of acidosis in severe adult malaria. Crit Care Med 2000; 28:1833–40. [DOI] [PubMed] [Google Scholar]
- 49.Sasi P, Burns SP, Waruiru C, et al. Metabolic acidosis and other determinants of hemoglobin-oxygen dissociation in severe childhood Plasmodium falciparum malaria. Am J Trop Med Hyg 2007; 77:256–60. [PubMed] [Google Scholar]
- 50.Elabbadi N, Ancelin ML, Vial HJ. Phospholipid metabolism of serine in Plasmodium-infected erythrocytes involves phosphatidylserine and direct serine decarboxylation. Biochem J 1997; 324:435–45. [DOI] [PMC free article] [PubMed] [Google Scholar]
Associated Data
This section collects any data citations, data availability statements, or supplementary materials included in this article.