

Abstract
Background
Cortical, thalamic and hippocampal gray matter atrophy in relapsing–remitting MS (RRMS) is associated cognitive deficits. However, the role of interconnecting white matter pathways including the fornix, cingulum, and uncinate fasciculus (UF) is less well studied.
Objective
To assess MS damage to a hippocampal–thalamic–prefrontal network and the relative contributions of its components to specific cognitive domains.
Methods
We calculated diffusion tensor fractional anisotropy (FA) in the fornix, cingulum and UF as well as thalamic and hippocampal volumes in 27 RRMS patients and 20 healthy controls. A neuropsychological battery was administered and 4 core tests known to be sensitive to MS changes were used to assess cognitive impairment. To determine the relationships between structure and cognition, all tests were grouped into 4 domains: attention/executive function, processing speed, verbal memory, and spatial memory. Univariate correlations with structural measures and depressive symptoms identified potential contributors to cognitive performance and subsequent linear regression determined their relative effects on performance in each domain. For significant predictors, we also explored the effects of laterality and axial versus radial diffusivity.
Results
RRMS patients had worse performance on the Symbol Digit Modalities Test, but no significant impairment in the 4 cognitive domains. RRMS had reduced mean FA of all 3 pathways and reduced thalamic and hippocampal volumes compared to controls. In RRMS we found that thalamic volume and BDI predicted attention/executive function, UF FA predicted processing speed, thalamic volume predicted verbal memory, and UF FA and BDI predicted spatial memory.
Conclusions
Hippocampal–thalamic–prefrontal disruption affects cognitive performance in early RRMS with mild to minimal cognitive impairment, confirming both white and gray matter involvement in MS and demonstrating utility in assessing functional networks to monitor cognition.
Keywords: Limbic system, Cognition, Memory, Multiple sclerosis, MRI, Diffusion tensor imaging
Abbreviations: AD, axial diffusivity; BDI, Beck Depression Inventory; BSRT, Buschke Selective Reminding Test; BVMT, Brief Visuospatial Memory Test; BVRT, Benton Visual Retention Test; CVLT-II, California Verbal Learning Test II; DTI, diffusion tensor imaging; EDSS, Expanded Disability Status Scale; FA, fractional anisotropy; FAST, FMRIB's Automated Segmentation Tool; FLAIR, Fluid Attenuated Inversion Recovery; FSL, Functional MRI of the Brain Software Library; FOV, field of view; GM, gray matter; MPRAGE, Magnetization Prepared Rapid Acquisition Gradient Echo; MRI, magnetic resonance image; NEX, number of excitations; PASAT, Paced Auditory Serial Addition Test; RAVLT, Rey Auditory Verbal Learning Test; RD, radial diffusivity; ROI, region of interest; RRMS, relapsing remitting multiple sclerosis; SDMT, Symbol Digit Modalities Test; TBSS, Tract-based Spatial Statistics; TE, echo time; TI, inversion time; TR, repetition time; UF, uncinate fasciculus; WAIS, Wechsler Adult Intelligence Scale; WM, white matter.
Highlights
-
•
We detect limbic white matter and gray matter insult in early RRMS patients with mild to minimal cognitive impairment.
-
•
Thalamic atrophy and uncinate fasciculus microstructural changes are associated with cognitive performance in early RRMS.
-
•
Depressive symptomatology also independently predicts cognitive performance
1. Background
Cognitive dysfunction in multiple sclerosis (MS) has a prevalence from 35% to 60% (Benedict and Zivadinov, 2011) and relates to disease progression (Amato etal., 2001), vocational status, and quality of life (Rao etal., 1991). However, conventional disease measures such as the Expanded Disability Status Scale (EDSS) and T2 lesion volume poorly predict cognitive decline. Advances in MRI and Diffusion Tensor Imaging (DTI) may identify better biomarkers for cognition.
MS is a demyelinating autoimmune disorder of focal inflammatory lesions in CNS white matter (WM) (Noseworthy etal., 2000). But imaging and pathology studies also demonstrate diffuse changes in both gray matter (GM) and WM contributing to cognitive dysfunction (Rovaris etal., 2002). Identifying early biomarkers predictive of subclinical changes in cognitive networks allows for monitoring of both disease progression and efficacy of treatments such as anticholinesterases or cognitive therapy (Benedict and Zivadinov, 2011).
Cognitive dysfunction in MS is also mediated by GM changes including cortical atrophy and cortical lesions found on MRI and histology (Benedict etal., 2002; Geurts etal., 2005). Subcortical atrophy in the thalamus (Cifelli etal., 2002; Houtchens etal., 2007) and hippocampus (Sicotte etal., 2008) is also related to cognitive deficits. The thalamus is affected early in MS(Cifelli etal., 2002), is associated with cognitive impairment (Houtchens etal., 2007), and predicts disease progression (Rocca etal., 2010). The hippocampus is implicated in MS-related memory impairment (Sicotte etal., 2008), but structural and functional changes are also seen with intact spatial memory (Roosendaal etal., 2010).
The anterior thalamic nuclei and the hippocampus interact bidirectionally via the cingulum bundle and the fornix to form the Papez circuit, which is critical to memory encoding and recall (Aggleton and Sahgal, 1993). MS-related damage has been shown invivo in both the fornix (Kern etal., 2012; Roosendaal etal., 2009) and the cingulum (Mesaros etal., 2012). The uncinate fasciculus (UF) is also affected in MS(Fink etal., 2010) and connects the anterior temporal pole to the prefrontal cortex, completing a thalamic–hippocampal–prefrontal circuit (see Fig. 1). All 3 pathways affected in MS are linked to cognitive performance, although the relative contributions remain ill-defined.
Fig. 1.
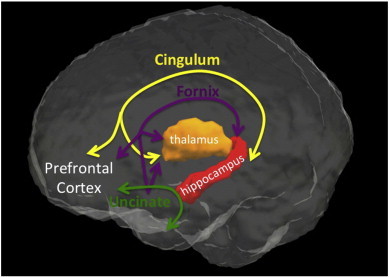
Limbic pathways completing a thalamic–hippocampal–prefrontal circuit include the cingulum, fornix and the uncinate fasciculus.
White matter damage in MS is traditionally assessed using T2 lesion volume, but has shown only modest associations with cognition (Rovaris etal., 1998). However, DTI is sensitive to microstructural changes even in normal appearing tissue, and has been linked to cognition in MS(Dineen etal., 2009). DTI tractography allows identification of specific WM bundles and quantification of tissue changes invivo(Wakana etal., 2007). DTI tractography is suitable for investigating cognitive networks, such as a thalamic–hippocampal–prefrontal circuit that is likely disrupted in MS.
We hypothesize that microstructural damage in the thalamic–hippocampal–prefrontal circuit is associated with cognitive function, particularly memory domains, in relapsing–remitting MS (RRMS). Given the widely distributed connections of the thalamus and its known impact on cognition in MS(Houtchens etal., 2007), we expect that disrupting these circuits will also affect other cognitive domains frequently affected including processing speed, attention and executive function. We hypothesize that early structural changes predict cognitive performance in domains of attention and executive function, processing speed, verbal memory and spatial memory before significant impairment is evident. While pathways in this network have been implicated individually, here we assess the relative contributions of insult to the cingulum bundle, the fornix, the UF, the thalamus and the hippocampus to cognitive performance in RRMS.
2. Methods
2.1. Subjects
Subjects included 27 RRMS patients diagnosed by McDonald Criteria(McDonald etal., 2001) and 20 healthy controls matched for age, gender and education level. Participants were recruited from the University of California, Los Angeles multiple sclerosis clinic and from the community using flyers, advertisements and social media. Control subjects were free of any neurologic or medical conditions, were on no medications, and had normal neurologic examinations. Patients were excluded if they had a relapse or received steroids within the previous 3 months. Participants with a history of drug or alcohol abuse within the previous 3 years were also excluded. Patients were assessed with the Expanded Disability Status Scale (EDSS) and the Beck Depression Inventory II (BDI-II) (Beck etal., 1997) to assess the confounding factor of depression, which is associated with cognition and hippocampal volume (Gold etal., 2010; Gold etal., 2014; Heesen etal., 2010).
2.2. Cognitive assessment
Cognitive tests included: the Wechsler Adult Intelligence Scale (WAIS) and Memory Scale III(Wechsler, 1945), the Delis–Kaplan Executive Function System, the Symbol Digit Modalities Test (SDMT) (Smith, 2002), the Paced Auditory Serial Addition Test (PASAT) (Gronwall, 1977), the Buschke Selective Reminding Test (BSRT) (Buschke, 1973), and the 7/24 Spatial-Recall Task (Rao etal., 1991). For all tests, scores for subcomponents were converted into Z-scores based on the control group. Similar to the Rao Brief Repeatable Neuropsychological Battery (BRNB) (Rao etal., 1991; Sepulcre etal., 2006) and the MS-COG(Erlanger etal., 2014) we determined cognitive impairment using 4 core tests that have been shown to be reliable and sensitive to the effects of MS on cognition: SDMT, PASAT, BSRT learning, and 7/24 learning. These core tests were combined into a composite score and effect sizes d were calculated. To assess the relationships between structural, cognitive and clinical measures, individual tests were grouped into 4 cognitive domains. The attention/executive function subscore consisted of the WAIS digit span and spatial span, and Delis–Kaplan Executive Function system components: trailmaking, Stroop, and verbal fluency. Processing speed tests included the SDMT and the PASAT. Verbal memory was scored using Wechsler Memory Scale III components: verbal paired associates I and II scores, and BSRT components: total learning, consolidated long-term recall, and delayed recall. Finally, the spatial memory subscore comprised of the 7/24 spatial-recall tests A and B and delayed recall. Z-scores were averaged within each cognitive domain to create 4 domain Z-scores for each subject.
2.3. MRI acquisition
All subjects were scanned with a Siemens Trio 3T MRI scanner. Scans included: a T1 3D volume (MPRAGE, TR = 2200 ms, TE = 3.4 ms, TI = 900 ms, FOV = 256 mm, matrix = 256 × 256, 176 axial 1 mm slices, 1NEX, resolution = 1 mm isotropic); a hippocampal oriented, high resolution coronal T2 described previously (TR = 8290, TE = 64, FOV = 200 mm, matrix 512 × 512, in-plane resolution = 0.4 × 0.4 mm, 2NEX, coronal 3 mm slices, no gap); (Gold etal., 2010) a T2 FLAIR (TR = 11,760, TE = 88, TI = 2500, FOV = 256 mm, matrix = 256 × 256, axial 3 mm slices, no gap) and a DTI sequence (30 noncollinear directions, 2 averages, a single high b-value of 1000 mm/s2, TR = 10,200 ms, TE = 84 ms, FOV = 256 mm, matrix = 128 × 128, 75 axial 2 mm slices, resolution = 2 mm3).
2.4. Image processing
Images were processed using FMRIB Software Library (FSL: http://www.fmrib.ox.ac.uk/fsl) (Jenkinson etal., 2012) and Diffusion Toolkit and Trackvis (trackvis.org) (Wang, 2007).
T1 images were used to calculate brain parenchymal volumes using FSL's FAST. FSL's FIRST was used to segment the thalami bilaterally and calculate combined thalamic volume. FLAIR images were used to manually identify WM hyperintensities and calculate total lesion load. Hi-resolutionhippocampal-oriented T2 images were used to manually segment the hippocampi as described previously (Sicotte etal., 2008). While we previously described segmenting hippocampal subregions, here we use only mean total left and right hippocampal volumes without the entorhinal cortex.
DTI data were corrected for eddy current distortion and head motion, a diffusion tensor was calculated at each voxel, and eigenvalues were used to calculate fractional anisotropy (FA), radial diffusivity (RD) and axial diffusivity maps (AD). FA images were skeletonized using FSL's Tract-Based Spatial Statistics (TBSS), which identifies the centermost voxels with maximal FA values of each white matter bundle for each subject. Tractography results were overlaid on these FA TBSS skeletons to derive statistics from the most robust voxels at the center of each tract. By using only TBSS skeleton voxels in statistical analyses, we minimize the direct effect of very low FA values within lesions and limit the effects of differences in trackability or anatomic variation by comparing an anatomically equivalent region of each tract across individuals. FA skeleton projections were transformed to RD and AD images to calculate tract statistics for these measures as well.
2.5. Tractography
Trackvis's Diffusion Toolkit uses deterministic fiber-tracking to identify all WM pathways in the brain, and individual pathways are manually selected using multiple regions of interest (ROIs). The 3 pathways were identified bilaterally on blinded FA images using a priori anatomical knowledge and established tractography protocols (Concha etal., 2005; Wakana etal., 2007). The cingulum was identified in two parts: the superior and the hippocampal portions, each selected with an anterior and posterior coronal ROI (see Fig. 2A). For the fornix, the first ROI selected the body of the fornix coronally while the second ROI axially selected a unilateral hippocampal tail. Anteriorly, the columns of the fornix were terminated at the level of the anterior commissure (see Fig. 2B). We identified the UF with 2 coronal ROIs in the anterior temporal and frontal lobes (see Fig. 2C). We assessed reproducibility by tracking 10 subjects twice and calculating a Kappa score of voxel-wise overlap. Mean FA was derived from each tract, and bilateral tracts were averaged for each subject.
Fig. 2.
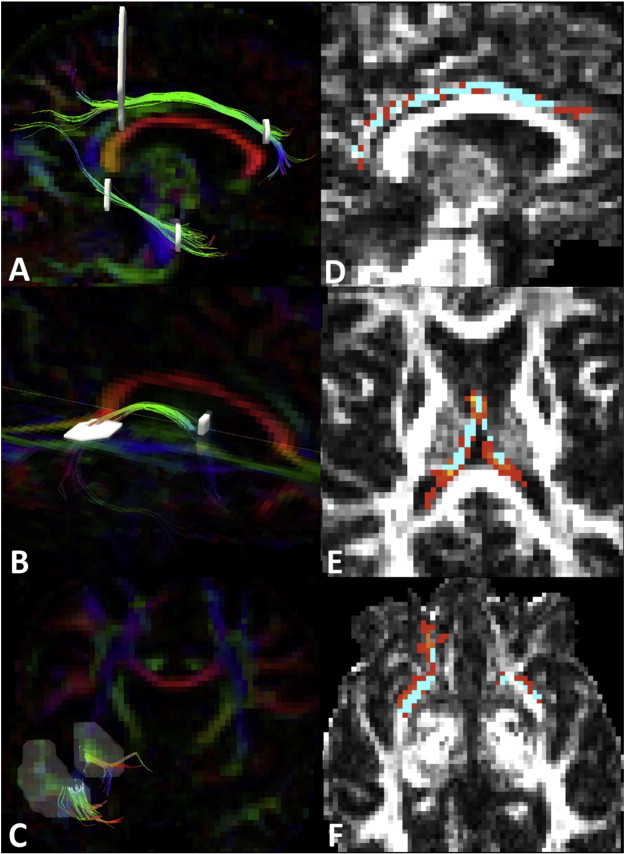
Tractography of the upper and lower cingulum (A), the fornix (B), and the uncinate (C)was achieved using multiple regions of interest (white) according to published tractography protocols {Concha, 2005; Wakana, 2007}. Cingulum (D), fornix (E)and uncinate (F)tractography (Red) is overlaid on the TBSS white matter skeleton (blue) to acquire diffusion metrics from only the centermost voxels of each tract in native space.
2.6. Statistical analyses
T-tests compared groups for the clinical variables of age, BDI-II, and years of education while a chi-squared test compared gender distribution. To assess cognitive impairment we used ANOVA to compare the raw scores for the PASAT, SDMT, BSRT learning, 7/24 learning, and the standardized composite score. Group differences in cognitive domain Z-scores were also assessed using ANOVA. Similarly, structural measures including mean FA of each pathway and GM volumes were compared across groups using ANOVA. Effect sizes were calculated using Cohen's d. Associations between structural or clinical measures and cognitive scores were tested first with univariate correlations. Predictors considered were: mean FA of each pathway, thalamic volume, hippocampal volume, and BDI-II score. Structural associations with each domain Z-score found to have Pearson's R > 0.30 were considered as predictors in a step-wise linear regression model to identify only significant, independent predictors of cognitive performance.
For significant associations, we went on to compare left vs right structures as well as axial (AD) vs radial diffusivities (RD) as predictors of cognitive function for descriptive purposes. For each significant association, we calculated bivariate correlations with the cognitive domain Z-score and the four diffusion metrics (left RD, left AD, right RD, right AD) or two volumes (left, right).
3. Results
There were no significant differences between the 27 RRMS and 20 controls in age, years of education, or gender distribution (see Table 1). RRMS had significantly higher mean BDI-II. 4 RRMS had BDI-II scores consistent with moderate to severe depressive symptoms (BDI-II > 19) while 2 controls met this cutoff. 3 additional RRMS had BDI-II scores between 14 and 19, consistent with mild depressive symptoms.
Table 1.
Clinical characteristics.
| Controls mean ± std dev | Patients mean ± std dev | Effect size d | p-Value | |
|---|---|---|---|---|
| N | 20 | 27 | ||
| Age | 34.1 ± 9.4 | 37.9 ± 8.2 | −0.43 | 0.15 |
| Female/male | 18/2 | 23/4 | 0.63 | |
| Years of education | 16.3 ± .4 | 16.2 ± .5 | 0.21 | 0.92 |
| EDSS | N/A | 2.5 ± 1.1 | ||
| Lesion volume (cm3) | N/A | 7.1 ± 2.0 | ||
| Beck depression-II | 3.5 ± 7.4 | 9.4 ± 8.9 | −0.66 | 0.02 |
| PASAT raw score | 45 ± 12 | 46 ± 12 | −0.08 | 0.41 |
| SDMT raw score | 61 ± 10 | 53 ± 11 | 0.71 | 0.02 |
| BSRT learning raw score | 46 ± 11 | 46 ± 11 | −0.02 | 0.94 |
| 7/24 learning raw score | 32 ± 3 | 30 ± 5 | 0.33 | 0.23 |
| Composite cognitive score | 0 ± 0.77 | −0.34 ± 0.78 | 0.43 | 0.14 |
| Attention/executiveZ-score | 0 ± 0.62 | −0.28 ± 0.44 | 0.48 | 0.11 |
| Processing Speed Z-score | 0 ± 0.90 | −0.34 ± 0.86 | 0.39 | 0.20 |
| Verbal memory Z-score | 0 ± 0.91 | −0.18 ± 0.44 | 0.19 | 0.52 |
| Spatial memory Z-score | 0 ± 0.77 | −0.50 ± 1.1 | 0.52 | 0.16 |
Bold values indicate significance at p < 0.05.
RRMS patients performed worse on the SDMT, (mean RRMS: 53.4 ± 10.3 vs mean control: 61.2 ± 10.3; effect size = 0.71; p = 0.014) but differences were not significant for the PASAT,BSRT learning, 7/24 learning, or the composite score for these 4 tests. In RRMS patients, T2 lesion volumes were significantly associated with performance on the BSRT learning (R = –0.54; p = 0.004), but not with the PASAT, SDMT, or 7/24 learning scores. EDSS was associated with the performance on the PASAT, (R = –0.42; p = 0.03) the SDMT, (R = –0.51; p = 0.001) the 7/24 learning (R = –0.43; p = 0.02) and the composite score (R = –0.58; p = 0.001). There were no group differences in the 4 cognitive domain Z-scores, though patients tended to perform worse. Cognitive domain scores were not associated with T2 lesion volumes, although they were each associated with EDSS (Attention/Executive R = –0.57, p = 0.002; Processing Speed R = –0.54, p = 0.003; Verbal Memory R = –0.46, p = 0.016; Spatial Memory R = –0.39, p = 0.04).
DTI tracking was reproducible as determined by a high Kappa. Tracks were reliably reconstructed in all participants and there were no differences in tractography image volumes between groups. Patients had reduced FA in each of the 3 WM pathways (see Table 2; ANOVA p = 0.003). Mean FA ± standard deviation for the cingulum was 0.484 ± .030 in controls and 0.450 ± .052 in RRMS (p = 0.008). Mean FA for the UF was 0.411 ± 0.012 for controls and 0.386 ± 0.012 for RRMS (p = 0.005). Mean FA for the fornix was 0.318 ± 0.036 in controls and 0.263 ± 0.061 in RRMS (p = 0.0004).
Table 2.
Group differences in WM FA and GM volume.
| Mean controls ± std dev | Mean RRMS ± std dev | Effect size d | p-Value | |
|---|---|---|---|---|
| Cingulum FA | 0.48 ± .03 | 0.45 ± .05 | 0.72 | 0.008 |
| Fornix FA | 0.32 ± .036 | 0.26 ± .06 | 0.94 | 0.0004 |
| Uncinate FA | 0.41 ± .03 | 0.39 ± .03 | 0.79 | 0.005 |
| Thalamic volume (mm3) | 20,945 ± 1286 | 18,872 ± 2049 | 1.02 | 0.0001 |
| Hippocampal volume (mm3)a | 8819 ± 1090 | 8304 ± 689 | 0.57 | 0.01 |
Hippocampal volumes reported previously (Gold etal., 2010).
Mean total left and right subcortical GM volumes were compared across groups after correcting for head size. RRMS had decreased mean total hippocampal volume as reported previously (Gold etal., 2010). RRMS also had decreased mean total thalamic volume compared to healthy controls (see Table 2).
To identify the most likely predictors of cognitive performance in RRMS patients, we assessed univariate associations with cognitive domain Z-score and the following structural and clinical variables: cingulum FA, fornix FA,UFFA, thalamic volume, hippocampal volume and BDI-II. See Supplemental Table 1 for univariate correlation matrix in RRMS. Associations with R > 0.30 were considered in multivariate regression models for each cognitive domain.
As predictors of attention/executive function Z-score, the regression model considered thalamic volume (R = 0.56), cingulum FA (R = 0.41), BDI-II (R = –0.40), uncinate FA (R = 0.40) and fornix FA (R = 0.39). Significant independent predictors included thalamic volume and BDI-II (std B1 = 0.539, std B2 = −0.350, adj R2 = 0.360, p = 0.002; see Fig. 3A). The association with thalamic volume was marginally stronger on the left, although significance was bilateral (Supplemental Table 2).
Fig. 3.
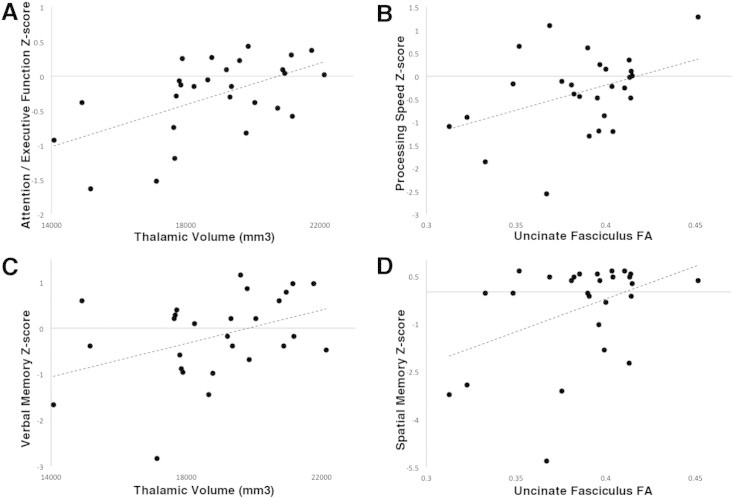
Structure–cognition scatterplots. Attention–executive function Z-score in RRMS patients is associated with thalamic volume (A). Processing speed Z-score is associated with uncinate FA (B). Verbal memory Z-score is associated thalamic volume (C). Spatial memory Z-score is associated with uncinate FA (D).
For the processing speed domain, uncinate FA (R = 0.40), thalamic volume (R = 0.37) and cingulum FA (R = 0.32) were considered in the regression model. The only significant independent predictor was UF FA (std B = 0.40, adj R2 = 0.129, p = 0.037; see Fig. 3B). The strength of the association was similar bilaterally but driven by RD (Supplemental Table 2).
For verbal memory performance, thalamic volume (R = 0.41) and fornix FA (R = 0.39) were considered as predictors in the regression model. Thalamic volume remained the only significant independent predictor (B = 0.387, adj R2 = 0.116, p = 0.046; see Fig. 3C). The univariate correlation only reached threshold on the left.
The model for spatial memory Z-score considered uncinate FA (R = 0.42) and BDI-II (R = –0.34) as predictors, and both were independently associated (std B1 = 0.513, std B2 = −0.393, adj R2 = 0.382, p = 0.001; see Fig. 3D). The UF association was driven by right RD (Supplemental Table 2).
4. Discussion
4.1. Interpretation
This study evaluated MS-related pathology in a limbic circuit invivo and its role in cognition in a group of RRMS patients with mild to minimal cognitive impairment, as indicated by reduced SDMT performance only. We hypothesized that damage to a thalamic–hippocampal–prefrontal circuit contributes to cognitive changes in RRMS. We demonstrated both reduced WM FA and subcortical GM atrophy in this circuit. Using linear regression we determined the relative contributions of each component to 4 cognitive domains within the MS group: attention/executive function, processing speed, verbal memory, and spatial memory. Attention/executive function was most closely associated with thalamic volume and depressive symptoms, processing speed was associated with UFFA, verbal memory was associated with thalamic volume and spatial memory was associated with UF FA and depressive symptoms.
Our cohort of early RRMS patients had mild to minimal cognitive impairment despite significant structural changes in each of the biomarkers we studied. While patients had no significant group differences in cognitive domains, they had lower SDMT scores, a test which has been shown to reflect cerebral dysfunction early on and is the most sensitive to MS pathology (Parmenter etal., 2007; Strober etal., 2009). The strong associations found between imaging structural biomarkers and cognitive performance, despite only mild impairment should prompt future longitudinal studies to assess their utility in predicting disease progression and monitoring treatment efficacy.
4.2. Thalamus
While each structure investigated is affected in MS, thalamic volume is a strong predictor of cognitive performance, particularly attention/executive function and verbal memory. Thalamic volume has previously been linked to multiple tests including the Controlled Word Association Test, Judgment Of Line Orientation, CVLT, the Brief Visuospatial Memory Test, PASAT, and the SDMT(Batista etal., 2012; Benedict etal., 2009; Houtchens etal., 2007). Although we did not find thalamic volume to independently predict processing speed (PASAT and SDMT) when included in the full regression, there was a moderate association (R = 0.37) in univariate analysis. This reflects the strong association between thalamic volume and brain white matter integrity (UF FA vs Thalamic Volume R = 0.47) due to its widespread connections, but also suggests that with a larger N this association may have reached significance. The thalamus communicates widely and reciprocally with both cortical and subcortical areas, thus thalamic atrophy contributes to multiple realms of cognitive deficits. Thalamic atrophy has been attributed to neuronal loss (Cifelli etal., 2002), however, whether this neuronal loss is due to direct immunological insult or secondary to axonal transection is unclear (Minagar etal., 2013).
4.3. Uncinate fasciculus
FA in the UF predicted both spatial memory Z-score and processing speed Z-score in RRMS. The UF communicates between medial temporal memory encoding structures and the frontal cortex. Mesaros etal. (2012) also showed spatial memory deficits linked to lesions in the UF using a random forest approach classifying cognitively impaired MS patients. They also demonstrated a role for the UF in visual processing speed, sustained attention, and verbal memory. Prior to this study, the UF has been identified as important for episodic verbal memory function on the CVLT across a cohort of MS patients and controls (Fink etal., 2010). Diehl etal. (2008) identified laterality in UF function in temporal lobe epilepsy, demonstrating left UF DTI metrics associated with verbal memory function and right UF DTI metrics associated with spatial memory function. In investigating laterality, we also found spatial memory to be more associated with the right UF.
4.4. Cingulum
Cingulum FA was associated with attention/executive function, but this relationship was not independent of thalamic volume or depressive symptoms. The indirect association may be due to its widespread cortical connections in distributed attentional networks. It has also been implicated in several other realms of cognitive performance in MS. Dineen etal. (2009) showed associations between cingulum FA and the PASAT, Benton Visual Retention Test (BVRT) and the California Verbal Learning Test II (CVLT-II). Yu etal. (2012) found reduced FA in the cingulum associated with the Rey Auditory Verbal Learning Test (RAVLT) and the SDMT. Mesaros etal. (2012) used a random forest analysis to demonstrate that cingulum DTI metrics were the best classifiers across numerous tests: PASAT, SDMT, 10/36 Spatial-Recall Test, BSRT, and Word List Generation. In contrast, we did not find cingulum FA to be an independent predictor of verbal or spatial memory, as these domains were better explained by thalamic volume, fornix FA,UFFA, and BDI-II score. We included the PASAT and SDMT in the processing speed domain in our study since these tests are both sensitive to cognitive changes in MS, and although cingulum FA showed a moderate correlation with the processing speed Z-score (R = 0.32), it was not independently predictive.
4.5. Fornix
The fornix is the primary hippocampal efferent and we previously found fornix insult to be associated with poor performance on an unrelated word-pairs task and adaptive increases in fMRI BOLD signal during the task in RRMS patients (Kern etal., 2012). In other studies the fornix has also been associated with MS differences on verbal memory tests including the CVLT-II(Dineen etal., 2009; Fink etal., 2010), the BVRT(Dineen etal., 2012) and the RAVLT(Yu etal., 2011). In this study weidentified a link between fornix FA and verbal memory performance, but this relationship was not independent of thalamic volume. Interestingly, thalamic volume and fornix FA were strongly associated (R = 0.72), as has been shown previously (Dineen etal., 2012), likely due to both direct and indirect hippocampal–anterior thalamic connections via the fornix, as well as their proximity within the 3rd ventricle. Third ventricular width has been previously identified as a marker for cognition and is associated with neocortical volume (Benedict etal., 2004).
4.6. Hippocampus
Similar to thalamic atrophy, hippocampal atrophy in MS is driven by neuronal loss, but demyelination is also evident (Papadopoulos etal., 2009). We previously found that subregional hippocampal volume correlates with verbal memory using an unrelated word-pairs task in a group of patients with verbal memory impairment (Sicotte etal., 2008), while others have found lateralized hippocampal associations with verbal memory on the left (Koenig etal., 2014; Pardini etal., 2014), and spatial memory on the right in MS(Pardini etal., 2014). But in this study we did not find an association independent of fornix FA or thalamic volume. However, in this study no patient had impaired verbal memory function. Thalamic atrophy and disruption of the fornix, a hippocampal–thalamic connection, may be earlier manifestations of verbal memory alterations in patients who are not yet impaired. Previous studies have shown a strong association between fornix DTI metrics and hippocampal volume (Koenig etal., 2014). Furthermore, altered hippocampal function may precede volume loss, also contributing to verbal memory deficits. We previously showed altered hippocampal fMRI activity during a verbal learning task that was associated with verbal memory performance and fornix FA, but independent of hippocampal volume (Kern etal., 2012), while Roosendaal etal. showed reduced interhemispheric hippocampal connectivity (Roosendaal etal., 2010).
4.7. Depression
We considered BDI-II score in our analysis as a confounder since depressive symptoms are common in MS and affect cognition (Heesen etal., 2010). This is evident in our sample since BDI-II scores were higher in RRMS patients. As reported previously from this sample, depressive symptoms did not correlate with total hippocampal volume but were significantly associated with smaller volumes in the hippocampal subregions CA2, CA3 and dentate gyrus (Gold etal., 2010). We recently replicated the association between depressive symptoms and hippocampal subregions in a larger sample (Gold etal., 2014). Depressive symptoms were not associated with other structural measures in this study, but were independently associated with lower scores in spatial memory and attention/executive function. These results highlight the importance of including measures of depressive symptoms when assessing cognitive performance. Associations between depressive symptoms and limbic circuit structural biomarkers may be more evident in patients diagnosed with major depressive disorder (MDD), as has been shown previously in patients without MS but with MDD who have reduced gray matter in the subgenual anterior cingulate cortex (Drevets etal., 2008). Future studies should include MS patients with and without MDD to better distinguish MS limbic pathology from MDD limbic pathology.
4.8. White matter lesions
RRMS patients had a relatively low average T2 lesion volume in this study, and we minimized the direct effects of WM lesions by deriving diffusion metrics from a WM skeleton of only the centermost voxels of each pathway. Lesion volume was associated with BSRT learning performance confirming the sensitivity of this test to MS pathology. However the global effect of lesions was not predictive of performance in specific cognitive domains, which may be more sensitive to localized insult to circuits such as a thalamic–hippocampal–prefrontal circuit. Identifying tract-specific insult in eloquent areas may better predict domain-specific cognitive changes than global measures such as T2 lesion volume.
4.9. Limitations
Our study has several limitations but also prompts future investigations. Unlike other DTI studies using non-hypothesis driven approaches or assessing brain-wideWM pathways, we limited our study to a thalamic–hippocampal–prefrontal circuit to investigate the relative contributions of each component in a group of early RRMS with mild to minimal cognitive impairment. In doing so we likely omitted important contributions from other affected structures in MS that also relate to cognitive dysfunction such as the corpus callosum (Yu etal., 2012), basal ganglia (Batista etal., 2012), and neocortex (Benedict etal., 2002). Another limitation is that we did not include a measure of fatigue, which is common in MS and known to affect cognition (Heesen etal., 2010).
Furthermore, while we identified components predictive of cognitive function, a better understanding of the temporal dynamics is needed. Thalamic atrophy is strongly linked to cognition, but perhaps FA changes can be detected earlier. We predict that thalamic atrophy occurs early in the disease but cannot say whether atrophy is due to primary GM insult or secondary to WM insult and Wallerian degeneration. Hippocampal atrophy may also occur secondary to thalamic insult or secondary to loss of hippocampal–thalamic connections. Longitudinal studies could distinguish these hypotheses.
4.10. Conclusions
Hippocampal–thalamic–prefrontal disruption affects cognitive function in RRMS before significant functional impairment is evident, confirming both white and gray matter involvement in MS and demonstrating utility in assessing functional networks to monitor cognition.
Uncited document objects
Source of funding
This project was funded through grants from the Foundation of the Consortium of Multiple Sclerosis Centers' MS Workforce of the Future program (KCK) and the National Multiple Sclerosis SocietyRG3914 (NLS). Stefan M. Gold is supported by a Heisenberg Fellowship from the German Research Society(GO 1357/4-1).
Appendix A. Supplementary data
Supplementary tables
References
- Aggleton J.P., Sahgal A. The contribution of the anterior thalamic nuclei to anterograde amnesia. Neuropsychologia. 1993;31(10):1001–1019. doi: 10.1016/0028-3932(93)90029-y. 8290019 [DOI] [PubMed] [Google Scholar]
- Amato M.P., Ponziani G., Siracusa G., Sorbi S. Cognitive dysfunction in early-onset multiple sclerosis: a reappraisal after 10 years. Arch. Neurol. 2001;58(10):1602–1606. doi: 10.1001/archneur.58.10.1602. 11594918 [DOI] [PubMed] [Google Scholar]
- Batista S., Zivadinov R., Hoogs M., Bergsland N., Heininen-Brown M., Dwyer M.G., Weinstock-Guttman B., Benedict R.H. Basal ganglia, thalamus and neocortical atrophy predicting slowed cognitive processing in multiple sclerosis. J. Neurol. 2012;259(1):139–146. doi: 10.1007/s00415-011-6147-1. 21720932 [DOI] [PubMed] [Google Scholar]
- Beck A.T., Guth D., Steer R.A., Ball R. Screening for major depression disorders in medical inpatients with the Beck Depression Inventory for Primary Care. Behav. Res. Ther. 1997;35(8):785–791. doi: 10.1016/s0005-7967(97)00025-9. 9256522 [DOI] [PubMed] [Google Scholar]
- Benedict R.H., Bakshi R., Simon J.H., Priore R., Miller C., Munschauer F. Frontalcortex atrophy predicts cognitive impairment in multiple sclerosis. J. Neuropsychiatry Clin. Neurosci. 2002;14(1):44–51. doi: 10.1176/jnp.14.1.44. 11884654 [DOI] [PubMed] [Google Scholar]
- Benedict R.H., Ramasamy D., Munschauer F., Weinstock-Guttman B., Zivadinov R. Memory impairment in multiple sclerosis: correlation with deep grey matter andmesial temporal atrophy. J. Neurol. Neurosurg. Psychiatry. 2009;80(2):201–206. doi: 10.1136/jnnp.2008.148403. 18829629 [DOI] [PubMed] [Google Scholar]
- Benedict R.H., Weinstock-Guttman B., Fishman I., Sharma J., Tjoa C.W., Bakshi R. Prediction of neuropsychological impairment in multiple sclerosis: comparison of conventional magnetic resonance imaging measures of atrophy and lesion burden. Arch. Neurol. 2004;61(2):226–230. doi: 10.1001/archneur.61.2.226. 14967771 [DOI] [PubMed] [Google Scholar]
- Benedict R.H., Zivadinov R. Risk factors for and management of cognitive dysfunction in multiple sclerosis. Nat. Rev. Neurol. 2011;7(6):332–342. doi: 10.1038/nrneurol.2011.61. 21556031 [DOI] [PubMed] [Google Scholar]
- Buschke H. Selective reminding for analysis of memory and learning. J. Verbal Learn. Verbal Behav. 1973;12(5):543–550. [Google Scholar]
- Cifelli A., Arridge M., Jezzard P., Esiri M.M., Palace J., Matthews P.M. Thalamic neurodegeneration in multiple sclerosis. Ann. Neurol. 2002;52(5):650–653. doi: 10.1002/ana.10326. 12402265 [DOI] [PubMed] [Google Scholar]
- Concha L., Beaulieu C., Gross D.W. Bilateral limbic diffusion abnormalities in unilateral temporal lobe epilepsy. Ann. Neurol. 2005;57(2):188–196. doi: 10.1002/ana.20334. 15562425 [DOI] [PubMed] [Google Scholar]
- Diehl B., Busch R.M., Duncan J.S., Piao Z., Tkach J., Lüders H.O. Abnormalities in diffusion tensor imaging of the uncinate fasciculus relate to reduced memory in temporal lobe epilepsy. Epilepsia. 2008;49(8):1409–1418. doi: 10.1111/j.1528-1167.2008.01596.x. 18397294 [DOI] [PubMed] [Google Scholar]
- Dineen R.A., Bradshaw C.M., Constantinescu C.S., Auer D.P. Extra-hippocampal subcortical limbic involvement predicts episodic recall performance in multiple sclerosis. PLOS One. 2012;7(10):e44942. doi: 10.1371/journal.pone.0044942. 23056187 [DOI] [PMC free article] [PubMed] [Google Scholar]
- Dineen R.A., Vilisaar J., Hlinka J., Bradshaw C.M., Morgan P.S., Constantinescu C.S., Auer D.P. Disconnection as a mechanism for cognitive dysfunction in multiple sclerosis. Brain. 2009;132(1):239–249. doi: 10.1093/brain/awn275. 18953055 [DOI] [PubMed] [Google Scholar]
- Drevets W.C., Savitz J., Trimble M. The subgenual anterior cingulate cortex in mood disorders. CNS Spectr. 2008;13(8):663–681. doi: 10.1017/s1092852900013754. 18704022 [DOI] [PMC free article] [PubMed] [Google Scholar]
- Erlanger D.M., Kaushik T., Caruso L.S., Benedict R.H., Foley F.W., Wilken J., Cadavid D., DeLuca J. Reliability of a cognitive endpoint for use in a multiple sclerosis pharmaceutical trial. J. Neurol. Sci. 2014;340(1–2):123–129. doi: 10.1016/j.jns.2014.03.009. 24656433 [DOI] [PubMed] [Google Scholar]
- Fink F., Eling P., Rischkau E., Beyer N., Tomandl B., Klein J., Hildebrandt H. The association between California verbal learning test performance and fibre impairment in multiple sclerosis: evidence from diffusion tensor imaging. Mult. Scler. 2010;16(3):332–341. doi: 10.1177/1352458509356367. 20150400 [DOI] [PubMed] [Google Scholar]
- Geurts J.J., Bö L., Pouwels P.J., Castelijns J.A., Polman C.H., Barkhof F. Cortical lesions in multiple sclerosis: combined postmortem MR imaging and histopathology. AJNR Am. J. Neuroradiol. 2005;26(3):572–577. 15760868 [PMC free article] [PubMed] [Google Scholar]
- Gold S.M., Kern K.C., O'Connor M.F., Montag M.J., Kim A., Yoo Y.S., Giesser B.S., Sicotte N.L. Smaller cornu ammonis 2–3/dentate gyrus volumes and elevated cortisol in multiple sclerosis patients with depressive symptoms. Biol. Psychiatry. 2010;68(6):553–559. doi: 10.1016/j.biopsych.2010.04.025. 20646680 [DOI] [PMC free article] [PubMed] [Google Scholar]
- Gold S.M., O'Connor M.F., Gill R., Kern K.C., Shi Y., Henry R.G., Pelletier D., Mohr D.C., Sicotte N.L. Detection of altered hippocampal morphology in multiple sclerosis-associated depression using automated surface mesh modeling. Hum. Brain Mapp. 2014;35(1):30–37. doi: 10.1002/hbm.22154. 22847919 [DOI] [PMC free article] [PubMed] [Google Scholar]
- Gronwall D.M. Paced auditory serial-addition task: a measure of recovery from concussion. Percept. Mot. Skills. 1977;44(2):367–373. doi: 10.2466/pms.1977.44.2.367. 866038 [DOI] [PubMed] [Google Scholar]
- Heesen C., Schulz K.H., Fiehler J., Von der Mark U., Otte C., Jung R., Poettgen J., Krieger T., Gold S.M. Correlates of cognitive dysfunction in multiple sclerosis. Brain Behav. Immun. 2010;24(7):1148–1155. doi: 10.1016/j.bbi.2010.05.006. 20621641 [DOI] [PubMed] [Google Scholar]
- Houtchens M.K., Benedict R.H., Killiany R., Sharma J., Jaisani Z., Singh B., Weinstock-Guttman B., Guttmann C.R., Bakshi R. Thalamic atrophy and cognition in multiple sclerosis. Neurology. 2007;69(12):1213–1223. doi: 10.1212/01.wnl.0000276992.17011.b5. 17875909 [DOI] [PubMed] [Google Scholar]
- Jenkinson M., Beckmann C.F., Behrens T.E., Woolrich M.W., Smith S.M. FSL. NeuroImage. 2012;62(2):782–790. doi: 10.1016/j.neuroimage.2011.09.015. 21979382 [DOI] [PubMed] [Google Scholar]
- Kern K.C., Ekstrom A.D., Suthana N.A., Giesser B.S., Montag M., Arshanapalli A., Bookheimer S.Y., Sicotte N.L. Fornix damage limits verbal memory functional compensation in multiple sclerosis. NeuroImage. 2012;59(3):2932–2940. doi: 10.1016/j.neuroimage.2011.09.071. 22001266 [DOI] [PubMed] [Google Scholar]
- Koenig K.A., Sakaie K.E., Lowe M.J., Lin J., Stone L., Bermel R.A., Beall E.B., Rao S.M., Trapp B.D., Phillips M.D. Hippocampal volume is related to cognitive decline and fornicial diffusion measures in multiple sclerosis. Magn. Reson. Imaging. 2014;32:354–358. doi: 10.1016/j.mri.2013.12.012. [DOI] [PMC free article] [PubMed] [Google Scholar]
- McDonald W.I., Compston A., Edan G., Goodkin D., Hartung H.P., Lublin F.D., McFarland H.F., Paty D.W., Polman C.H., Reingold S.C., Sandberg-Wollheim M., Sibley W., Thompson A., van den Noort S., Weinshenker B.Y., Wolinsky J.S. Recommended diagnostic criteria for multiple sclerosis: guidelines from the international panel on the diagnosis of multiple sclerosis. Ann. Neurol. 2001;50(1):121–127. doi: 10.1002/ana.1032. 11456302 [DOI] [PubMed] [Google Scholar]
- Mesaros S., Rocca M.A., Kacar K., Kostic J., Copetti M., Stosic-Opincal T., Preziosa P., Sala S., Riccitelli G., Horsfield M.A., Drulovic J., Comi G., Filippi M. Diffusion tensor MRI tractography and cognitive impairment in multiple sclerosis. Neurology. 2012;78(13):969–975. doi: 10.1212/WNL.0b013e31824d5859. 22377806 [DOI] [PubMed] [Google Scholar]
- Minagar A., Barnett M.H., Benedict R.H., Pelletier D., Pirko I., Sahraian M.A., Frohman E., Zivadinov R. The thalamus and multiple sclerosis: modern views on pathologic, imaging, and clinical aspects. Neurology. 2013;80(2):210–219. doi: 10.1212/WNL.0b013e31827b910b. 23296131 [DOI] [PMC free article] [PubMed] [Google Scholar]
- Noseworthy J.H., Lucchinetti C., Rodriguez M., Weinshenker B.G. Multiple sclerosis. N. Engl. J. Med. 2000;343(13):938–952. doi: 10.1056/NEJM200009283431307. 11006371 [DOI] [PubMed] [Google Scholar]
- Papadopoulos D., Dukes S., Patel R., Nicholas R., Vora A., Reynolds R. Substantial archaeocortical atrophy and neuronal loss in multiple sclerosis. Brain Pathol. 2009;19(2):238–253. doi: 10.1111/j.1750-3639.2008.00177.x. 18492094 [DOI] [PMC free article] [PubMed] [Google Scholar]
- Pardini M., Bergamino M., Bommarito G., Bonzano L., Luigi Mancardi G., Roccatagliata L. Structural Correlates of Subjective and Objective Memory Performance in Multiple Sclerosis. Hippocampus; 2014. 24375730 [DOI] [PubMed] [Google Scholar]
- Parmenter B.A., Weinstock-Guttman B., Garg N., Munschauer F., Benedict R.H. Screening for cognitive impairment in multiple sclerosis using the symbol digitmodalities test. Mult. Scler. 2007;13(1):52–57. doi: 10.1177/1352458506070750. 17294611 [DOI] [PubMed] [Google Scholar]
- Rao S.M., Leo G.J., Bernardin L., Unverzagt F. Cognitive dysfunction in multiplesclerosis. I. Frequency, patterns, and prediction. Neurology. 1991;41(5):685–691. doi: 10.1212/wnl.41.5.685. 2027484 [DOI] [PubMed] [Google Scholar]
- Rocca M.A., Mesaros S., Pagani E., Sormani M.P., Comi G., Filippi M. Thalamic damage and long-term progression of disability in multiple sclerosis. Radiology. 2010;257(2):463–469. doi: 10.1148/radiol.10100326. 20724544 [DOI] [PubMed] [Google Scholar]
- Roosendaal S.D., Geurts J.J., Vrenken H., Hulst H.E., Cover K.S., Castelijns J.A., Pouwels P.J., Barkhof F. Regional DTI differences in multiple sclerosis patients. NeuroImage. 2009;44(4):1397–1403. doi: 10.1016/j.neuroimage.2008.10.026. 19027076 [DOI] [PubMed] [Google Scholar]
- Roosendaal S.D., Hulst H.E., Vrenken H., Feenstra H.E., Castelijns J.A., Pouwels P.J., Barkhof F., Geurts J.J. Structural and functional hippocampal changes in multiple sclerosis patients with intact memory function. Radiology. 2010;255(2):595–604. doi: 10.1148/radiol.10091433. 20413769 [DOI] [PubMed] [Google Scholar]
- Rovaris M., Filippi M., Falautano M., Minicucci L., Rocca M.A., Martinelli V., Comi G. Relation between MR abnormalities and patterns of cognitive impairment in multiple sclerosis. Neurol. 1998;50(6):1601–1608. doi: 10.1212/wnl.50.6.1601. 9633700 [DOI] [PubMed] [Google Scholar]
- Rovaris M., Iannucci G., Falautano M., Possa F., Martinelli V., Comi G., Filippi M. Cognitive dysfunction in patients with mildly disabling relapsing–remitting multiple sclerosis: an exploratory study with diffusion tensor MR imaging. J. Neurol. Sci. 2002;195(2):103–109. doi: 10.1016/s0022-510x(01)00690-6. 11897239 [DOI] [PubMed] [Google Scholar]
- Sepulcre J., Vanotti S., Hernández R., Sandoval G., Cáceres F., Garcea O., Villoslada P. Cognitive impairment in patients with multiple sclerosis using the brief repeatable battery-neuropsychology test. Mult. Scler. 2006;12(2):187–195. doi: 10.1191/1352458506ms1258oa. 16629422 [DOI] [PubMed] [Google Scholar]
- Sicotte N.L., Kern K.C., Giesser B.S., Arshanapalli A., Schultz A., Montag M., Wang H., Bookheimer S.Y. Regional hippocampal atrophy in multiple sclerosis. Brain. 2008;131(4):1134–1141. doi: 10.1093/brain/awn030. 18375977 [DOI] [PubMed] [Google Scholar]
- Smith A. Symbol Digit Modalities Test: Manual. Western Psychological Corporation; 2002. [Google Scholar]
- Strober L., Englert J., Munschauer F., Weinstock-Guttman B., Rao S., Benedict R.H. Sensitivity of conventional memory tests in multiple sclerosis: comparing the Raobrief repeatable neuropsychological battery and the minimal assessment of cognitive function in MS. Mult. Scler. 2009;15:1077–1084. doi: 10.1177/1352458509106615. 19556311 [DOI] [PubMed] [Google Scholar]
- Wakana S., Caprihan A., Panzenboeck M.M., Fallon J.H., Perry M., Gollub R.L., Hua K., Zhang J., Jiang H., Dubey P., Blitz A., van Zijl P., Mori S. Reproducibility of quantitative tractography methods applied to cerebral white matter. NeuroImage. 2007;36(3):630–644. doi: 10.1016/j.neuroimage.2007.02.049. 17481925 [DOI] [PMC free article] [PubMed] [Google Scholar]
- Wang R., Benner T., Sorensen A.G., Wedeen V.J. Diffusion toolkit: a software package for diffusion imaging data processing and tractography. Proc. Int. Soc. Magn. Reson. Med. 2007:3720. [Google Scholar]
- Wechsler D. A standardized memory scale for clinical use. J. Psychol. 1945;19(1):87–95. [Google Scholar]
- Yu H.J., Christodoulou C., Bhise V., Greenblatt D., Patel Y., Serafin D., Maletic-Savatic M., Krupp L.B., Wagshul M.E. Multiple white matter tract abnormalities underlie cognitive impairment in RRMS. NeuroImage. 2012;59:3713–3722. doi: 10.1016/j.neuroimage.2011.10.053. 22062194 [DOI] [PubMed] [Google Scholar]
Associated Data
This section collects any data citations, data availability statements, or supplementary materials included in this article.
Supplementary Materials
Supplementary tables