

Abstract
Introduction: Programmed cell death protein 1 (PD-1) and programmed death-ligand 1 (PD-L1) play a major role in suppressing the immune system during the formation of the PD-1/PD-L1 pathway, which transmits an inhibitory signal to reduce T cell activity. PD-L1 is often expressed in various malignant tumors. In contrast, PD-1 is generally observed in activated lymphocytes and myeloid-derived dendritic cells. Of the malignant cells, only Jurkat cells under special conditions and angioimmunoblastic T-cell lymphoma tissue cells express PD-1 on their surface. Methods: To clarify whether the PD-1/PD-L1 pathway participates in the immunotolerance of small-cell lung cancer (SCLC) cells, we examined the expressions of PD-1 and PD-L1 on the cell surface of SCLC cell lines using flow cytometry and reverse transcription polymerase chain reaction. Results: Among the four SCLC cell lines examined, only SBC-3 expressed both PD-1 and PD-L1. Conclusions: We demonstrated that both PD-1 and PD-L1 molecules were co-expressed on the surface of SCLC cells. Although the biological implications of this remain unclear, we speculate that PD-1 and its ligand on the SCLC cells may participate in the growth inhibition of tumor cells as reported in cytotoxic T cells.
Keywords: Small-cell lung cancer, cell line, PD-1, PD-L1, co-expression
Introduction
Programmed cell death protein 1 (PD-1) is a 288 amino acid, cell surface molecule that has been designated as a membrane protein of the immunoglobulin superfamily in humans. This protein is expressed on T cells, pro-B cells, and myeloid-derived dendritic cells, leading to negative regulation of the proliferation and activity of these cells [1]. Programmed death ligand 1 (PD-L1) is a 40-kDa type 1 transmembrane protein, which plays a major role in suppressing the immune system in cases of autoimmune disease and viral infections [2]. In the field of tumor immunology, PD-L1 is mainly expressed on the cell surface of tumor cells or antigen presenting cells; the formation of the PD-1/PD-L1 complex transmits an inhibitory signal that reduces the proliferation and activity of killer T lymphocytes [3]. In contrast, PD-1 is generally observed in activated lymphocytes and myeloid-derived dendritic cells. Of the malignant cells, only Jurkat cells, which are T-cell leukemia cells producing interleukin-2 under special conditions, and angioimmunoblastic T-cell lymphoma tissue cells express PD-1 on their surface [4,5]. Here we demonstrated that both PD-1 and PD-L1 molecules are co-expressed on the surface of small-cell lung cancer (SCLC) cells.
Materials and methods
Cell lines
The SCLC cell lines SBC-3 (JCRB0818), SBC-5 (JCRB0819), SBC-7, and SBC-9a were established in our laboratories [6]. All cell lines were maintained in tissue culture flasks at 37°C under a humidified atmosphere supplemented with 5% CO2. The culture medium used in this study was RPMI-1640 (Life Technologies, Inc., Grand Island, NY, USA) supplemented with 10% fetal bovine serum (FBS) (ICN Biomedicals Japan Co., Ltd., Tokyo, Japan), penicillin-G (100 U/ml), and streptomycin (100 μg/ml).
Antibodies
Monoclonal antibodies (mAbs) for flow cytometry used in this study are as follows: anti-mouse PD-1 Armenian hamster mAb [clone J43] (biotin labeled) (Abcam plc, Cambridge, UK), anti-human PD-1 mouse mAb [clone J110] phycoerythrin (PE)-conjugated (Medical & Biological Laboratories Co., Ltd., Nagoya, Japan), anti-mouse PD-L1 rat mAb [clone MIH5] PE-conjugated (Fitzgerald Industries International, North Acton, MA, USA), anti-human PD-L1 mouse mAb [clone MIH2] PE-conjugated (LifeSpan BioSciences, Inc., Seattle, WA, USA), anti-human CD34 mouse mAb [clone 581] PE-Cyanine 5.5-conjugated (Life Technologies Japan, Tokyo, Japan). Goat anti-mouse IgG1 polyclonal antibody (Genway Biotech, Inc, San Diego, CA, USA) was used as a negative control. Streptavidin-fluorochrome conjugates (Streptavidin-FITC) were used as a secondary antibody for flow cytometry (Bioscience Inc., Cleveland, OH, USA).
Flow cytometry
Cultured cells were incubated with specific mAbs or control polyclonal Ab for 30 min at 4°C and were washed thrice with phosphate-buffered saline (PBS) containing 0.2% FBS and 0.01% azide. For the J43 mAb, after washing, cells were incubated with streptavidin-fluorochrome conjugates for 20 min at 4°C and were washed thrice with PBS containing 0.2% FBS and 0.01% azide. Flow cytometry was performed on a FACSverse (Becton Dickinson, CA, USA), and the data were analyzed with FACSuite software (Becton Dickinson). To quantify the expressions of PD-1, PD-L1, and CD34 on each cell line, the ratio of the mean fluorescence intensity (MFI) between test and control events was used [6]. This ratio corresponded to the distance between the test and control MFI on a logarithmic scale. The expression levels of PD-1, PD-L1, and CD34 on each cell line were calculated as follows: 10^[log (MFI tested)]/10^[log (control MFI)] = 10^[log (MFI tested) - log (control MFI)].
Messenger RNA expression analysis
Messenger RNA (mRNA) expression of PD-1 and PD-L1 were analyzed by quantitative reverse transcription-polymerase chain reaction (qRT-PCR) of cDNA using primer and probes sets and TaqMan Universal PCR Master Mix (Applied Biosystems, Foster, CA, USA), according to the manufacturer’s protocol. Primer and probe sets were as follows: PD-1, Hs01550088_m1; PD-L1, Hs01125301_m1; and GAPDH, Hs99999905_m1. PCR amplification was performed on a StepOne Plus Real-Time PCR Instrument (Applied Biosystems), and gene expression was calculated using the comparative CT method. Triplicate samples were assayed for each gene. To quantify the relative changes in gene expression, reactions were normalized to expression levels of the endogenous control gene GAPDH.
Results
Flow ctometric analysis
Figure 1 reveals the results of flow cytometry (single color analysis) of PD-1 and PD-L1 molecules on SBC-3 cells. Because we previously reported that CD34 antigen is highly expressed on the cell surface of SBC-3 cells [7] (Figure 2C), anti-human CD34 mouse mAb was used as a positive control, and goat anti-mouse IgG1 antibody was used as a negative control. Figure 1A shows that the PD-L1 molecule was weakly expressed on the cell surface of SBC-3 cells. Although CD34 as a positive control (red line) was strongly expressed on the cell surface of SBC-3 cells and the average ratio of MFI of CD34 was 24.93 (Figures 1A and 2C), the expression level of PD-L1 molecules on SBC-3 cells was weak, and the average ratio of MFI of PD-L1 molecules was 1.068 (Figures 1A and 2B). These experiments were repeated four times, and the results were similar every time. Furthermore, because the normal distribution curve of PD-L1 (blue line) always shifted to the right side compared with the negative control (Figure 1A), we judged that PD-L1 was weakly but evidently expressed on the cell surface of SBC-3 cells.
Figure 1.
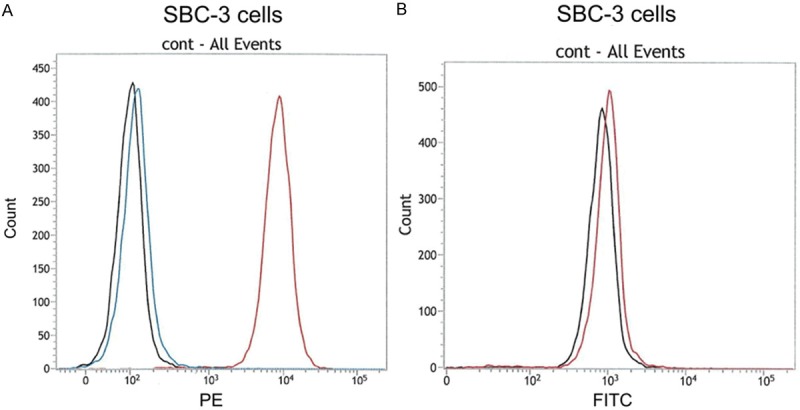
Flow cytometric analysis (single color analysis) of PD-1 and PD-L1 molecules on SBC-3 cells. A. Black line: negative control (anti-mouse IgG1), blue line: anti-human PD-L1, red line: positive control (anti-human CD34). PD-L1 was weakly expressed on the cell surface of SBC-3 cells. B. Black line: negative control (anti-mouse IgG1), blue line: anti-human PD-1. PD-1 was weakly positive on the cell surface of SBC-3 cells. Both PD-1 and PD-L1 may be co-expressed on the cell surface of some SCLC cell lines.
Figure 2.
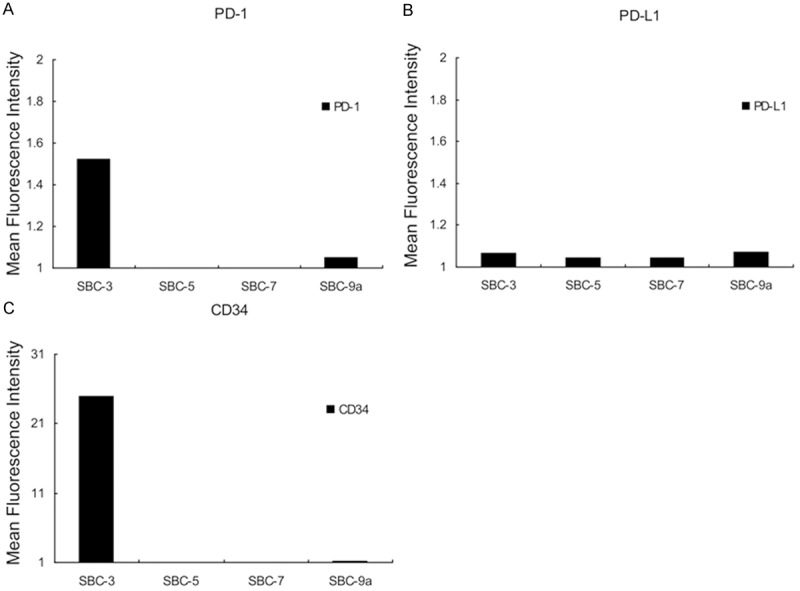
Summary of flow cytometric analysis of SCLC cell lines. A. Anti-human PD-1: PD-1 molecule was positively detected in SBC-3 and SBC-9a cells. The expression levels of PD-1 molecules on SBC-5 and SBC-7 cells were relatively low compared with SBC-3 and SBC-9a cells. Thus, PD-1 molecule was not expressed on the cell-surface of these cell lines. B. Anti-human PD-L1: PD-L1 molecule was weakly expressed on the cell-surface of all cell lines examined in this experiment. C. Anti-human CD34: positive control.
Figure 1B shows that PD-1 molecules were also expressed on the SBC-3 cells. As observed in the experiments of PD-L1 molecules, the normal distribution curve of PD-1 (red line) always shifted to the right side compared with negative control (black line). We judged that PD-1 was expressed weakly on the cell surface of SBC-3 cells (Figure 1B). These results suggest the possibility of co-expression of both PD-1 and PD-L1 molecules on the epithelial cancer cell line.
Flow cytometric analysis using four cell lines is summarized in Figure 2. Expression levels of PD-1 and PD-L1 were calculated using the formula described above. Among the four SCLC cell lines, the cell surface expression of PD-1 molecule was confirmed in two cell lines: SBC-3 and SBC-9a (Figure 2A). In contrast, PD-L1 molecules were expressed weakly in all the cell lines (Figure 2B).
Quantitative reverse transcription-polymerase chain reaction
The results obtained from our flow cytometric analysis were confirmed by qRT-PCR. The expression levels of GAPDH in each cell line were used as positive controls. As shown in Figure 3 (lanes 2 and 4), PD-1 and PD-L1 mRNAs were detected in SBC-3 cells. In contrast, PD-L1 mRNA was weakly observed on SBC-5, but PD-1 mRNA was not detected at all (lanes 3 and 5). Mean threshold cycles of each DNA product in this experiment were as follows: SBC-3, PD-L1: 35.78; SBC-3, PD-1: 25.99; SBC-3, GAPDH: 21.45; SBC-5, PD-L1: 32.32; SBC-5, PD-1: 0.00; and SBC-5, GAPDH: 19.87. The findings also indicate that both PD-1 and PD-L1 may be co-expressed on the cell surface of SCLC cells.
Figure 3.
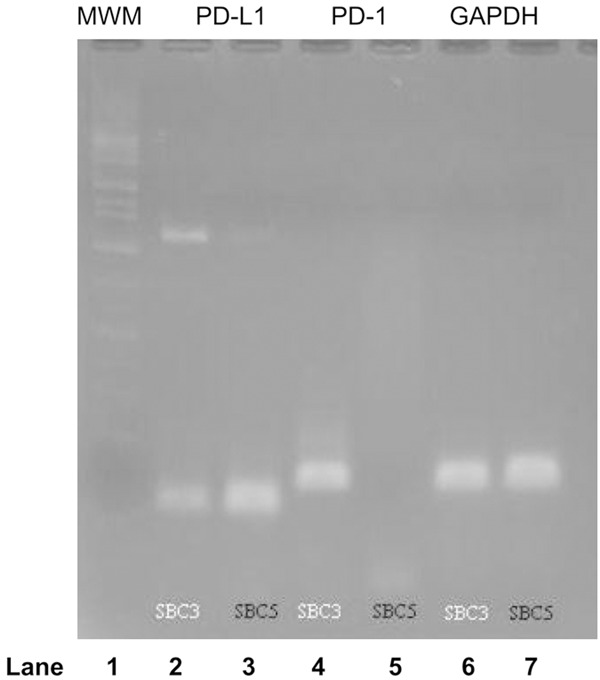
RT-PCR of PD-1 and PD-L1 mRNAs. Lane 1: Molecular weight marker. Lane 2: PD-L1 expression on SBC-3 cells. Lane 3: PD-L1 expression on SBC-5 cells. Lane 4: PD-1 expression on SBC-3 cells. Lane 5: PD-1 expression on SBC-5 cells. Lane 6: GAPDH expression on SBC-3 cells. Lane 7: GAPDH expression on SBC-5 cells. The mRNAs of PD-1 and PD-L1 were detected in SBC-3 cells (lanes 2 and 4). Although PD-L1 mRNA was detected clearly in lane 3, PD-1 mRNA was not detected in lane 5. The expressions on lanes 6 and 7 were used as positive controls.
Discussion
The PD-1/PD-L1 pathway appears to be a critical therapeutic target for a variety of diseases. Of the malignant tumors, this pathway participates in immunotolerance and negatively controls antigen-specific T-cell activity through the T-cell receptor and major histocompatibility complex [8]. Furthermore, clinical trials have demonstrated that PD-1 or PD-L1 antibodies have antitumor activities in the treatment of solid tumors, including non-small cell lung cancer [8-10]. Their findings may be explained by destruction of immunotolerance and activation of T cell-mediated antitumor effects. Numerous investigations regarding the PD-1/PD-L1 pathway have been conducted to clarify the main role as an immune checkpoint modifier. PD-1 and PD-L1 are supposed to be the molecules responsible for activating T cell-mediated tumor lysis [11-13]. The findings in our experiments indicate that these molecules may participate in the self-regulation of epithelial tumor cell growth. On activated T cells, Src homology 2-domain containing tyrosine phosphotase 2 (SHP-2; dephosphorylates a variety of molecules, which is located downstream of the PD-1 molecule, is recruited to inhibit T cell receptor-mediated signaling [14]. To the best of our knowledge, there is no other report describing that both PD-1 and PD-L1 molecules are co-expressed on SCLC cell lines. It will be interesting to elucidate downstream signals of PD-1 molecules on the cell surface of SBC-3 cells. Although the biological implications of the co-expression remain unclear, we speculate that PD-1 and its ligand on the SCLC cells may participate in the growth inhibition of tumor cells as is reported in cytotoxic T cells.
Acknowledgements
This work was supported in part by a Research Project Grant, 25-B-22, from the Kawasaki Medical School.
Disclosure of conflict of interest
ALL the authors confirm that this article content has no conflicts of interest.
References
- 1.Agata Y, Kawasaki A, Nishimura H, Ishida Y, Tsubata T, Yagita H, Honjo T. Expression of the PD-1 antigen on the surface of stimulated mouse T and B lymphocytes. Int Immunol. 1996;5:765–772. doi: 10.1093/intimm/8.5.765. [DOI] [PubMed] [Google Scholar]
- 2.Iwai Y, Terawaki S, Ikegawa M, Okazaki T, Honjo T. PD-1 inhibits antiviral immunity at the effector phase in the liver. J Exp Med. 2003;198:39–50. doi: 10.1084/jem.20022235. [DOI] [PMC free article] [PubMed] [Google Scholar]
- 3.Freeman GJ, Long AJ, Iwai Y, Bourque K, Chernova T, Nishimura H, Fitz LJ, Malenkovich N, Okazaki T, Byrne MC, Horton HF, Fouser L, Carter L, Ling V, Bowman MR, Carreno BM, Collins M, Wood CR, Honjo T. Engagement of the PD-1 immunoinhibitory receptor by a novel B7 family member leads to negative regulation of lymphocyte activation. J Exp Med. 2000;192:1027–1034. doi: 10.1084/jem.192.7.1027. [DOI] [PMC free article] [PubMed] [Google Scholar]
- 4.Dorfman DM, Brown JA, Shahsafaei A, Freeman GJ. Programmed death-1 (PD-1) is a marker of germinal center-associated T cells and angioimmunoblastic T-cell lymphoma. Am J Surg Pathol. 2006;7:802–810. doi: 10.1097/01.pas.0000209855.28282.ce. [DOI] [PMC free article] [PubMed] [Google Scholar]
- 5.Chen J, Wu XJ, Wang GQ. Hepatoma cells up-regulate expression of programmed cell death-1 on T cells. World J Gastroenterol. 2008;44:6853–6857. doi: 10.3748/wjg.14.6853. [DOI] [PMC free article] [PubMed] [Google Scholar]
- 6.Tsuchida T, Yamane H, Ochi N, Tabayashi T, Hiraki A, Nogami N, Takigawa N, Kiura K, Tanimoto M. Cytotoxicity of activated natural killer cells and expression of adhesion molecules in small-cell lung cancer. Anticancer Res. 2012;32:887–892. [PubMed] [Google Scholar]
- 7.Yamane H, Kiura K, Tabata M, Bessho A, Tsuchida T, Motoda K, Hiraki A, Ueoka H, Harada M. Small-cell lung cancer can express CD34 antigen. Anticancer Res. 1997;17:3627–3632. [PubMed] [Google Scholar]
- 8.Topalian SL, Hodi FS, Brahmer JR, Gettinger SN, Smith DC, McDermott DF, Powderly JD, Carvajal RD, Sosman JA, Atkins MB, Leming PD, Spigel DR, Antonia SJ, Horn L, Drake CG, Pardoll DM, Chen L, Sharfman WH, Anders RA, Taube JM, McMiller TL, Xu H, Korman AJ, Jure-Kunkel M, Agrawal S, McDonald D, Kollia GD, Gupta A, Wigginton JM, Sznol M. Safety, activity, and immune correlates of anti-PD-1 antibody in cancer. N Engl J Med. 2012;366:2443–2454. doi: 10.1056/NEJMoa1200690. [DOI] [PMC free article] [PubMed] [Google Scholar]
- 9.Sznol M, Chen L. Antagonist antibodies to PD-1 and B7-H1 (PD-L1) in the treatment of advanced human cancer. Clin Cancer Res. 2013;19:1021–1034. doi: 10.1158/1078-0432.CCR-12-2063. [DOI] [PMC free article] [PubMed] [Google Scholar]
- 10.Brahmer JR, Drake CG, Wollner I, Powderly JD, Picus J, Sharfman WH, Stankevich E, Pons A, Salay TM, McMiller TL, Gilson MM, Wang C, Selby M, Taube JM, Anders R, Chen L, Korman AJ, Pardoll DM, Lowy I, Topalian SL. Phase I study of single-agent anti-programmed death-1 (MDX-1106) in refractory solid tumors: safety, clinical activity, pharmacodynamics, and immunologic correlates. J. Clin. Oncol. 2010;28:3167–3175. doi: 10.1200/JCO.2009.26.7609. [DOI] [PMC free article] [PubMed] [Google Scholar]
- 11.Brown JA, Dorfman DM, Ma FR, Sullivan EL, Munoz O, Wood CR, Greenfield EA, Freeman GJ. Blockade of programmed death-1 ligands on dendritic cells enhances T cell activation and cytokine production. J Immunol. 2003;170:1257–1266. doi: 10.4049/jimmunol.170.3.1257. [DOI] [PubMed] [Google Scholar]
- 12.Nomi T, Sho M, Akahori T, Hamada K, Kubo A, Kanehiro H, Nakamura S, Enomoto K, Yagita H, Azuma M, Nakajima Y. Clinical significance and therapeutic potential of the programmed death-1 ligand/programmed death-1 pathway in human pancreatic cancer. Clin Cancer Res. 2007;13:2151–2157. doi: 10.1158/1078-0432.CCR-06-2746. [DOI] [PubMed] [Google Scholar]
- 13.Duraiswamy J, Freeman GJ, Coukos G. Therapeutic PD-1 pathway blockade augments with other modalities of immunotherapy T-cell function to prevent immune decline in ovarian cancer. Cancer Res. 2013;73:6900–6912. doi: 10.1158/0008-5472.CAN-13-1550. [DOI] [PMC free article] [PubMed] [Google Scholar]
- 14.Okazaki T, Maeda A, Nishimura H, Kurosaki T, Honjo T. PD-1 immunoreceptor inhibits B cell receptor-mediated signaling by recruiting src homology 2-domain- containing tyrosine phosphatase 2 to phosphotyrosine. Proc Natl Acad Sci U S A. 2001;98:13866–13871. doi: 10.1073/pnas.231486598. [DOI] [PMC free article] [PubMed] [Google Scholar]