

Abstract
During general anesthesia, global brain activity and behavioral state are profoundly altered. Yet it remains mostly unknown how anesthetics alter sensory processing across cortical layers and modulate functional cortico-cortical connectivity. To address this gap in knowledge of the micro- and mesoscale effects of anesthetics on sensory processing in the cortical microcircuit, we recorded multiunit activity and local field potential in awake and anesthetized ferrets (Mustela putoris furo) during sensory stimulation. To understand how anesthetics alter sensory processing in a primary sensory area and the representation of sensory input in higher-order association areas, we studied the local sensory responses and long-range functional connectivity of primary visual cortex (V1) and prefrontal cortex (PFC). Isoflurane combined with xylazine provided general anesthesia for all anesthetized recordings. We found that anesthetics altered the duration of sensory-evoked responses, disrupted the response dynamics across cortical layers, suppressed both multimodal interactions in V1 and sensory responses in PFC, and reduced functional cortico-cortical connectivity between V1 and PFC. Together, the present findings demonstrate altered sensory responses and impaired functional network connectivity during anesthesia at the level of multiunit activity and local field potential across cortical layers.
Keywords: anesthesia, ferret, isoflurane, frequency structure, prefrontal cortex
most of what we understand about the processing of sensory signals in the brain rests on studies in anesthetized animals (Gilbert 1977; Hubel and Wiesel 1959). An implicit assumption, which has remained mostly unchallenged, is that circuits of basic sensory processing are comparatively spared from the effects of anesthetics, in contrast to higher-order cortical areas. Yet general anesthesia profoundly alters global brain function. In particular, anesthetics alter the temporal structure of brain activity (Lennox 1949) and may thereby disrupt information processing that relies on precise timing of neuronal activity and functional interactions between brain areas. Impairment of dynamic interactions within and between neuronal circuits may represent a key mechanism by which anesthetics alter overall cognitive and behavioral states (Alkire 2008; Heinke and Koelsch 2005; Kreuzer et al. 2010; Lee et al. 2013; White and Alkire 2003). Noninvasive imaging and EEG studies have provided support for impaired large-scale organization of spontaneous (“resting”) activity across brain areas in humans (John et al. 2001; Moeller et al. 2009) (but see Vincent et al. 2007). These findings have precipitated a new model of the network-level mechanism of action of anesthetics; in this model, information processing is impaired by alterations of large-scale network dynamics and functional connectivity during anesthesia (Alkire et al. 2008). Yet, the underlying alterations to micro- and mesoscale cortical circuit function, in particular during sensory processing, remain little studied.
To close this gap in knowledge, we asked if and how response dynamics and functional connectivity of sensory processing are altered during anesthesia. To answer this question, we measured mesoscopic [local field potential (LFP)] and microscopic [multiunit activity (MUA)] network dynamics simultaneously across cortical layers during presentation of visual stimuli in primary visual cortex (V1) and prefrontal cortex (PFC) of awake and anesthetized ferrets. Investigating both mesoscopic and microscopic network dynamics provided deeper insight into overall neuronal activity patterns, since mesoscopic LFP activity reflects synaptic currents which do not necessarily result in local suprathreshold activity, while microscopic MUA represents suprathreshold input to recorded neurons. Anesthetized recordings utilized three concentrations of isoflurane (iso) (each with a constant xylazine infusion). Our study first focused on V1, since V1 is well-suited for elucidating differential effects of anesthetics across cortical layers, given the extensive body of work examining the distinct role of each cortical layer in sensory function (Binzegger et al. 2009; Hirsch and Martinez 2006). To test large-scale interaction dynamics within cortico-cortical circuits, we then probed the response dynamics in PFC and subsequently directly measured functional connectivity between V1 and PFC by simultaneous recordings in both areas.
MATERIALS AND METHODS
Surgery.
Adolescent female ferrets (Mustela putoris furo, 15–20 wk old at study onset, 750–1,000 g) were used in this study (awake: n = 14 animals; anesthetized: n = 10 animals). Details of the animal model and recording methods were described previously (Sellers et al. 2013, 2015). All animals underwent aseptic surgery in preparation for subsequent electrophysiological recordings in V1 and PFC. All electrophysiology was conducted with acute insertions of recording electrodes. General anesthesia was induced with an initial intramuscular injection of ketamine (30 mg/kg) and xylazine (1–2 mg/kg). The method of anesthesia maintenance used during surgery depended upon the specific experimental preparation: ketamine/xylazine for implantation of recording chambers (awake group) and iso/xylazine for acute recordings. The choice of drugs and doses was designed to achieve general anesthesia throughout surgery and the anesthetized recordings, with complete absence of withdrawal response to toe pinch as an assay of anesthetic depth (assessed prior to administration of vecuronium bromide). This fulfilled requirements by the local Institutional Animal Care and Use Committee (IACUC). Physiological monitoring included electrocardiogram, peripheral capillary oxygen saturation, rectal body temperature, and end-tidal CO2. A water heating blanket was used to maintain animal temperature between 38.0 and 39.0°C, and, when measured, end-tidal CO2 was between 30 and 50 mmHg (Kohn 1997). Paralube was used to protect the eyes for the duration of the surgery.
Surgical procedures consisted of an initial midline incision of the scalp, retraction of the soft tissue, and a circular craniotomy located over left V1 (∼3 mm anterior to lambda and 9 mm lateral to the midline) and/or left PFC (∼5 mm anterior to bregma and 2 mm lateral to the midline, rostral anterior sigmoid gyrus) (Duque and McCormick 2010) (Fig. 1B). The potential for brain swelling was reduced with a preventative injection of furosemide (1 mg/kg im). After removal of dura, the brain was covered with warm, sterile 4% agar. A stainless steel head post was implanted with bone screws and dental cement. All procedures were approved by the University of North Carolina-Chapel Hill IACUC and exceed the guidelines set forth by the National Institutes of Health and US Department of Agriculture.
Fig. 1.

Multichannel electrophysiology in primary visual cortex (V1) and prefrontal cortex (PFC) of awake and anesthetized ferrets during presentation of visual stimuli. A, top: full-field visual stimuli were presented to awake and anesthetized head-fixed ferrets. Bottom: each trial of visual stimulation consisted of 10 s of dark (spontaneous activity), 10 s of checkerboard frozen noise with abrupt transitions to a new pattern every second, and 10 s of dark again. B: local field potential (LFP) and multiunit activity (MUA) were recorded in V1 (lateral gyrus) and PFC (rostral anterior sigmoid gyrus, 2 mm from the midline) during presentation of sensory stimuli. C: the use of multichannel depth probes allowed for simultaneous recordings across all cortical layers. Current source density (CSD) analysis was used to determine the depth of putative supragranular, granular, and infragranular layers. The top sink/source pair was indicative of putative granular layer IV. The figure depicts a representative CSD for one recording location in an awake animal. D: receptive field mapping was conducted to provide functional verification of electrode position in V1. Figure depicts a representative receptive field map for one recording electrode for an animal anesthetized with 1.0% isoflurane (iso) and xylazine. Map depicts visual field covered by computer monitor that spanned classical receptive fields and a large amount of surrounding visual space (full-field visual stimulation). E: histological examination to verify electrode location in PFC. Left: electrode track location (electrode dipped in DiI prior to insertion) in representative coronal section of PFC. MU, multiunit. Right: neighboring coronal section (Nissl stain).
Procedures in awake animals.
Prior to recordings in animals that were awake (“awake recordings”), there was an initial phase of habituation to restraint, followed by surgical implantation of the recording chamber to access the craniotomy, and finally a period for full recovery of at least 5 days. The animals were habituated to be calmly restrained for up to 2 h in the recording apparatus. General anesthesia during surgery was maintained by intramuscular injections of ketamine (30 mg/kg) and xylazine (1–2 mg/kg) approximately every 40 min. The base of a custom-fabricated cylindrical chamber with a removable cap (material: Ultem 1000) was secured to the skull with bone screws and dental cement to allow subsequent access to the craniotomy for recordings. Upon completion of these surgical procedures, the incision was closed with sutures and treated with antibiotic cream. Yohimbine (0.25–0.5 mg/kg im) was administered for emergence; the animal was kept warm with a heating blanket and observed during recovery. Meloxicam (0.2 mg/kg im) and enrofloxacin (5 mg/kg im) were administered to prevent infection and to minimize postsurgical discomfort.
Procedures in anesthetized animals.
Prior to recordings in anesthetized animals (“anesthetized recordings”), general anesthesia was induced with an intramuscular injection of ketamine (30 mg/kg) and xylazine (1–2 mg/kg), and the animals were intubated and mechanically ventilated (10–11 ml, 50 beats/min, 100% medical grade oxygen). Eyes were kept lubricated with sterile saline (applied at the beginning of the wait period for anesthesia stabilization), and vital signs were monitored throughout recording. Any effect from ketamine administered during induction was minimal as multiple hours elapsed prior to the start of electrophysiological recordings, and the elimination half-life of ketamine has been reported to be 45–60 min (Davidson and Plumb 2003).
General anesthesia was maintained with iso (0.5%, 0.75%, 1.0%) and a constant infusion of xylazine. Intravenous access was established in the cephalic vein, and fluids included 4.25 ml/h 5% dextrose lactated Ringer's with 1.5 mg·kg−1·h−1 xylazine. To optimize electrophysiological stability, 0.79 mg·kg−1·h−1 vecuronium bromide was added during some recordings. The temporal order of iso concentrations was randomized across animals to control for changes related to continuous infusion of xylazine. At least 20 min elapsed after changing anesthetic concentration prior to starting a new recording, exceeding the amount of time required in our setup for the LFP to stabilize at the new anesthetic concentration.
We were interested in assessing differences in sensory-evoked activity over a range of anesthetic depths that each maintained general anesthesia. Informally in the course of pilot experiments, all dosing achieved loss of the righting reflex, but systematic assessment during the recordings was technically not feasible. The dosing used did not induce long periods of isoelectric brain activity.
Visual and auditory stimulation and multichannel electrophysiology.
We recorded LFP and MUA in response to visual and auditory stimulation. In a first set of experiments, multichannel electrophysiological data were recorded with acutely inserted, linear silicon depth probes that simultaneously recorded neuronal activity in all cortical layers [32 channels, 50-μm contact site spacing along the z-axis for single craniotomies; two 16-channel probes, 100-μm contact site spacing along the z-axis for dual craniotomies, one in V1 and one in PFC (Neuronexus, Ann Arbor, MI)]. For 32-channel probes, the reference electrode was located on the same shank (0.5 mm above the top recording site) and was positioned in 4% agar in saline above the brain. A silver chloride wire tucked between the skull and soft tissue and held in place with 4% agar in saline was used as the reference for both 16-channel probes used during anesthetized recordings. Probes were slowly advanced into cortex using a micromanipulator (Narishige, Tokyo, Japan), and correct depth was determined online by small deflections of the LFP at superficial electrode recording sites and larger deflections of the LFP at deeper electrode recording sites. Current source density (CSD) analysis was performed offline to verify electrode positioning across cortical layers (Fig. 1C). CSD was determined by calculating the second spatial derivative of the low-pass filtered and smoothed LFP in response to full-field flashes presented at a rate of 1 Hz (Ulbert et al. 2001). The first sink-source pair in the CSD was used to determine putative layer IV. All electrode penetrations were within 1 mm of the same location in V1, corresponding to 5° visual field in azimuth and 4.8° visual field in elevation [given magnification factors in area 17 of 0.2 mm in cortex/° of visual space in the azimuth and 0.207 mm in cortex/° of visual space in elevation (Cantone et al. 2005)]. Unfiltered signals were first amplified with MPA8I head-stages with gain 10 (Multichannel Systems, Reutlingen, Germany), then further amplified with gain 500 (model 3500, A-M Systems, Carlsborg, WA), digitized at 20 kHz (Power 1401, Cambridge Electronic Design, Cambridge, UK), and digitally stored using Spike2 software (Cambridge Electronic Design).
Upon correct depth placement of the electrode(s), the animal was presented with visual or auditory stimuli. The same stimuli were presented to awake and anesthetized animals. Each awake recording session was brief (typically < 2 h), during which the animal was head fixed. Visual stimuli were presented on a 52 × 29 cm monitor with 120-Hz refresh rate and full high-definition resolution (1,920 × 1,080 pixels, GD235HZ, Acer, New Taipei City, Taiwan) at 47 cm distance from the animal (Fig. 1A, left). The same monitor and animal positions were used across sessions, for both awake and anesthetized animals. Visual stimuli filled 58° of the visual field horizontally, 33° of the visual field vertically, and were controlled by the Psychophysics toolbox (Brainard 1997) for MATLAB (Mathworks, Natick, MA) and a GeForce580 GPU (NVIDIA, Santa Clara, CA). Correct timing of individual display frames was ascertained by a photodiode covering a small flashing square in the corner of the monitor. The visual stimulus was 10 s long and consisted of 10 transitions between static checkerboard frozen noise stimuli (“1 Hz noise”, Fig. 1A, bottom); each trial consisted of 10-s visual stimulus bracketed by 10 s of black or gray dark. This visual stimulus was part of a larger set of stimuli that was presented during each recording session in randomized order. The checkerboard visual stimulus enabled the study of responses to both abrupt transitions (i.e., “impulse responses”) and to sustained static visual input in between transitions (i.e., “step responses”). Receptive field mapping was conducted to functionally verify recording location in V1 (Fig. 1D). Receptive fields were determined by presenting the animal with a series of gray screens with one square of a 19 × 10 grid colored white or black for 40 ms. Each square was shown for 30 repeats of each color in a randomized presentation order. MUA evoked by each square was calculated by subtracting baseline MUA during the 50 ms immediately prior to the stimulus onset from MUA 30–80 ms after stimulus onset. Based on comparable receptive field maps across recordings, consistent craniotomy and electrode insertion locations, and unchanged animal and monitor position, we are confident of consistent visual stimulation across recording sessions. We validated our PFC recording locations by histological verification of probe location (recording probe dipped in DiI, Invitrogen, Grand Island, NY, before insertion) to ensure the electrode was properly inserted in the rostral portion of the anterior sigmoid gyrus (Duque and McCormick 2010), 2 mm from the midline (Fig. 1E).
Auditory stimulation consisted of open-field white noise played on two speakers (Dayton Audio B652, 8-Ω impedance, 70 Hz–20 kHz, Dayton Audio, Springboro, OH) through an amplifier (PylePro, 2 × 40 watt, Pyle, Brooklyn, NY) at 64.3-dB sound pressure level (System 824 sound level meter, Larson Davis, Depew, NY). Auditory stimulation trial structure was similar to visual stimulation (10.7 s silence, 10.7 s auditory stimulation, 10.7 s silence). We used a microphone to record sound on a channel of our electrophysiology recording system during the entirety of auditory stimulation sessions. We applied a threshold to this auditory signal channel to detect the onset of stimulation and synchronize the presentation of auditory stimuli with neural recordings.
During awake recordings, continuous infrared video recording (Handycam, HDR-cx560v, Sony, Tokyo, Japan) was used to document that the animal was awake, as evidenced by open eyes, whisking, and nose twitching. Two of the awake animals (one each: V1 and PFC recording locations) were subsequently used for anesthetized recordings to minimize the total number of animals used in this study. Presented anesthetized data were combined across both sets of animals. At the conclusion of the study, animals were humanely killed with an overdose of pentobarbital sodium and immediately perfused with 4% formaldehyde in 0.1 M phosphate-buffered saline for subsequent histological verification of recording locations.
Experiments assessing interaction of V1 and PFC.
In a second set of experiments, simultaneous recordings in V1 and PFC were conducted in both awake and iso/xylazine anesthetized animals to assess the interaction of V1 and PFC. For experimental feasibility, single metal electrodes were used to acquire electrophysiological data instead of multichannel probes. Electrophysiological signals were recorded using single metal electrodes acutely inserted in putative layer IV, measured 0.3–0.6 mm from the surface of cortex (tungsten microelectrode, 250-μm shank diameter, 500-kΩ impedance, FHC, Bowdoin, ME). A silver chloride wire tucked between the skull and soft tissue was used as the reference. Unfiltered signals were amplified with gain 1,000 (model 1800, A-M Systems, Carlsborg, WA), digitized at 20 kHz (Power 1401, Cambridge Electronic Design, Cambridge, UK), and digitally stored using Spike2 software (Cambridge Electronic Design). All other details of the surgical and experimental procedures were the same as described above.
Data analysis and statistical analysis.
Recorded broadband signals were processed offline with custom-written scripts in MATLAB (Mathworks, Natick, MA). For some depth probes, a few select channels had to be excluded because of known defects in Neuronexus B-stock probes; in these cases, we interpolated data from neighboring channels. This was only the case for ∼30% of recordings conducted using 32-channel probes (and never for the 16-channel probes), in which either one or two channels were defective. There were never instances of consecutive defective channels; thus the spatial blurring was minimal (since there always was at least one usable electrode site for every 100 μm of cortical depth). About 15% of the trials were manually excluded due to motion artifacts in the LFP signal (defined as extreme values in the raw traces). If not stated otherwise, the mean across recording sites and trials was calculated per recording session, and figures represent means across recording sessions (number of recording sessions, visual stimulation: V1 awake = 39; V1 0.5% iso = 16; 0.75% iso = 17; 1.0% iso = 18; PFC awake = 27; PFC anesthetized = 51. Auditory stimulation: V1 awake = 5; V1 anesthetized = 5; PFC awake = 15; PFC anesthetized = 17). Laminar probes and CSD allowed for analysis of responses by layers: putative supragranular (LI-II/III), granular (LIV), and infragranular layers (LV-VI). Varying iso levels were collapsed for the analysis of PFC and the response to auditory stimulation.
High-pass filtered data (fourth-order Butterworth filter, 300-Hz cutoff) were subjected to a threshold of −3 × std for detection of action potentials (MUA). The distribution of thresholds for awake recordings was within the range of thresholds obtained in anesthetized recordings. For response histograms, spiking rate was calculated based on 20-ms bins. Time constants were calculated by fitting an exponential with offset to the MUA response for the time periods indicated: a + b × e(−t/τ). MU response latency was calculated from histograms with 5-ms bins for increased temporal resolution. Time-dependent frequency content was determined by convolution of the raw extracellular voltage signals with a family of Morlet wavelets (0.5 Hz to 40 Hz, step-width 0.5 Hz) with normalized amplitude, providing an optimal trade-off between time and frequency uncertainty (Goupillaud et al. 1984). The same methods were applied to recordings from awake and anesthetized animals. All spectra are shown on a logarithmic scale. Power in each frequency band (delta = 0.5–4 Hz, theta = 4–8 Hz, alpha = 8–12 Hz, beta = 12–30 Hz, gamma = 30–40 Hz) was calculated for each recording session. The power enhancement ratio was calculated as the ratio between spectral power during visual stimulation to spectral power during spontaneous activity before stimulation.
Spike-field coherence (SFC) was used to quantify the interaction between mesoscopic LFP frequency structure and microscopic MUA. SFC measures phase synchronization between the LFP and spike times as a function of frequency. Spike-triggered averages from 1-s segments of LFP around each spike were obtained. Multitaper spectral estimates were used to determine spectra of the spike-triggered averages (MATLAB pmtm function with time-bandwidth product of 3.5). Multitaper spectral analysis was used because this approach is optimized for spectral analysis of short data segments (such as those obtained from data surrounding each spike time) and is well-suited for nonstationary signal with rapid fluctuations (van Vugt et al. 2007). SFC values were given by the ratio of spike-triggered average spectra to the average of spectra calculated from each LFP segment (Fries et al. 2001). Thus SFC is normalized for spike rate and spectral power. The SFC ratio was defined as the ratio of the mean SFC for 0.5–30 Hz to the mean SFC for 30–40 Hz.
To assess phase synchrony, we calculated intertrial phase coherence (ITPC) (Tallon-Baudry et al. 1996). ITPC within V1 and PFC, separately, was calculated by convolving the raw extracellular voltage signals with a family of Morlet wavelets (0.5 Hz to 40 Hz, step-width 0.5 Hz) with normalized amplitude and then calculating the mean length of the angle vector across trials. These values were calculated per channel, and statistics were conducted across sessions. Normalization was conducted by subtracting the average ITPC during full-field dark screen (visual stimulation) or silence (auditory stimulation). Recordings conducted under all doses of anesthetics were combined. We defined a region of interest (ROI) of 0.5–10 Hz for 500 ms after stimulus onset to measure differences in phase coherence between awake and anesthetized animals. We normalized the average ITPC in our ROI by subtracting averaged ITPC from 500 ms during the preceding dark/silent period. While a commonly applied metric to assess phase-resetting, evidence suggests that ITPC may also reflect evoked responses. To test for this, we utilized the methods proposed by Martinez-Montes et al. (2008). Specifically, we calculated the t-like statistic, which assesses if there is a significant difference between the sample mean of the wavelet coefficients for each time point and frequency and the average of these sample means for the prestimulus period. A local false discovery rate of 0.2 was used to test for significance and correct for multiple comparisons in the time-frequency map.
To test the relationship of activity between V1 and PFC, in a second set of experiments, we recorded LFP and MUA simultaneously from V1 and PFC in two awake and two iso/xylazine anesthetized ferrets using single metal electrodes inserted into putative layer IV (number of sessions: awake = 18, 0.5% iso = 10, 1.0% iso = 21). To gain insight into the functional connectivity between V1 and PFC, the time-dependent spectral coherence was estimated by first convolving the raw signal in V1 and PFC with a family of Morlet wavelets across frequencies (0.2 Hz to 40 Hz, step-width of 0.2 Hz for time-dependent analysis and step-width of 0.5 Hz for time-averaged analysis). For each trial, the auto spectra in V1 and PFC and the cross spectrum were calculated. The auto spectra in V1, auto spectra in PFC, and cross spectrum were averaged across trials, without smoothing within trials. The time-frequency spectral coherence was then calculated as the square of the averaged cross spectrum, normalized by the product of the averaged auto spectra from V1 and PFC (Zhan et al. 2006). This method of calculating coherence does not assume a stationary signal. Spectral coherence was calculated per recording session, and means were calculated across sessions to provide group-averaged results. Time-averaged spectral coherence was obtained by averaging over time during presentation of the visual stimulus. This coherence measure assumes a linear dependence of activity between V1 and PFC and takes values from 0 (absent coherence) to 1 (perfect coherence).
Since the functional relationship of V1 and PFC activity is not well-understood and the assumption of linear dependency may not hold, we additionally calculated nonlinear phase-locking between V1 and PFC (Lachaux et al. 1999). The raw signal in V1 and PFC was convolved with a family of Morlet wavelets across frequencies (0.5–40 Hz, step-width 0.5 Hz) to obtain instantaneous phases of the signal from each brain area. The circular variance of the phase differences between V1 and PFC was computed over trials in each recording and then averaged across recordings to provide the group-averaged phase-locking value (V1-PFC PLV). V1-PFC PLVs range from 0 to 1, reflecting absent to perfect phase-locking, respectively.
Statistical tests were performed using ANOVA, with post hoc testing if the main effect was significant at P < 0.05. Tukey's honestly significant difference criterion was used to correct for multiple comparisons. Unless otherwise stated, mean ± SE are reported.
RESULTS
To elucidate how micro- and mesoscale network dynamics of sensory processing differ between awake and anesthetized animals, we performed multichannel electrophysiology combined with sensory stimulation in head-fixed ferrets (Fig. 1A, top). The visual stimulus (10 s) consisted of 10 frozen-noise, static checkerboard patterns that were consecutively presented at a frequency of 1 Hz (Fig. 1A, bottom). We recorded LFP and MUA from V1 (n = 13 animals) and PFC (n = 9 animals) to quantify MUA and LFP network dynamics (Fig. 1B: recording locations of V1 and PFC shown on photograph of a ferret brain). These two cortical recording locations were chosen to capture responses in and interactions between a primary sensory area and a higher-order cortical association area. We used multichannel depth probes for simultaneous electrophysiological recordings from all cortical layers [Fig. 1C: CSD in V1, the top sink source pair was indicative of putative granular layer IV; layers were identified and grouped as supragranular (LI-LII/III), granular (LIV), or infragranular (LV-LVI)]. Receptive field mapping demonstrated well-defined visual responses and, therefore, provided functional verification of recording location in V1 (Fig. 1D); postmortem histological processing was used to confirm recording location in PFC (Fig. 1E). Infrared videography was used to verify that animals were awake for the entirety of the awake recordings, as determined by the presence of whisking, minor movements, and blinking. Animals had not been trained in any task and were freely viewing during the recordings.
Disruption of temporal precision and laminar distribution of visually evoked MUA during anesthesia.
In one conceptual framework, anesthetics could selectively alter information flow between higher-order (cortical) areas and spare processing in primary sensory cortices, leaving sensory responses intact. Alternatively, anesthesia could indiscriminantly suppress visual responses and, therefore, reduce overall representation of sensory input. Lastly, anesthetics could disrupt specific aspects of the spatio-temporal response dynamics in the cortical microcircuit. To disambiguate between these possibilities, we first asked if and how visual responses in V1 measured by MUA were altered during anesthesia. We found that MUA responses differed strikingly between recordings in the awake and anesthetized animal. Importantly, we did not find broad suppression of visual responses by anesthetics. Rather, we identified several pronounced differences in the temporal structure of MUA responses between awake and anesthetized animals. In the awake animal, MUA response dynamics exhibited two salient features. First, in response to the onset of the 10-s visual stimulus, a strong MUA response occurred (Fig. 2A, left, representative high-pass filtered trace from infragranular layers, taken from recording shown in Fig. 2B, left, blue line indicates spike-extraction threshold set at −3 × std; Fig. 2B, left, responses from a single recording; Fig. 3A, left, averaged group-level responses; MUA rates were calculated based on 20-ms bins). MU responses markedly decreased with subsequent transitions to the next checkerboard pattern within each trial of the 10-s visual stimulus (Figs. 2, A and B, and 3A, left). Second, awake animals exhibited temporally precise, transient increases in MUA in response to each transition in the stimulus (Fig. 3A, bottom left). In anesthetized animals, the amplitude of visually-evoked MUA was comparable for the stimulus onset and the subsequent noise-pattern transitions in the stimulus (Fig. 2A, right, representative high-pass filtered trace from infragranular layers, taken from the recording shown in Fig. 2B, right, blue line indicates spike-extraction threshold; Fig. 2B, right, responses from a single recording; Fig. 3A, right, averaged group-level responses). Furthermore, there was a pronounced “tail” of continued MUA response following the initial temporally precise response to transitions in the stimulus (Fig. 3A, bottom right). Accordingly, the decay time constant for the MUA response was significantly longer in anesthetized animals compared with that in awake animals [Fig. 3A, bottom, time constant for MUA during seconds 4–5 of visual stimulation: awake = 0.050 s, 95% confidence interval (0.037 0.066), 1.0% iso = 0.140 s, 95% confidence interval (0.119 0.160)].
Fig. 2.
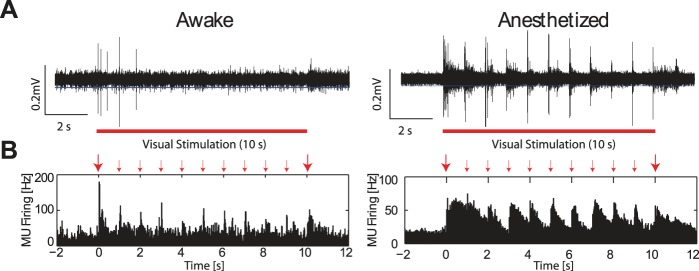
Representative MUA responses in awake and anesthetized animals. A: representative traces of high-pass filtered MU spiking activity from infragranular layers in an awake (left) and 1.0% iso with xylazine anesthetized (right) animal during visual stimulation. Awake animals exhibited MUA primarily at stimulus onset and the first few transitions of noise patterns. In anesthetized animals, MUA was strongly driven by the stimulus transitions for the entire duration of the visual stimulation. Red bars indicate presentation times of the visual stimulus. Blue lines indicate threshold for extracting spikes; both large amplitude spikes and small amplitude spikes were extracted. B: MU spike-time histograms from a single recording session for an awake animal (left) and an animal anesthetized with 1.0% iso with xylazine (right). Raw traces shown in A are from these recording sessions. Large red arrows indicate stimulus onset and offset; small red arrows indicate transitions between noise patterns in the stimulus.
Fig. 3.

Differences in MUA response dynamics between awake and anesthetized animals. A: group-averaged MU spike-time histograms. Top, left: in awake animals, MU firing was temporally precise and aligned to transitions in the visual stimulus. Right: in 1.0% iso with xylazine anesthetized animals, firing rate remained elevated following transitions to subsequent noise patterns during visual stimulation. Large red arrows indicate stimulus onset and offset; small red arrows indicate transitions between noise patterns in the stimulus. Bottom: MUA exhibited a shorter decay time constant in awake animals compared with anesthetized animals. Red line, exponential fit of decay time course. All plots show averages across cortical layers. B: group-averaged MU spiking response latency in awake and anesthetized animals. Five-millisecond binning was used for finer temporal resolution. All plots show averages across cortical layers. Red lines, stimulus onset. C: group-averaged mean MU response latency, defined as exceeding a threshold of 2 × std of baseline spiking activity. Response latency was not significantly different between awake and anesthetized animals. All plots show averages across cortical layers. Error bars indicate 1 SE.
We calculated MU firing rate using 5-ms bins to provide better temporal resolution at the onset of the visual stimulus but found no alteration in the response latency of MU firing (Fig. 3B). The latency of MU spiking after onset of the visual stimulus exhibited a significant group factor of condition (awake, 0.5% iso, 0.75% iso, 1.0% iso, F = 2.86, P = 0.041); however, no post hoc tests were significant (Fig. 3C, mean response latency ± 1 SE, defined as exceeding a threshold of 2 × std of baseline spiking activity, awake = 0.019 ± 0.0011 s; 0.5% iso = 0.018 ± 0.00070 s; 0.75% iso = 0.016 ± 0.00071 s; 1% iso = 0.015 ± 0.00056 s). Together, these results indicate that anesthetics altered V1 visually-evoked spiking by maintaining a large-amplitude response to each subsequent transition in the stimulus and concomitantly inducing prolonged MUA responses to transients in the visual input.
Previous work has demonstrated that anesthetics selectively alter spontaneous activity as a function of cortical layer (Sellers et al. 2013). We here sought to investigate if MUA responses to visual input also differed across cortical layers during anesthesia. Understanding the impact of anesthetics on dynamics across layers in the cortical microcircuit is particularly tractable in V1 because of the well-established pathway of information flow between cortical layers in visual processing (Binzegger et al. 2009). Thirty-two-channel depth probes allowed for simultaneous acquisition of electrophysiological activity across all cortical layers (Fig. 4A, group-averaged MU spiking rate during visual stimulation across cortical layers for awake animals and animals anesthetized with 0.5%, 0.75%, and 1.0% iso, all with xylazine). In awake animals, there was a trend level difference in visually-evoked spiking rates across cortical layers (Fig. 4B, far left, mean firing rate averaged across 10 s of visual stimulation ± 1 SE: supragranular = 34.11 ± 1.918 Hz, granular = 40.01 ± 2.302 Hz, infragranular = 40.68 ± 2.138 Hz, F = 2.67, P = 0.07). For the three levels of anesthetic, there were significant and trend level effects of cortical layer on increased visually-evoked spiking, particularly with differences in the granular layer (Fig. 4B, right, mean firing rate averaged across 10 s of visual stimulation ± 1 SE: 0.5% iso, supragranular = 33.39 ± 4.267 Hz, granular = 49.25 ± 7.181 Hz, infragranular = 36.70 ± 4.194 Hz, F = 2.37, P = 0.1; 0.75% iso, supragranular = 40.24 ± 4.339 Hz, granular = 53.85 ± 5.824 Hz, infragranular = 37.66 ± 2.629 Hz, F = 3.81, P = 0.03; 1.0% iso, supragranular = 39.72 ± 4.676 Hz, granular = 48.29 ± 5.604 Hz, infragranular = 34.25 ± 2.247 Hz, F = 2.58, P = 0.09).
Fig. 4.

Disruption of the laminar distribution and adaptation of visually-evoked MUA responses. A: group-averaged MU firing rate across cortical layers. Compared with awake animals (top), increasing concentrations of anesthetic (bottom; 0.5%, 0.75%, 1.0% iso, all with xylazine) altered the laminar distribution of MU firing, notably increasing relative strength of the response in putative layer IV (electrode depth 0.3–0.6 mm). B: group-averaged mean firing rate across 10 s of visual stimulation for supragranular, granular, and infragranular layers. Awake animals exhibited slightly higher MU firing rate in granular and infragranular layers compared with supragranular layers. 0.5%, 0.75%, and 1.0% iso all with xylazine increased firing rate in granular layers at the trend level relative to supragranular and infragranular layers. Error bars indicate 1 SE. *Significantly different at P < 0.05. C: response to each of the 10 transitions between subsequent noise patterns during the visual stimulus, calculated as the mean MU firing rate for 200 ms after each screen change, for supragranular (blue), granular (green), and infragranular (red) layers. Awake animals exhibited pronounced spike rate adaptation for later noise patterns, while anesthetics slowed this adaptation of MUA.
Given this trending increase in MUA response in the granular layer during anesthesia, we next asked if anesthetics altered adaptation dynamics to the 1-Hz temporal structure of the stimulus as a function of cortical depth. In awake animals, we observed adaptation of supragranular, granular, and infragranular layers to repeated presentations of the stimulus (Fig. 4C, left: impulse-like response to each of the 10 screen changes during the visual stimulus, calculated as the mean MU firing rate for 200 ms after each screen change). During anesthesia, this adaptation of MUA responses was slowed; supragranular, granular, and infragranular layers each exhibited inconsistent modulation in response across the 10 transitions between checkerboard-noise patterns within the visual stimulus (Fig. 4C, right). Decreased activity in the main output layer (layer V, infragranular layers) relative to activity in the input layer (layer IV, granular layers) suggests that the interaction between cortical areas may be impaired under anesthesia.
Amplified visually-evoked frequency structure during anesthesia.
Given these changes in the temporal activity structure of microscopic sensory responses measured by MUA, we next asked if mesoscopic activity patterns, in particular the frequency structure of the LFP, were also altered by anesthetics. During visual stimulation in awake animals, the LFP (Fig. 5A, left, raw trace from infragranular layers, taken from recording shown in Fig. 5B, left) and spectral content (Fig. 5B, left, single recording example; Fig. 6A, left, group-averaged results) modestly reflected the temporal (1 Hz) structure of the visual stimulus. In contrast, in anesthetized animals, spectral power was predominantly driven by the temporal patterning of the visual stimulus (Fig. 5A, right, raw trace from infragranular layers taken from recording shown in Fig. 5B, right; Fig. 5B, right, single recording example; Fig. 6A, right, group-averaged results). To assess if this difference in spectral modulation was limited to certain cortical layers, we determined stimulation-induced modulation of spectral power by cortical layer (Fig. 6B, ratio of spectral power during visual stimulation to power of spontaneous activity). Indeed, we found similar response profiles across layers; in addition, in both awake and anesthetized animals, spectral modulation at low frequencies was greater in granular and infragranular layers compared with supragranular layers. We next quantified the enhancement of power in each frequency band by the visual stimulus, by calculating the ratio of power during visual stimulation to power during spontaneous activity before stimulation. Visual stimulation enhanced power for frequency bands in both awake and anesthetized animals, with the greatest enhancement at the highest concentrations of iso (Fig. 6C, percent enhancement ± 1 SE, awake animal: delta = 26.42 ± 3.653% enhancement, theta = 12.40 ± 3.725% enhancement, alpha = 5.565 ± 3.091% enhancement, beta = 0.4129 ± 1.945% enhancement, gamma = 11.89 ± 1.503% enhancement. 1% iso: delta = 167.4 ± 22.87% enhancement, theta = 143.0 ± 17.42% enhancement, alpha = 112.8 ± 10.07% enhancement, beta = 75.57 ± 8.024% enhancement, gamma = 48.39 ± 6.889% enhancement). Enhancement in each frequency band for animals anesthetized with 0.5%, 0.75%, or 1.0% iso all with xylazine was significantly greater than enhancement in the matching frequency band in awake animals (delta: F = 26.69, P < 0.05; theta: F = 29.18, P < 0.05; alpha: F = 40.90, P < 0.05; beta: F = 57.67, P < 0.05; gamma: F = 15.71, P < 0.05). In addition, post hoc tests demonstrated that delta, theta, alpha, and beta power enhancement were significantly different between 0.5% iso and 1.0% iso, and beta power enhancement was significantly different between 0.75% iso and 1.0% iso. Thus increasing concentrations of iso increased power across all frequency bands, but with the greatest enhancement in the lower frequency bands and in granular and infragranular layers.
Fig. 5.
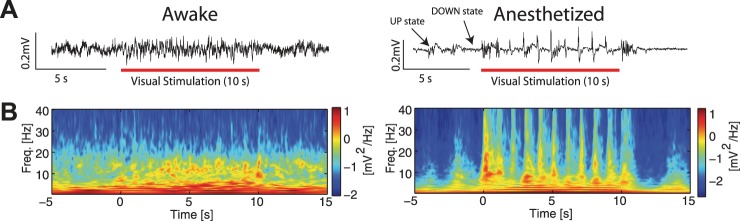
Representative LFP responses to visual input in V1. A: representative LFP traces from infragranular layers in V1 in an awake (left) and 1.0% iso with xylazine anesthetized (right) animal during visual stimulation. Note UP and DOWN states in the LFP trace from the anesthetized animal. Red bars indicate presentation of visual stimulus. B: spectrograms of single recordings from awake (left) and 1.0% iso with xylazine anesthetized (right) animals. Raw traces shown in A are from these recording sessions. Plots show averages across cortical layers.
Fig. 6.

Differences in mesoscale LFP responses to visual input in V1. A: group-averaged spectrograms of awake (left) and 1.0% iso with xylazine anesthetized (right) animals. Plots show averages across cortical layers. B: group-averaged ratio of spectral power during visual stimulation to spectral power during spontaneous activity prior to visual stimulation by cortical layer. In both awake (left) and 1.0% iso with xylazine anesthetized (right) animals, the 1-Hz structure of the visual stimulus is apparent in the activity of all cortical layers. C: enhancement ratio of spectral power during visual stimulation to spectral power during spontaneous activity prior to visual stimulation. Plots show averages across cortical layers. In both awake and anesthetized animals (0.5%, 0.75%, and 1.0% iso all with xylazine), all frequency bands exhibited increased power. Greater enhancement in power was evident as iso concentration increased. Error bars indicate 1 SE. Asterisk (*) above bars indicates significantly different from values in awake animals, P < 0.05. Additional significant differences at P < 0.05 are indicated.
Selective enhancement of SFC at low frequencies during anesthesia.
Given the prolonged MUA responses to visual stimulation, together with the broad-band increases in stimulus-driven frequency structure during anesthesia, we asked how the functional interaction between microscopic and mesoscopic network dynamics was modulated by anesthetics. SFC links mesoscopic LFP network dynamics to microscopic MUA by quantifying the interaction between network frequency structure and spiking activity. We found that SFC was minimal in awake animals, while anesthetics induced differential effects based on cortical layer (Fig. 7A). To further quantify the frequency and layer specificity of changes in SFC during anesthesia, we developed a metric to indicate the relative enhancement of low-frequency SFC (Fig. 7, B–D, SFC ratio = mean SFC from 0.5 Hz to 30 Hz/mean SFC from 30 Hz to 40 Hz). With anesthetic, the SFC ratio increased for supragranular (Fig. 7B, SFC ratio ± 1 SE: awake = 0.991 ± 0.0714, 0.5% iso = 1.84 ± 0.283, 0.75% iso = 2.00 ± 0.311, 1.0% iso = 2.54 ± 0.458), granular (Fig. 7C, awake = 1.17 ± 0.103, 0.5% iso = 2.22 ± 0.202, 0.75% iso = 2.38 ± 0.216, 1.0% iso = 2.86 ± 0.262), and infragranular layers (Fig. 7D, awake = 1.05 ± 0.0588, 0.5% iso = 3.42 ± 0.403, 0.75% iso = 2.83 ± 0.409, 1.0% iso = 2.99 ± 0.496). For each cortical depth, anesthesia condition was a significant factor (supragranular, F = 7.28; granular F = 20.8; infragranular F = 15.8; all P < 0.05). These results demonstrate that, during anesthesia, there was increased synchronization of the LFP and spiking activity, preferentially at lower frequencies. Given the likely role of mesoscale dynamics measured by the LFP in enabling and timing the interaction between cortical areas, we next investigated the effects of anesthetics on functional cortical connectivity.
Fig. 7.

Anesthetics increased spike-field coherence (SFC) in V1 during visual stimulation, preferentially at low frequencies. A: SFC was used to quantify the interaction between mesoscopic LFP frequency structure and microscopic MUA during presentation of the visual stimulus. This figure shows group-averaged SFC by cortical depth during presentation of visual stimulation. Left: SFC was low in awake animals across cortical layers. Right: anesthesia induced layer-specific changes to SFC (0.5%, 0.75%, and 1.0% iso all with xylazine). Specifically, compared with awake animals, anesthetized animals exhibited increased SFC in supragranular and infragranular layers, increased SFC at low frequencies in granular layers, and decreased SFC at higher frequencies in granular layers. Putative granular layer IV (electrode depth 0.3–0.6 mm) is indicated by red box. B: the SFC ratio (mean SFC from 0.5 Hz to 30 Hz/mean SFC from 30 Hz to 40 Hz) was used to indicate the relative enhancement of low-frequency SFC. In supragranular layers, anesthetics enhanced SFC broadly across frequencies compared with SFC in the awake animal. C: in granular layers, anesthetics enhanced SFC in low frequencies in a dose-dependent manner and decreased SFC at higher frequencies compared with SFC in awake animals. D: anesthetics enhanced SFC in low frequencies most prominently in infragranular layers. Error bars indicate 1 SE. *Significantly different at P < 0.05.
Altered visual representation in PFC by anesthetics.
Motivated by the evidence for prominent changes in the magnitude, duration, and adaptation of visually-evoked responses in V1 by anesthetics, we next asked if representation of the visual input in PFC was also altered by anesthetics. If anesthetic agents cause functional disconnectivity of cortico-cortical circuits, PFC responses to sensory stimulation present in the awake animal should be absent in the anesthetized animal. Indeed, the onset of visual stimulation induced modulation of the LFP and spectral power in PFC of the awake animal (Fig. 8A, left: single-trial example taken from recording session plotted in Fig. 8B, left; Fig. 8B, left: responses from a single recording), whereas visual stimulation did not evoke this activity in PFC of the anesthetized animal (Fig. 8A, right: single trial example taken from recording session plotted in Fig. 8B, right; Fig. 8B, right: responses from a single recording). To quantify this difference between the awake and anesthetized animals, we defined a ROI of 0.5–10 Hz for 500 ms after stimulus onset, normalized by the 500 ms prior to stimulus onset. Averaged across recordings, spectral modulation was different between awake and anesthetized animals (ROI analysis, induced spectral modulation ± 1 SE, awake: 0.186 ± 0.0389, F = 22.91, P < 0.05; anesthetized: 0.0651 ± 0.0186, F = 12.24, P < 0.05, significant difference between the two conditions, F = 9.14, P < 0.05).
Fig. 8.

Visual stimulation induced spectral modulation and increased intertrial phase coherence (ITPC) in PFC of awake animals, but not in PFC of anesthetized animals. A: representative LFP traces from infragranular layers in PFC in an awake (left) and 1.0% iso with xylazine anesthetized (right) animal during visual stimulation. Red bars indicate presentation of the visual stimulus. B: spectrograms of single recordings from PFC in awake (left) and 1.0% iso with xylazine anesthetized (right) animals. In awake animals, the onset of the visual stimulus at time = 0 s induced spectral modulation, particularly in low frequencies. Plots show averages across cortical layers. C: group-averaged ratio of PFC spectral power during visual stimulation to spectral power during spontaneous activity, by cortical layer. Left: in awake animals, the visual stimulation induced spectral modulation in superficial layers according to the temporal pattern of the visual stimulus. Right: in anesthetized animals, superficial layers exhibited minimal spectral modulation by the visual stimulus. Dashed lines indicate 1 Hz. D: representative traces of high-pass filtered MU spiking activity from PFC infragranular layers in an awake (left) and 1.0% iso with xylazine anesthetized (right) animal during visual stimulation. Awake animals exhibited increased MUA at stimulus onset. In anesthetized animals, MUA was highly rhythmic, likely driven by anesthesia. E: phase coherence was used to probe for responses to sensory stimuli. Left: group-averaged ITPC increased at the onset of visual stimulation in PFC of awake animals. Right: in PFC of anesthetized animals, there was no increase of group-averaged phase-coherence induced by visual stimulation. Plots show averages across cortical layers. F: V1 in awake (left) and anesthetized (right) animals exhibited increased group-averaged phase coherence during presentation of the visual stimulus. Plots show averages across cortical layers.
We next asked if the representation of sensory input in PFC differed across cortical layers. Based on previous findings that layer II/III frontal cortex receives convergent synaptic inputs from sensory and motor systems (Opris et al. 2011), we expected that the most prominent effects of anesthetics would be found in superficial layers. We calculated the enhancement of spectral power as the ratio of power during stimulation to spontaneous activity prior to stimulation. As expected, visual stimulation in awake animals induced the strongest spectral modulation in layer II/III, according to the temporal pattern of the visual stimulus (Fig. 8C, left). In anesthetized animals, we found slight, nonspecific spectral enhancement in the low frequencies (Fig. 8C, right). Additionally, we examined MUA in PFC (Fig. 8D, representative high-pass filtered traces from infragranular layers of awake and anesthetized animals). Awake animals exhibited modulation of PFC MUA by the visual stimulus, quantified as the difference in MUA between the 500-ms window before stimulus onset and the MUA in the initial 500 ms after stimulus onset (mean ± 1 SE, 2.47 ± 0.452 Hz, F = 29.85, P < 0.05), while PFC MUA was not modulated by the visual stimulus in anesthetized animals (1.05 ± 0.547 Hz, F = 3.69, P = 0.06).
We next computed the ITPC of the LFP. This metric assumes values above zero (maximum value of 1) if sensory stimulation consistently altered the phase of the ongoing activity across trials. However, ITPC may be sensitive to evoked responses in addition to phase-resetting (Krieg et al. 2011; Martinez-Montes et al. 2008). Thus, for each ITPC result, we additionally calculated if there was a significant evoked response for each (see Fig. 11). PFC of awake animals exhibited increased ITPC at the stimulus onset, in particular at low frequencies (Fig. 8E, left, mean ROI phase-locking ± 1 SE: awake = 0.0945 ± 0.0201, F = 22.03, P < 0.05, appearance of increased phase synchrony prior to the visual stimulus onset is an artifact of the wavelet analysis and does not indicate a response prior to stimulus onset). Critically, this engagement was minimal in PFC of the anesthetized animal (Fig. 8E, right, mean ROI ITPC ± 1 SE: anesthetized = 0.0213 ± 0.00638, F = 11.14, P < 0.05, significantly different from the awake condition, F = 20.92, P < 0.05). This minimal response to the visual input in PFC during anesthesia supports altered functional interaction induced by anesthetics.
Fig. 11.

ITPC is likely driven by not only phase resetting, but also stimulation-induced evoked responses. A: we adopted the approach of Martinez-Montes et al. (2008) to find the time points and frequencies at which there was a significant difference in sample mean of the wavelet coefficients compared with the baseline rest period (the T-mean). Group-averaged results demonstrate that, in V1, visual stimulation induced an evoked response for both awake (left) and anesthetized (right) animals, according to the temporal patterning of the visual stimulus. This corresponds to ITPC results in Fig. 8F. Plots show averages across cortical layers. Red line indicates stimulus onset. B: group-averaged results demonstrate that, in PFC, visual stimulation induced an evoked response at stimulus onset for awake animals (left), but this effect was absent in anesthetized animals (right). This corresponds to ITPC results in Fig. 8E. Plots show averages across cortical layers. Red line indicates stimulus onset. C: in V1, auditory stimulation induced an evoked response at stimulus onset in awake (left) but not anesthetized (right) animals. This corresponds to ITPC results in Fig. 9E. Plots show averages across cortical layers. Red line indicates stimulus onset. D: in PFC, auditory stimulation induced an evoked response at stimulus onset in awake (left) but not anesthetized (right) animals. This corresponds to ITPC results in Fig. 10E. Plots show averages across cortical layers. Red line indicates stimulus onset.
As a reference, we applied this ITPC metric to our V1 data as we expected to see a larger, stimulus-driven effect under anesthesia based on the above-presented results. Indeed, phase coherence at the onset of the visual stimulus was observed in the awake animal (Fig. 8F, left: mean ITPC ± 1 SE = 0.150 ± 0.0225, F = 44.41, P < 0.05), but was stronger and remained elevated throughout the duration of visual stimulation in anesthetized animals (Fig. 8F, right: mean ITPC ± 1 SE = 0.324 ± 0.0187, F = 299.66, P < 0.05, awake vs. anesthetized significantly different, F = 30.76, P < 0.05). Therefore, in agreement with the MUA and frequency spectrum LFP results, visual input had a more pronounced effect on network dynamics in V1 of the anesthetized animal.
Altered representation of auditory stimulus in V1 and PFC by anesthetics.
Given this reduced representation of visual stimuli in PFC under anesthesia, we next asked if anesthetics similarly modulate the functional connectivity that mediates cross-modal sensory signaling in the brain. To address this question, we used auditory stimuli to investigate if the response to such input differed in V1 and PFC between the awake and the anesthetized animal. In V1, presentation of the auditory stimulus induced modulation in both the LFP and the spectrogram (Fig. 9A, left: single trial example taken from recording session shown in Fig. 9B, left; Fig. 9B, left: responses from a single recording). These effects were absent in the anesthetized animal (Fig. 9A, right: single trial example taken from recording session shown in Fig. 9B, right. Fig. 9B, right: responses from a single recording). At the group level, we found a small modulation of spectral power, although not significant (ROI analysis, mean ± 1 SE, 0.146 ± 0.106, F = 1.91, P = 0.20), but no significant spectral modulation in anesthetized animals (−0.0251 ± 0.0515, F = 0.24, P = 0.63). To investigate if there was differential spectral modulation by cortical layer, we calculated the enhancement of spectral power as the ratio of power during stimulation to spontaneous activity prior to stimulation. In awake animals (Fig. 9C, left), there was prominent low-frequency modulation in V1 granular layers and alpha frequency modulation in infragranular layers, whereas anesthetized animals exhibited no prominent differences across cortical layers (Fig. 9C, right). In looking at the MUA (Fig. 9D, representative high-pass filtered traces from an awake and anesthetized animal), we found significant MUA response in V1 exclusively in awake animals (awake: mean ± 1 SE, 19.7 ± 7.04 Hz, F = 7.71, P = 0.02; anesthetized: 0.271 ± 0.914 Hz, F = 0.09, P = 0.77; difference between awake and anesthetized significantly different, F = 10.57, P < 0.05).
Fig. 9.

V1 spectral modulation and increase in ITPC by auditory stimulation were suppressed by anesthetics. A: representative LFP traces from infragranular layers in V1 in an awake (left) and 1.0% iso with xylazine anesthetized (right) animal during auditory stimulation. Red bars indicate presentation of the auditory stimulus. B: spectrograms of single recordings from V1 in awake (left) and 1.0% iso with xylazine anesthetized (right) animals. In awake animals, the onset of the auditory stimulus at time = 0 s induced spectral modulation. Plots show averages across cortical layers. C: group-averaged ratio of V1 spectral power during auditory stimulation to spectral power during spontaneous activity, by cortical layer. Left: in awake animals, the strongest effect of auditory stimulation on spectral power was found at low frequencies in the granular layer and in the alpha-band in infragranular layers. Right: these dynamics were absent in anesthetized animals. D: representative traces of high-pass filtered MU spiking activity from V1 infragranular layers in an awake (left) and 1.0% iso with xylazine anesthetized (right) animal during auditory stimulation. E, left: auditory stimulation elicited increased group-averaged phase-coherence in V1 of awake animals. Right: in V1 of anesthetized animals, there was no detectable increase in group-averaged phase-coherence induced by auditory stimulation. Plots show averages across cortical layers.
We again examined ITPC within V1 in response to the auditory, white-noise stimulus. Interestingly, we found that V1 exhibited increased phase synchrony in response to the auditory stimulus in the awake animal, while there was no such response in the anesthetized animal (Fig. 9E, left, mean ROI ITPC ± 1 SE in V1 awake = 0.207 ± 0.0163, F = 161.82, P < 0.05; Fig. 9E, right, mean ROI ITPC ± 1 SE in V1 anesthetized = 0.00756 ± 0.0114, F = 0.44, P = 0.52; significantly different between the two conditions, F = 72.30, P < 0.05), consistent with intact functional connectivity between visual and auditory areas exclusively in awake animals. See Fig. 11 for additional analysis testing for evoked responses.
We next extended this analysis to recordings conducted in PFC during presentation of the auditory stimulus. In PFC, auditory stimulation induced modulation at the onset of the stimulus, as evidenced in both the LFP and the spectrogram (Fig. 10A, left: single trial example taken from the recording shown in Fig. 10B, left; Fig. 10B, left: responses from a single recording). These effects were absent in the anesthetized animal (Fig. 10A, right: single trial example taken from the recording shown in Fig. 10B, right. Fig. 10B, right: responses from a single recording). At the group level, onset of the auditory stimulus also induced subtle modulation of spectral power in the awake animal only (ROI analysis, induced spectral modulation ± 1 SE, awake: 0.109 ± 0.0356, F = 9.35, P < 0.05, anesthetized: 0.0128 ± 0.0518, F = 0.06, P = 0.81; difference between awake and anesthetized significant at trend level, F = 2.49, P = 0.12).
Fig. 10.

Auditory stimulation induced increase in spectral power and ITPC in PFC of awake animals. A: representative LFP traces from infragranular layers in PFC in an awake (left) and 1.0% iso with xylazine anesthetized (right) animal during auditory stimulation. Red bars indicate presentation of the auditory stimulus. B: spectrograms of single recordings from PFC of awake (left) and 1.0% iso with xylazine anesthetized (right) animals. In only the awake animal, the onset of the auditory stimulus at time = 0 s induced spectral modulation. Plots show averages across cortical layers. C: group-averaged ratio of PFC spectral power during auditory stimulation to spectral power during spontaneous activity, by cortical layer. D: representative traces of high-pass filtered MU spiking activity from PFC infragranular layers in an awake (left) and 1.0% iso with xylazine anesthetized (right) animal during auditory stimulation. Awake animals exhibited increased MUA at stimulus onset. In anesthetized animals, MUA was highly rhythmic, likely driven by anesthesia. E, left: PFC in awake animals exhibited increased group-averaged ITPC at the onset of auditory noise stimulation. Right: there was no detectable increase in group-averaged phase-coherence induced by auditory noise stimulation in PFC of anesthetized animals. Plots show averages across cortical layers.
We next calculated spectral modulation across cortical layers in PFC induced by the auditory stimulus. We found no pronounced differences between the awake and anesthetized change in spectral power for the broadband auditory stimulus at the group level (Fig. 10C). In looking at MUA (Fig. 10D, representative high-pass filtered traces from an awake and anesthetized animal), we found that MUA was altered by auditory stimulation only in the awake animal (induced modulation mean ± 1 SE, awake: 1.84 ± 0.860 Hz, F = 4.59, P = 0.04, anesthetized: −0.948 ± 0.814 Hz, F = 1.36, P = 0.25, awake and anesthetized significantly different, F = 5.55, P = 0.03). Furthermore, PFC exhibited increased phase synchrony at the onset of the auditory stimulus in exclusively the awake animal (Fig. 10E, left, mean ROI ITPC ± 1 SE in PFC awake = 0.0917 ± 0.0188, F = 23.78, P < 0.05; Fig. 10E, right, mean ROI ITPC ± 1 SE in PFC anesthetized = 0.00828 ± 0.0107, F = 0.60, P = 0.44, significantly different between the two conditions, F = 15.83, P < 0.05), consistent with intact functional connectivity in only the awake animal.
As stated above, ITPC is likely driven by not only phase resetting, but also evoked responses. We utilized the approach of Martinez-Montes et al. (2008) to find the time points and frequencies at which there was a significant difference in sample mean of the wavelet coefficients compared with the baseline rest period (which the authors termed the T-mean statistic). Indeed, we found that visual stimulation in V1 induced an evoked response in both awake and anesthetized animals (Fig. 11A, corresponding to ITPC results in Fig. 8F), while visual stimulation only induced an evoked response in PFC of awake animals (Fig. 11B, corresponding to Fig. 8E). Auditory stimulation only induced an evoked response in V1 and PFC of awake animals (Fig. 11C, auditory stimulation in V1, corresponding to ITPC results in Fig. 9E; Fig. 11D, auditory stimulation in PFC, corresponding to ITPC results in Fig. 10E). Thus this additional analysis identified a likely role of evoked responses as one of the main sources contributing to nonzero ITPC values.
Decreased spectral coherence and phase synchrony between V1 and PFC with anesthesia.
Motivated by evidence for altered sensory processing across cortical areas and sensory modalities under anesthesia, we next directly investigated mesoscale functional connectivity between V1 and PFC by recording LFP and MUA simultaneously with single electrodes in V1 and PFC of awake and anesthetized animals during visual stimulation. We first used spectral coherence between LFP in V1 and PFC to quantify functional connectivity between the two areas. Averaged over the duration of the visual stimulus, awake animals exhibited greater spectral coherence between V1 and PFC compared with anesthetized animals (Fig. 12A, group-averaged and time-averaged spectral coherence between V1 and PFC). Spectral coherence averaged within each frequency band during visual stimulation was significantly greater in awake animals compared with animals anesthetized with iso/xylazine (Fig. 12B, mean spectral coherence between V1 and PFC during stimulation in each frequency band ± 1 SE for awake animals and animals anesthetized with 0.5% and 1.0% iso, respectively: delta = 0.34 ± 0.037, 0.15 ± 0.012, 0.15 ± 0.010; theta = 0.30 ± 0.033, 0.13 ± 0.0043, 0.11 ± 0.0030; alpha = 0.27 ± 0.026, 0.14 ± 0.0065, 0.12 ± 0.0043; beta = 0.24 ± 0.016, 0.11 ± 0.0013, 0.11 ± 0.0022; gamma = 0.22 ± 0.013, 0.11 ± 0.0013, 0.11 ± 0.0020; all awake vs. 0.5% iso and 1.0% iso for a given frequency band significantly different, F = 19.88, P < 0.05). These results demonstrate that administration of iso/xylazine anesthetics significantly reduced spectral coherence and thus impaired functional connectivity between V1 and PFC during sensory stimulation. However, it is important to note that the V1 autospectrum appears in the denominator of this metric, and thus differences in spectral coherence between awake and anesthetized animals may result from the larger V1 LFP response in anesthetized animals. In addition, the interactions between V1 and PFC may deviate from linearity, leading to biased coherence results. Thus we further confirmed this finding of impaired mesoscale functional connectivity by determining the effect of anesthetics on nonlinear phase synchrony between the two cortical areas. In agreement with the spectral coherence data, averaged over the duration of the visual stimulation, awake animals exhibited greater V1-PFC PLV than animals anesthetized with iso/xylazine (Fig. 12C, group-averaged and time-averaged V1-PFC PLV). V1-PFC PLVs averaged within each frequency band during visual stimulation were significantly greater in awake animals compared with animals anesthetized with iso/xylazine (Fig. 12D, mean V1-PFC PLV during stimulation in each frequency band ± 1 SE for awake animals and animals anesthetized with 0.5% and 1.0% iso, respectively: delta = 0.91 ± 0.0035, 0.83 ± 0.0035, 0.82 ± 0.0029; theta = 0.92 ± 0.0032, 0.81 ± 0.0022, 0.82 ± 0.0016; alpha = 0.91 ± 0.0025, 0.80 ± 0.0036, 0.81 ± 0.0025; beta = 0.91 ± 0.0016, 0.81 ± 0.0010, 0.81 ± 0.0012; gamma = 0.91 ± 0.0014, 0.81 ± 0.0023, 0.81 ± 0.0018; all awake vs 0.5% iso and 1.0% iso for a given frequency band significantly different, F = 389.73, P < 0.05). Together, these results provide support for disruption of functional connectivity between V1 and PFC at the mesoscale by anesthetics.
Fig. 12.

Functional connectivity. Spectral coherence and phase synchrony during visual stimulation between V1 and PFC were reduced with iso-xylazine anesthetics. A: single electrodes in V1 and PFC were used to assess functional connectivity between these cortical areas. Group-averaged and time-averaged spectral coherence between V1 and PFC during visual stimulation. Spectral coherence was highest in awake animals (blue line) across frequencies compared with animals anesthetized with 0.5% iso with xlyazine (green line) or 1.0% iso with xlyazine (red line). B: mean spectral coherence between V1 and PFC during stimulation in each frequency band. Error bars indicate 1 SE. *Significantly different at P < 0.05. C: group-averaged and time-averaged phase synchrony between V1 and PFC (V1-PFC PLV) was highest in awake animals (blue line) across frequencies compared with animals anesthetized with 0.5% iso with xlyazine (green line) or 1.0% iso with xlyazine (red line). Awake animals exhibited a local peak in V1-PFC PLV in the theta frequency band. D: mean V1-PFC PLV during visual stimulation in each frequency band. Error bars indicate 1 SE. *Significantly different at P < 0.05.
DISCUSSION
Anesthetics profoundly alter brain activity and are widely used in both clinical practice and systems neuroscience research. During general anesthesia, spontaneous macroscopic network dynamics are fundamentally altered and have been thoroughly studied in humans using EEG (Brown et al. 2010; Katoh et al. 1998; Lennox 1949; Rampil 1998), electrocorticogram (Lewis et al. 2012), and recently with functional MRI (Heinke and Schwarzbauer 2002; Purdon et al. 2009). Also, the molecular targets of anesthetics have been well described and are composed of relatively complex sets of intrinsic and synaptic ion channels for most anesthetic agents (Brown et al. 2011; Campagna et al. 2003). The effects of anesthetics on intermediate, mesoscale network dynamics have been less well studied. A recent report has demonstrated layer-specific modulation of sensory-evoked activity in auditory cortex (Raz et al. 2014). A more complete understanding of the effects of anesthesia across lamina is crucial, since the architecture of the cortical microcircuits that span all cortical layers likely plays a fundamental role in cortical information processing (Binzegger et al. 2009). The importance of this question derives from the fact that a vast majority of system neuroscience studies of sensory processing have been performed in the anesthetized preparation due to obvious advantages of experimental stability and data throughput compared with the awake preparation. We here asked how sensory processing is altered during anesthesia, in particular how micro- and mesoscale activity in V1 and PFC and the functional connectivity between these areas are modulated.
Dynamics of visual responses.
The main findings of the present study demonstrate that the anesthetics used did not simply suppress sensory responses, but rather induced a set of specific changes to the temporal structure of both micro- and mesoscale response patterns. At the microscale of MUA, we found that the awake, freely viewing animal exhibited temporally precise, brief responses in V1 that were most pronounced at the stimulus onset and substantially reduced for the subsequent transitions in the visual stimulus. Anesthetics caused temporally prolonged MUA, with similar large-amplitude responses to each transition in the visual stimulus. At the mesoscale of the LFP, we found that anesthetics induced a more pronounced representation of the temporal structure of the stimulus and, accordingly, a tighter interaction between LFP and MUA (especially for low frequencies). Together, these results demonstrate that anesthetics alter the overall network dynamics in V1 during visual processing.
Timing and synaptic inhibition.
MUA in the awake animal exhibited precise timing and selective response to transitions in the visual input. Thus V1 acted as a “change detector” or high-pass filter. Precise timing of neuronal spiking has emerged as a hallmark of sensory processing in the visual (Tiesinga et al. 2008), auditory (Kayser et al. 2010; Lu et al. 2001), and somatosensory (Petersen et al. 2001) systems (but see also Oram et al. 1999). Precise timing of spiking responses likely emerges from the interaction of synaptic excitation and inhibition (Okun and Lampl 2008; Wehr and Zador 2003). For example, precise spike timing in layer IV of the somatosensory system is mediated by the feedforward recruitment of synaptic inhibition provided by fast-spiking inhibitory interneurons (Gabernet et al. 2005; Higley and Contreras 2006). Disruption of such precisely balanced synaptic excitation and inhibition could, therefore, represent a possible mechanism of action for the changes described here. Importantly, intracellular recordings in cortex of awake animals recently failed to provide evidence for the canonical regime of balanced excitation and inhibition (Haider et al. 2013; Rudolph et al. 2007). Rather, inhibition dominated in the awake animal, and balanced excitation and inhibition was found in the anesthetized animal (Haider et al. 2006) and in vitro (Shu et al. 2003).
Layer-specific modulation of network dynamics by anesthetics.
The observed layer-specific alterations of sensory processing during anesthesia likely stem from the interplay of several mechanisms at the molecular and cellular level. In particular, changes in neuromodulatory tone and synaptic inhibition as a function of layer are candidate mechanisms (Kimura et al. 2014). Xylazine, used in this study to achieve complete anesthesia for all concentrations of iso, acts as an α2-adrenergic agonist on presynaptic and postsynaptic receptors; iso acts to potentiate GABAA receptors, glycine receptors, 5-HT3 receptors, kainate receptors, and two-pore-domain background K+ channels, and inhibit nicotinic acetylcholine receptors, α-amino-3-hydroxy-5-methyl-4-isoxazolepropionic acid receptors, voltage-gated Na currents at nerve terminals, and at least some types of voltage-gated Ca channels (Eckle et al. 2012; Hemmings 2009; Hemmings et al. 2005; Patel et al. 1999; Rudolph and Antkowiak 2004). The specificity and efficacy of targeting at each of these binding sites, which can induce both complementary and competitive effects, could modulate sensory responses. In particular, bilateral norepinephrine projections to the visual cortex are robust, but exhibit different densities across supragranular, granular, and infragranular layers (Pinaud et al. 2006). In visual cortex of rats, microiontophoresis of norepinephrine enhanced visually evoked responses, while serotonin suppressed stimulus-evoked excitation and inhibition (Waterhouse et al. 1990). Therefore, differences in the laminar profile of sensory processing between awake and anesthetized animals may arise from action at these molecular targets, which are expressed in varying densities across cortical layers. Furthermore, layer-specific differences in inhibitory feedforward and feedback circuits could also contribute to the differing effects of anesthetics across layers. In particular, feedforward inhibition is pathway and layer specific, capable of modulating network activity through stronger feedforward inhibition and relatively weaker feedback inhibition (Yang et al. 2013). A reduction in synaptic inhibition caused by anesthetics could, therefore, account for the increase in visually evoked firing rates that we measured in layer IV of anesthetized animals.
In addition, projections from cholinergic nuclei to V1 (Pinaud et al. 2006) and PFC (Chandler et al. 2013) have been established. The release of acetylcholine in primary sensory cortices during sensory stimulation has been found to depend upon activity in PFC (Rasmusson et al. 2007). Thus disruption of cortico-cortical connectivity between V1 and PFC induced by anesthesia may contribute to altered visual responses in V1 via reduced acetylcholine release.
Relationship to previous studies of sensory processing in awake and anesthetized animals.
Previous work has investigated several aspects of alteration to electrophysiological sensory responses by anesthetic agents (Detsch et al. 1999; Schumacher et al. 2011; Villeneuve and Casanova 2003), demonstrating altered contextual (figure-ground) modulation but maintained receptive field properties (Lamme et al. 1998), impairment of motion integration (Pack et al. 2001), increased correlation structure of activity (Greenberg et al. 2008), and increased gamma oscillations in V1 induced by visual stimulation flashes (Imas et al. 2005) during anesthesia. We primarily utilized iso and xylazine in combination because of their widespread and historic use in studying sensory processing in the visual, auditory, and olfactory systems of both animals and humans (Heinke and Schwarzbauer 2001; Hudetz and Imas 2007; Madler et al. 1991; Rojas et al. 2008; Sebel et al. 1986; Villeneuve and Casanova 2003; Vincis et al. 2012). Our results demonstrated enhanced neural responses at the frequency of the presented stimulus, and we found that, with iso and xylazine anesthetics, visual responses were temporally prolonged compared with responses in awake animals. However, previous reports have demonstrated that anesthetics reduce the sustained portion of sensory responses. With pentobarbital/chloral hydrate anesthesia, only the phasic response to auditory stimuli were still present in recordings from rat primary auditory cortex (Gaese and Ostwald 2001). In addition, desflurane anesthesia induced differential changes in early and late poststimulus unit responses in V1 elicited by visual flash stimulation, with preserved reactivity of cortical units within 100 ms of stimulus presentation, but reduced late-component responses with deepening anesthesia (Hudetz et al. 2009). The reason for the apparent contradiction with our present results is not entirely clear, but may stem from anesthetic-induced changes in the number of units which were visually responsive and thus different findings from analysis at the single unit vs. multiunit level. Furthermore, given that the mechanism of action of anesthetic agents varies at the molecular level, it is likely that the differential effects of anesthetic agents extend to the systems level studied here.
Fundamental differences in sensory processing between awake and anesthetized animals are not unique to visual cortex. In agreement with our finding of temporally prolonged sensory-evoked responses during anesthesia, barrel cortex of rats anesthetized with urethane and chloral hydrate exhibited sustained sensory-evoked activity (Devonshire et al. 2010). At anesthetic depths prior to burst suppression, responses to auditory stimulation measured in auditory cortex were intact during iso anesthesia, whereas visually elicited modulation in auditory cortex was reduced (Raz et al. 2014). These results nicely complement our results that, during anesthesia, sensory responses are maintained only in the primary sensory cortex for the matched modality of stimulation, but responses to sensory stimulation across cortical areas are silenced.
Disruption of cortico-cortical connectivity during anesthesia.
Primary sensory cortices do not operate in isolation, but rather send projections to and receive projections from higher cortical areas such as PFC that play a crucial role in defining overall state by mechanisms such as allocation of attention (Buschman and Miller 2007; Gregoriou et al. 2009). Top-down feedback facilitates the processing of task-relevant information (Morishima et al. 2009) and modulates activity in sensory cortices (Anton-Erxleben et al. 2009; Fritz et al. 2003). Intriguingly, recent evidence suggests that impairment of such information flow between cortical areas represents a network mechanism of action for anesthetics (Alkire et al. 2008; Bonhomme et al. 2012; Raz et al. 2014). Specifically, studies using EEG and functional MRI have demonstrated that general anesthesia alters the functional connectivity and information transfer between anterior and posterior areas of the brain (Jordan et al. 2013; Lee et al. 2013). A study of healthy human subjects anesthetized with propofol suggested that cognitive binding, defined as the integration of low-order neural representations of sensory stimuli with high-order cortices (Mashour 2004), is disrupted by blocking the projection of the sensory information to high-order processing networks (Liu et al. 2012). Our results support this model and provide increased temporal and spatial resolution of these effects of anesthesia. We found that anesthetics reduced visual- and auditory-evoked phase-locking responses in PFC, and that anesthetics limited responses in V1 elicited by auditory stimulation. This agrees with imaging studies that demonstrated decreases in fronto-parietal functional connectivity and in cross-modal interactions between auditory and visual areas (Boveroux et al. 2010; Schrouff et al. 2011). Furthermore, we found that cortico-cortical interactions between V1 and PFC were disrupted by anesthetics, as assessed through both amplitude and phase measures. A study of event-related potentials in anesthetized rats similarly found reduced long-range antero-posterior coherence (Imas et al. 2006). In seeming contrast to the disruption of cortical connectivity during anesthesia, some studies have demonstrated cross-modal responses during iso anesthesia (Land et al. 2012; Takagaki et al. 2008); however, these results were only obtained under conditions of burst suppression and were attributed to propagating waves of activity across cortical areas, which together suggest a different mechanism of action.
In awake animals, we found MUA responses in PFC elicited by visual and auditory stimulation. These results are particularly interesting in light of a previous study which did not find MUA responses in frontal cortex of ferrets in response to auditory stimuli presented during passive listening (Fritz et al. 2010). The stimuli used in our study were “broadband” stimuli (white auditory noise and visual checker board patterns) which may have recruited bottom-up attention, thus explaining this difference. Bottom-up attention is elicited by a salient stimulus and is believed to involve different neural pathways compared with other forms of attention (Miller and Buschman 2013). Furthermore, the behavioral training status of the animals was different; the animals in the present study were completely untrained, while Fritz et al. (2010) studied animals which had been trained in an auditory discrimination task. Although the animals were not engaged in a behavioral task during the presentation of the auditory stimuli, the global brain state may have been different because of effortful inhibition of behavioral responses or monitoring for a switch to the active condition. Lastly, it needs to be emphasized that precise anatomical and functional demarcations of ferret frontal cortex are currently missing, and it is therefore possible that slight differences in recording locations across studies lead to different findings. Together, these differences may explain the modest spiking responses we found in our study.
Our findings provide insight at the mesoscopic network-level of two cortical areas, which could account for previous reports of reduced functional connectivity as measured through blood oxygenation level-dependent signals, and anesthetic-induced decreases in directional connectivity at the level of EEG in human subjects anesthetized with propofol, ketamine, or sevoflurane (Jordan et al. 2013; Lee et al. 2013; Mashour 2013). Loss of consciousness induced by other pharmacological agents, such as the benzodiazepine midazolam, also induced a breakdown of cortical functional connectivity (Ferrarelli et al. 2010). Interruption of cortico-cortical signaling agrees with the framework that anesthetics disrupt cortical functional connectivity and integration (Alkire et al. 2008; Mashour 2004; Nallasamy and Tsao 2011) and functionally isolate different neuronal networks (Lewis et al. 2012). Modeling work has demonstrated that reduced functional connectivity between cortical areas during slow-wave sleep may be caused by a shift in the balance of synaptic excitation and inhibition (Esser et al. 2009), a mechanism which could also underlie anesthesia and aligns nicely with experiments demonstrating altered synaptic excitation and inhibition induced by anesthesia. Additionally, indirect cortico-thalamo-cortical loops are also impaired by anesthetics and may, therefore, also contribute to the functional disconnectivity found in our study (Alkire and Miller 2005).
As with any study, there are limitations to the experiments discussed here. All doses of anesthetics administered corresponded to general anesthesia with the same behavioral state: animals had lost the righting reflex and were unresponsive to toe pinch. This may explain the limited dose-dependent differences. Other studies have more completely investigated differing depths of anesthesia, ranging from sedation to unconscious immobility (Hudetz et al. 2009). In addition, not all animals in the study were recorded from during both the awake and anesthetized conditions. Previous reports have found that spontaneous firing rates can be affected by anesthetics; thus the background MUA activity (sometimes referred to as noise level) could have been reduced in the case of anesthetized recordings. Specifically, work performed in cultured brain slices (Antkowiak and Helfrich-Forster 1998) and in vivo (Hentschke et al. 2005) have demonstrated that volatile anesthetics, including iso, administered at one-half the concentration used for general anesthesia and at concentrations inducing hypnosis in humans, decreased spontaneous action potential firing in neocortical neurons. Somatosensory cortex of urethane-anesthetized rats exhibited rhythmic bursts of synchronized action potential firing, which led to decreased overall spontaneous firing rate (Erchova et al. 2002). Direct pairwise comparisons between the awake and anesthetized condition in the same animal could reduce potential confounds of interanimal differences in neural dynamics. Such a study design could have been achieved by recording from chronically implanted probes from each animal daily in both the awake and anesthetized conditions. Despite these limitations, we believe this work provides a framework for interpreting sensory responses recorded in anesthetized animals and insight into fundamental mechanisms of action of anesthetic agents.
GRANTS
This work was supported by University of North Carolina Psychiatry, University of North Carolina School of Medicine, and the Foundation of Hope. Research reported in this publication was partially supported by the National Institute of Mental Health of the National Institutes of Health (NIH) under Award no. R01-MH-101547. Part of the work has been supported by the European Research Council under the European Union's Seventh Framework Programme (FP7/2007-2013)/ERC Grant Agreement no. 257253.
DISCLAIMER
The content is solely the responsibility of the authors and does not necessarily represent the official views of the NIH.
DISCLOSURES
No conflicts of interest, financial or otherwise, are declared by the author(s).
AUTHOR CONTRIBUTIONS
Author contributions: K.K.S., D.V.B., and F.F. conception and design of research; K.K.S., D.V.B., and F.F. performed experiments; K.K.S., D.V.B., A.H., and F.F. analyzed data; K.K.S., A.H., J.H.W., and F.F. interpreted results of experiments; K.K.S. and F.F. prepared figures; K.K.S., D.V.B., and F.F. drafted manuscript; K.K.S., D.V.B., A.H., J.H.W., and F.F. edited and revised manuscript; K.K.S., D.V.B., A.H., J.H.W., and F.F. approved final version of manuscript.
ACKNOWLEDGMENTS
The authors thank Dr. Jennifer Bizley for insight on recording in awake ferrets, Dr. Susanne Radtke-Schuller for input on the interpretation of ferret neuroanatomy, Luke Campagnola and Dr. Paul Manis for assistance with acoustic measurements, and the members of the Fröhlich laboratory for support, particularly Dr. Chunxiu Yu, Stephanie Belhorn, Michael Boyle, Steve Schmidt, Mohsin Ali, and Helen Powell.
REFERENCES
- Alkire MT. Loss of effective connectivity during general anesthesia. Int Anesthesiol Clin 46: 55–73, 2008. [DOI] [PubMed] [Google Scholar]
- Alkire MT, Hudetz AG, Tononi G. Consciousness and anesthesia. Science 322: 876–880, 2008. [DOI] [PMC free article] [PubMed] [Google Scholar]
- Alkire MT, Miller J. General anesthesia and the neural correlates of consciousness. Prog Brain Res 150: 229–244, 2005. [DOI] [PubMed] [Google Scholar]
- Antkowiak B, Helfrich-Forster C. Effects of small concentrations of volatile anesthetics on action potential firing of neocortical neurons in vitro. Anesthesiology 88: 1592–1605, 1998. [DOI] [PubMed] [Google Scholar]
- Anton-Erxleben K, Stephan VM, Treue S. Attention reshapes center-surround receptive field structure in macaque cortical area MT. Cereb Cortex 19: 2466–2478, 2009. [DOI] [PMC free article] [PubMed] [Google Scholar]
- Binzegger T, Douglas RJ, Martin KA. Topology and dynamics of the canonical circuit of cat V1. Neural Netw 22: 1071–1078, 2009. [DOI] [PubMed] [Google Scholar]
- Bonhomme V, Boveroux P, Brichant JF, Laureys S, Boly M. Neural correlates of consciousness during general anesthesia using functional magnetic resonance imaging (fMRI). Arch Ital Biol 150: 155–163, 2012. [DOI] [PubMed] [Google Scholar]
- Boveroux P, Vanhaudenhuyse A, Bruno MA, Noirhomme Q, Lauwick S, Luxen A, Degueldre C, Plenevaux A, Schnakers C, Phillips C, Brichant JF, Bonhomme V, Maquet P, Greicius MD, Laureys S, Boly M. Breakdown of within- and between-network resting state functional magnetic resonance imaging connectivity during propofol-induced loss of consciousness. Anesthesiology 113: 1038–1053, 2010. [DOI] [PubMed] [Google Scholar]
- Brainard DH. The Psychophysics Toolbox. Spat Vis 10: 433–436, 1997. [PubMed] [Google Scholar]
- Brown EN, Lydic R, Schiff ND. General anesthesia, sleep, coma. N Engl J Med 363: 2638–2650, 2010. [DOI] [PMC free article] [PubMed] [Google Scholar]
- Brown EN, Purdon PL, Van Dort CJ. General anesthesia and altered states of arousal: a systems neuroscience analysis. Annu Rev Neurosci 34: 601–628, 2011. [DOI] [PMC free article] [PubMed] [Google Scholar]
- Buschman TJ, Miller EK. Top-down versus bottom-up control of attention in the prefrontal and posterior parietal cortices. Science 315: 1860–1862, 2007. [DOI] [PubMed] [Google Scholar]
- Campagna JA, Miller KW, Forman SA. Mechanisms of actions of inhaled anesthetics. N Engl J Med 348: 2110–2124, 2003. [DOI] [PubMed] [Google Scholar]
- Cantone G, Xiao J, McFarlane N, Levitt JB. Feedback connections to ferret striate cortex: direct evidence for visuotopic convergence of feedback inputs. J Comp Neurol 487: 312–331, 2005. [DOI] [PubMed] [Google Scholar]
- Chandler DJ, Lamperski CS, Waterhouse BD. Identification and distribution of projections from monoaminergic and cholinergic nuclei to functionally differentiated subregions of prefrontal cortex. Brain Res 1522: 38–58, 2013. [DOI] [PMC free article] [PubMed] [Google Scholar]
- Davidson G, Plumb DC. Veterinary Drug Handbook. Ames, Iowa: Iowa State Press, 2003, p. 177. [Google Scholar]
- Detsch O, Vahle-Hinz C, Kochs E, Siemers M, Bromm B. Isoflurane induces dose-dependent changes of thalamic somatosensory information transfer. Brain Res 829: 77–89, 1999. [DOI] [PubMed] [Google Scholar]
- Devonshire IM, Grandy TH, Dommett EJ, Greenfield SA. Effects of urethane anaesthesia on sensory processing in the rat barrel cortex revealed by combined optical imaging and electrophysiology. Eur J Neurosci 32: 786–797, 2010. [DOI] [PubMed] [Google Scholar]
- Duque A, McCormick DA. Circuit-based localization of ferret prefrontal cortex. Cereb Cortex 20: 1020–1036, 2010. [DOI] [PMC free article] [PubMed] [Google Scholar]
- Eckle VS, Digruccio MR, Uebele VN, Renger JJ, Todorovic SM. Inhibition of T-type calcium current in rat thalamocortical neurons by isoflurane. Neuropharmacology 63: 266–273, 2012. [DOI] [PMC free article] [PubMed] [Google Scholar]
- Erchova IA, Lebedev MA, Diamond ME. Somatosensory cortical neuronal population activity across states of anaesthesia. Eur J Neurosci 15: 744–752, 2002. [DOI] [PubMed] [Google Scholar]
- Esser SK, Hill S, Tononi G. Breakdown of effective connectivity during slow wave sleep: investigating the mechanism underlying a cortical gate using large-scale modeling. J Neurophysiol 102: 2096–2111, 2009. [DOI] [PMC free article] [PubMed] [Google Scholar]
- Ferrarelli F, Massimini M, Sarasso S, Casali A, Riedner BA, Angelini G, Tononi G, Pearce RA. Breakdown in cortical effective connectivity during midazolam-induced loss of consciousness. Proc Natl Acad Sci U S A 107: 2681–2686, 2010. [DOI] [PMC free article] [PubMed] [Google Scholar]
- Fries P, Reynolds JH, Rorie AE, Desimone R. Modulation of oscillatory neuronal synchronization by selective visual attention. Science 291: 1560–1563, 2001. [DOI] [PubMed] [Google Scholar]
- Fritz J, Shamma S, Elhilali M, Klein D. Rapid task-related plasticity of spectrotemporal receptive fields in primary auditory cortex. Nat Neurosci 6: 1216–1223, 2003. [DOI] [PubMed] [Google Scholar]
- Fritz JB, David SV, Radtke-Schuller S, Yin P, Shamma SA. Adaptive, behaviorally gated, persistent encoding of task-relevant auditory information in ferret frontal cortex. Nat Neurosci 13: 1011–1019, 2010. [DOI] [PMC free article] [PubMed] [Google Scholar]
- Gabernet L, Jadhav SP, Feldman DE, Carandini M, Scanziani M. Somatosensory integration controlled by dynamic thalamocortical feed-forward inhibition. Neuron 48: 315–327, 2005. [DOI] [PubMed] [Google Scholar]
- Gaese BH, Ostwald J. Anesthesia changes frequency tuning of neurons in the rat primary auditory cortex. J Neurophysiol 86: 1062–1066, 2001. [DOI] [PubMed] [Google Scholar]
- Gilbert CD. Laminar differences in receptive field properties of cells in cat primary visual cortex. J Physiol 268: 391–421, 1977. [DOI] [PMC free article] [PubMed] [Google Scholar]
- Goupillaud P, Grossmann A, Morlet J. Cycle-octave and related transforms in seismic signal analysis. Geoexploration 23: 85–102, 1984. [Google Scholar]
- Greenberg DS, Houweling AR, Kerr JN. Population imaging of ongoing neuronal activity in the visual cortex of awake rats. Nat Neurosci 11: 749–751, 2008. [DOI] [PubMed] [Google Scholar]
- Gregoriou GG, Gotts SJ, Zhou H, Desimone R. High-frequency, long-range coupling between prefrontal and visual cortex during attention. Science 324: 1207–1210, 2009. [DOI] [PMC free article] [PubMed] [Google Scholar]
- Haider B, Duque A, Hasenstaub AR, McCormick DA. Neocortical network activity in vivo is generated through a dynamic balance of excitation and inhibition. J Neurosci 26: 4535–4545, 2006. [DOI] [PMC free article] [PubMed] [Google Scholar]
- Haider B, Hausser M, Carandini M. Inhibition dominates sensory responses in the awake cortex. Nature 493: 97–100, 2013. [DOI] [PMC free article] [PubMed] [Google Scholar]
- Heinke W, Koelsch S. The effects of anesthetics on brain activity and cognitive function. Curr Opin Anaesthesiol 18: 625–631, 2005. [DOI] [PubMed] [Google Scholar]
- Heinke W, Schwarzbauer C. In vivo imaging of anaesthetic action in humans: approaches with positron emission tomography (PET) and functional magnetic resonance imaging (fMRI). Br J Anaesth 89: 112–122, 2002. [DOI] [PubMed] [Google Scholar]
- Heinke W, Schwarzbauer C. Subanesthetic isoflurane affects task-induced brain activation in a highly specific manner: a functional magnetic resonance imaging study. Anesthesiology 94: 973–981, 2001. [DOI] [PubMed] [Google Scholar]
- Hemmings HC., Jr Sodium channels and the synaptic mechanisms of inhaled anaesthetics. Br J Anaesth 103: 61–69, 2009. [DOI] [PMC free article] [PubMed] [Google Scholar]
- Hemmings HC Jr, Akabas MH, Goldstein PA, Trudell JR, Orser BA, Harrison NL. Emerging molecular mechanisms of general anesthetic action. Trends Pharmacol Sci 26: 503–510, 2005. [DOI] [PubMed] [Google Scholar]
- Hentschke H, Schwarz C, Antkowiak B. Neocortex is the major target of sedative concentrations of volatile anaesthetics: strong depression of firing rates and increase of GABAA receptor-mediated inhibition. Eur J Neurosci 21: 93–102, 2005. [DOI] [PubMed] [Google Scholar]
- Higley MJ, Contreras D. Balanced excitation and inhibition determine spike timing during frequency adaptation. J Neurosci 26: 448–457, 2006. [DOI] [PMC free article] [PubMed] [Google Scholar]
- Hirsch JA, Martinez LM. Laminar processing in the visual cortical column. Curr Opin Neurobiol 16: 377–384, 2006. [DOI] [PubMed] [Google Scholar]
- Hubel DH, Wiesel TN. Receptive fields of single neurones in the cat's striate cortex. J Physiol 148: 574–591, 1959. [DOI] [PMC free article] [PubMed] [Google Scholar]
- Hudetz AG, Imas OA. Burst activation of the cerebral cortex by flash stimuli during isoflurane anesthesia in rats. Anesthesiology 107: 983–991, 2007. [DOI] [PubMed] [Google Scholar]
- Hudetz AG, Vizuete JA, Imas OA. Desflurane selectively suppresses long-latency cortical neuronal response to flash in the rat. Anesthesiology 111: 231–239, 2009. [DOI] [PMC free article] [PubMed] [Google Scholar]
- Imas OA, Ropella KM, Ward BD, Wood JD, Hudetz AG. Volatile anesthetics enhance flash-induced gamma oscillations in rat visual cortex. Anesthesiology 102: 937–947, 2005. [DOI] [PubMed] [Google Scholar]
- Imas OA, Ropella KM, Wood JD, Hudetz AG. Isoflurane disrupts anterio-posterior phase synchronization of flash-induced field potentials in the rat. Neurosci Lett 402: 216–221, 2006. [DOI] [PubMed] [Google Scholar]
- John ER, Prichep LS, Kox W, Valdes-Sosa P, Bosch-Bayard J, Aubert E, Tom M, diMichele F, Gugino LD. Invariant reversible QEEG effects of anesthetics. Conscious Cogn 10: 165–183, 2001. [DOI] [PubMed] [Google Scholar]
- Jordan D, Ilg R, Riedl V, Schorer A, Grimberg S, Neufang S, Omerovic A, Berger S, Untergehrer G, Preibisch C, Schulz E, Schuster T, Schroter M, Spoormaker V, Zimmer C, Hemmer B, Wohlschlager A, Kochs EF, Schneider G. Simultaneous electroencephalographic and functional magnetic resonance imaging indicate impaired cortical top-down processing in association with anesthetic-induced unconsciousness. Anesthesiology 119: 1031–1042, 2013. [DOI] [PubMed] [Google Scholar]
- Katoh T, Suzuki A, Ikeda K. Electroencephalographic derivatives as a tool for predicting the depth of sedation and anesthesia induced by sevoflurane. Anesthesiology 88: 642–650, 1998. [DOI] [PubMed] [Google Scholar]
- Kayser C, Logothetis NK, Panzeri S. Millisecond encoding precision of auditory cortex neurons. Proc Natl Acad Sci U S A 107: 16976–16981, 2010. [DOI] [PMC free article] [PubMed] [Google Scholar]
- Kimura R, Safari MS, Mirnajafi-Zadeh J, Kimura R, Ebina T, Yanagawa Y, Sohya K, Tsumoto T. Curtailing effect of awakening on visual responses of cortical neurons by cholinergic activation of inhibitory circuits. J Neurosci 34: 10122–10133, 2014. [DOI] [PMC free article] [PubMed] [Google Scholar]
- Kohn DF. Anesthesia and Analgesia in Laboratory Animals. San Diego, CA: Academic, 1997, p. xvii, 426. [Google Scholar]
- Kreuzer M, Hentschke H, Antkowiak B, Schwarz C, Kochs EF, Schneider G. Cross-approximate entropy of cortical local field potentials quantifies effects of anesthesia–a pilot study in rats. BMC Neurosci 11: 122, 2010. [DOI] [PMC free article] [PubMed] [Google Scholar]
- Krieg J, Trebuchon-Da Fonseca A, Martinez-Montes E, Marquis P, Liegeois-Chauvel C, Benar CG. A comparison of methods for assessing alpha phase resetting in electrophysiology, with application to intracerebral EEG in visual areas. Neuroimage 55: 67–86, 2011. [DOI] [PubMed] [Google Scholar]
- Lachaux JP, Rodriguez E, Martinerie J, Varela FJ. Measuring phase synchrony in brain signals. Hum Brain Mapp 8: 194–208, 1999. [DOI] [PMC free article] [PubMed] [Google Scholar]
- Lamme VA, Zipser K, Spekreijse H. Figure-ground activity in primary visual cortex is suppressed by anesthesia. Proc Natl Acad Sci U S A 95: 3263–3268, 1998. [DOI] [PMC free article] [PubMed] [Google Scholar]
- Land R, Engler G, Kral A, Engel AK. Auditory evoked bursts in mouse visual cortex during isoflurane anesthesia. PLos One 7: e49855, 2012. [DOI] [PMC free article] [PubMed] [Google Scholar]
- Lee U, Ku S, Noh G, Baek S, Choi B, Mashour GA. Disruption of frontal-parietal communication by ketamine, propofol, and sevoflurane. Anesthesiology 118: 1264–1275, 2013. [DOI] [PMC free article] [PubMed] [Google Scholar]
- Lennox WG. Influence of drugs on the human electroencephalogram. Electroencephalogr Clin Neurophysiol 1: 45–51, 1949. [PubMed] [Google Scholar]
- Lewis LD, Weiner VS, Mukamel EA, Donoghue JA, Eskandar EN, Madsen JR, Anderson WS, Hochberg LR, Cash SS, Brown EN, Purdon PL. Rapid fragmentation of neuronal networks at the onset of propofol-induced unconsciousness. Proc Natl Acad Sci U S A 109: E3377–E3386, 2012a. [DOI] [PMC free article] [PubMed] [Google Scholar]
- Liu X, Lauer KK, Ward BD, Rao SM, Li SJ, Hudetz AG. Propofol disrupts functional interactions between sensory and high-order processing of auditory verbal memory. Hum Brain Mapp 33: 2487–2498, 2012. [DOI] [PMC free article] [PubMed] [Google Scholar]
- Lu T, Liang L, Wang X. Temporal and rate representations of time-varying signals in the auditory cortex of awake primates. Nat Neurosci 4: 1131–1138, 2001. [DOI] [PubMed] [Google Scholar]
- Madler C, Keller I, Schwender D, Poppel E. Sensory information processing during general anaesthesia: effect of isoflurane on auditory evoked neuronal oscillations. Br J Anaesth 66: 81–87, 1991. [DOI] [PubMed] [Google Scholar]
- Martinez-Montes E, Cuspineda-Bravo ER, El-Deredy W, Sanchez-Bornot JM, Lage-Castellanos A, Valdes-Sosa PA. Exploring event-related brain dynamics with tests on complex valued time-frequency representations. Stat Med 27: 2922–2947, 2008. [DOI] [PubMed] [Google Scholar]
- Mashour GA. Consciousness and the 21st century operating room. Anesthesiology 119: 1003–1005, 2013. [DOI] [PMC free article] [PubMed] [Google Scholar]
- Mashour GA. Consciousness unbound: toward a paradigm of general anesthesia. Anesthesiology 100: 428–433, 2004. [DOI] [PubMed] [Google Scholar]
- Miller EK, Buschman TJ. Cortical circuits for the control of attention. Curr Opin Neurobiol 23: 216–222, 2013. [DOI] [PMC free article] [PubMed] [Google Scholar]
- Moeller S, Nallasamy N, Tsao DY, Freiwald WA. Functional connectivity of the macaque brain across stimulus and arousal states. J Neurosci 29: 5897–5909, 2009. [DOI] [PMC free article] [PubMed] [Google Scholar]
- Morishima Y, Akaishi R, Yamada Y, Okuda J, Toma K, Sakai K. Task-specific signal transmission from prefrontal cortex in visual selective attention. Nat Neurosci 12: 85–91, 2009. [DOI] [PubMed] [Google Scholar]
- Nallasamy N, Tsao DY. Functional connectivity in the brain: effects of anesthesia. Neuroscientist 17: 94–106, 2011. [DOI] [PubMed] [Google Scholar]
- Okun M, Lampl I. Instantaneous correlation of excitation and inhibition during ongoing and sensory-evoked activities. Nat Neurosci 11: 535–537, 2008. [DOI] [PubMed] [Google Scholar]
- Opris I, Hampson RE, Stanford TR, Gerhardt GA, Deadwyler SA. Neural activity in frontal cortical cell layers: evidence for columnar sensorimotor processing. J Cogn Neurosci 23: 1507–1521, 2011. [DOI] [PMC free article] [PubMed] [Google Scholar]
- Oram MW, Wiener MC, Lestienne R, Richmond BJ. Stochastic nature of precisely timed spike patterns in visual system neuronal responses. J Neurophysiol 81: 3021–3033, 1999. [DOI] [PubMed] [Google Scholar]
- Pack CC, Berezovskii VK, Born RT. Dynamic properties of neurons in cortical area MT in alert and anaesthetized macaque monkeys. Nature 414: 905–908, 2001. [DOI] [PubMed] [Google Scholar]
- Patel AJ, Honore E, Lesage F, Fink M, Romey G, Lazdunski M. Inhalational anesthetics activate two-pore-domain background K+ channels. Nat Neurosci 2: 422–426, 1999. [DOI] [PubMed] [Google Scholar]
- Petersen RS, Panzeri S, Diamond ME. Population coding of stimulus location in rat somatosensory cortex. Neuron 32: 503–514, 2001. [DOI] [PubMed] [Google Scholar]
- Pinaud R, Tremere LA, De Weerd P. Plasticity in the Visual System: From Genes to Circuits. New York: Springer, 2006, p. xv, 364. [Google Scholar]
- Purdon PL, Pierce ET, Bonmassar G, Walsh J, Harrell PG, Kwo J, Deschler D, Barlow M, Merhar RC, Lamus C, Mullaly CM, Sullivan M, Maginnis S, Skoniecki D, Higgins HA, Brown EN. Simultaneous electroencephalography and functional magnetic resonance imaging of general anesthesia. Ann N Y Acad Sci 1157: 61–70, 2009. [DOI] [PMC free article] [PubMed] [Google Scholar]
- Rampil IJ. A primer for EEG signal processing in anesthesia. Anesthesiology 89: 980–1002, 1998. [DOI] [PubMed] [Google Scholar]
- Rasmusson DD, Smith SA, Semba K. Inactivation of prefrontal cortex abolishes cortical acetylcholine release evoked by sensory or sensory pathway stimulation in the rat. Neuroscience 149: 232–241, 2007. [DOI] [PubMed] [Google Scholar]
- Raz A, Grady SM, Krause BM, Uhlrich DJ, Manning KA, Banks MI. Preferential effect of isoflurane on top-down vs. bottom-up pathways in sensory cortex. Front Syst Neurosci 8: 191, 2014. [DOI] [PMC free article] [PubMed] [Google Scholar]
- Rojas MJ, Navas JA, Greene SA, Rector DM. Discrimination of auditory stimuli during isoflurane anesthesia. Comp Med 58: 454–457, 2008. [PMC free article] [PubMed] [Google Scholar]
- Rudolph M, Pospischil M, Timofeev I, Destexhe A. Inhibition determines membrane potential dynamics and controls action potential generation in awake and sleeping cat cortex. J Neurosci 27: 5280–5290, 2007. [DOI] [PMC free article] [PubMed] [Google Scholar]
- Rudolph U, Antkowiak B. Molecular and neuronal substrates for general anaesthetics. Nat Rev Neurosci 5: 709–720, 2004. [DOI] [PubMed] [Google Scholar]
- Schrouff J, Perlbarg V, Boly M, Marrelec G, Boveroux P, Vanhaudenhuyse A, Bruno MA, Laureys S, Phillips C, Pelegrini-Issac M, Maquet P, Benali H. Brain functional integration decreases during propofol-induced loss of consciousness. Neuroimage 57: 198–205, 2011. [DOI] [PubMed] [Google Scholar]
- Schumacher JW, Schneider DM, Woolley SM. Anesthetic state modulates excitability but not spectral tuning or neural discrimination in single auditory midbrain neurons. J Neurophysiol 106: 500–514, 2011. [DOI] [PMC free article] [PubMed] [Google Scholar]
- Sebel PS, Ingram DA, Flynn PJ, Rutherfoord CF, Rogers H. Evoked potentials during isoflurane anaesthesia. Br J Anaesth 58: 580–585, 1986. [DOI] [PubMed] [Google Scholar]
- Sellers KK, Bennett DV, Fröhlich F. Frequency-band signatures of visual responses to naturalistic input in ferret primary visual cortex during free viewing. Brain Res 1598: 31–45, 2015. [DOI] [PMC free article] [PubMed] [Google Scholar]
- Sellers KK, Bennett DV, Hutt A, Fröhlich F. Anesthesia differentially modulates spontaneous network dynamics by cortical area and layer. J Neurophysiol 110: 2739–2751, 2013. [DOI] [PubMed] [Google Scholar]
- Shu Y, Hasenstaub A, McCormick DA. Turning on and off recurrent balanced cortical activity. Nature 423: 288–293, 2003. [DOI] [PubMed] [Google Scholar]
- Takagaki K, Zhang C, Wu JY, Lippert MT. Crossmodal propagation of sensory-evoked and spontaneous activity in the rat neocortex. Neurosci Lett 431: 191–196, 2008. [DOI] [PMC free article] [PubMed] [Google Scholar]
- Tallon-Baudry C, Bertrand O, Delpuech C, Pernier J. Stimulus specificity of phase-locked and non-phase-locked 40 Hz visual responses in human. J Neurosci 16: 4240–4249, 1996. [DOI] [PMC free article] [PubMed] [Google Scholar]
- Tiesinga P, Fellous JM, Sejnowski TJ. Regulation of spike timing in visual cortical circuits. Nat Rev Neurosci 9: 97–107, 2008. [DOI] [PMC free article] [PubMed] [Google Scholar]
- Ulbert I, Halgren E, Heit G, Karmos G. Multiple microelectrode-recording system for human intracortical applications. J Neurosci Methods 106: 69–79, 2001. [DOI] [PubMed] [Google Scholar]
- van Vugt MK, Sederberg PB, Kahana MJ. Comparison of spectral analysis methods for characterizing brain oscillations. J Neurosci Methods 162: 49–63, 2007. [DOI] [PMC free article] [PubMed] [Google Scholar]
- Villeneuve MY, Casanova C. On the use of isoflurane versus halothane in the study of visual response properties of single cells in the primary visual cortex. J Neurosci Methods 129: 19–31, 2003. [DOI] [PubMed] [Google Scholar]
- Vincent JL, Patel GH, Fox MD, Snyder AZ, Baker JT, Van Essen DC, Zempel JM, Snyder LH, Corbetta M, Raichle ME. Intrinsic functional architecture in the anaesthetized monkey brain. Nature 447: 83–86, 2007. [DOI] [PubMed] [Google Scholar]
- Vincis R, Gschwend O, Bhaukaurally K, Beroud J, Carleton A. Dense representation of natural odorants in the mouse olfactory bulb. Nat Neurosci 15: 537–539, 2012. [DOI] [PMC free article] [PubMed] [Google Scholar]
- Waterhouse BD, Azizi SA, Burne RA, Woodward DJ. Modulation of rat cortical area 17 neuronal responses to moving visual stimuli during norepinephrine and serotonin microiontophoresis. Brain Res 514: 276–292, 1990. [DOI] [PubMed] [Google Scholar]
- Wehr M, Zador AM. Balanced inhibition underlies tuning and sharpens spike timing in auditory cortex. Nature 426: 442–446, 2003. [DOI] [PubMed] [Google Scholar]
- White NS, Alkire MT. Impaired thalamocortical connectivity in humans during general-anesthetic-induced unconsciousness. Neuroimage 19: 402–411, 2003. [DOI] [PubMed] [Google Scholar]
- Yang W, Carrasquillo Y, Hooks BM, Nerbonne JM, Burkhalter A. Distinct balance of excitation and inhibition in an interareal feedforward and feedback circuit of mouse visual cortex. J Neurosci 33: 17373–17384, 2013. [DOI] [PMC free article] [PubMed] [Google Scholar]
- Zhan Y, Halliday D, Jiang P, Liu X, Feng J. Detecting time-dependent coherence between non-stationary electrophysiological signals–a combined statistical and time-frequency approach. J Neurosci Methods 156: 322–332, 2006. [DOI] [PubMed] [Google Scholar]