

Abstract
Resting state functional MRI (rs-fMRI) has been previously shown to be a promising tool for the assessment of early Parkinson's disease (PD). In order to assess whether changes within the basal ganglia network (BGN) are disease specific or relate to neurodegeneration generally, BGN connectivity was assessed in 32 patients with early PD, 19 healthy controls and 31 patients with Alzheimer's disease (AD). Voxel-wise comparisons demonstrated decreased connectivity within the basal ganglia of patients with PD, when compared to patients with AD and healthy controls. No significant changes within the BGN were seen in AD, when compared to healthy controls. Moreover, measures of functional connectivity extracted from regions within the basal ganglia were significantly lower in the PD group. Consistent with previous radiotracer studies, the greatest change when compared to the healthy control group was seen in the posterior putamen of PD subjects. When combined into a single component score, this method differentiated PD from AD and healthy control subjects, with a diagnostic accuracy of 81%. Rs-fMRI can be used to demonstrate the aberrant functional connectivity within the basal ganglia of patients with early PD. These changes are likely to be representative of patho-physiological basal ganglia dysfunction and are not associated with generalised neurodegeneration seen in AD. Further studies are necessary to ascertain whether this method is sensitive enough to detect basal ganglia dysfunction in prodromal PD, and its utility as a potential diagnostic biomarker for premotor and early motoric disease.
Keywords: Basal ganglia, Parkinson's disease, Parkinsonism, fMRI, Functional connectivity, Alzheimer's disease
Highlights
-
•
We assess resting state connectivity within the basal ganglia network of patients with PD, AD and healthy controls.
-
•
Connectivity within the basal ganglia is significantly lower in patients with PD, compared to the other two groups.
-
•
Changes are likely to represent basal ganglia dysfunction and are not associated with generalised neurodegeneration.
-
•
We differentiated patients with PD from those with AD and healthy control subjects with a diagnostic accuracy of 81%.
1. Introduction
Parkinson's disease (PD) is a progressive, neurodegenerative disorder characterised by the cardinal motor symptoms of resting tremor, rigidity, bradykinesia and postural instability (Jankovic, 2008). At the time these symptoms first emerge, and the clinical diagnosis of PD can be made, approximately 70% of the dopaminergic neurons within the ventro-lateral tier of the substantia nigra pars compacta have been irreversibly lost (Fearnley and Lees, 1991). It has been suggested that the loss of these neurons may begin 5–10 years prior to the onset of first motor symptoms (Fearnley and Lees, 1991). Intervention during this stage of the disease is likely to have the biggest impact on the natural history of the disease, slowing progression or even preventing the onset of the cardinal symptoms.
Whilst this prodromal stage of the disease is characterised by a plethora of non-motor symptoms, such as depression and anxiety (Shiba et al., 2000), constipation (Abbott et al., 2001) and hyposmia (Ross et al., 2008), and associated motor symptoms, such as REM sleep behaviour (Schenck et al., 2013), most of these lack the specificity necessary to diagnose early disease. Therefore, there is a critical need for biomarkers in PD to enable diagnosis in the prodromal phase and identify individuals who may benefit from future targeted therapies. Objective biomarkers are also necessary to monitor disease progression and demonstrate treatment efficacy.
Resting state functional fMRI (rs-fMRI) has shown promise as a potential biomarker in a number of neurodegenerative conditions (Balthazar et al., 2014; Dopper et al., 2014; Wolf et al., 2014). Over the past few years, the identification of the resting state basal ganglia network (BGN) (Laird et al., 2011; Luo et al., 2012; Robinson et al., 2009) has opened the door to investigating PD using this technique. In a study recently published by our group (Szewczyk-Krolikowski et al., 2014a), we have shown that changes within the BGN can differentiate patients with early PD (scanned following overnight medication withdrawal) from healthy controls, and confirmed near-normalisation of the network with levodopa treatment. However, the use of a data-driven method to study the whole of the BGN potentially opens this approach to interference from non-PD-specific group differences that may have an impact on the overall accuracy of the method when replicated using greater sample sizes. Moreover, it is not clear whether these changes are specific to PD or whether they are representative of a more global process.
Basal ganglia dysfunction invariably lies at the heart of Parkinson's disease (Eidelberg et al., 1990). Therefore, we set out to test whether a priori confines may be placed upon the analysis to establish a functional imaging signature for PD that is separate from the ageing process as a whole, as well as other forms of neurodegeneration known to have an impact on resting state networks (Pievani et al., 2014). We have used a resting state functional MRI (rs-fMRI) protocol to investigate the functional changes confined to the caudate, pallidum and putamen of patients with PD. To assess whether any changes are disease specific or may also relate to other forms of neurodegeneration, BGN connectivity in PD patients was compared to both healthy controls and patients with Alzheimer's disease, an example of a neurodegenerative disease with predominantly cortical neurodegeneration but also subcortical involvement (Ikonomovic et al., 2008). The methodology represents a refinement of our previous analysis (Szewczyk-Krolikowski et al., 2014a), towards development of a potential diagnostic biomarker.
2. Methods
2.1. Participants
Thirty-two patients with early PD (within 3.5 years of diagnosis) and 19 healthy-controls were recruited from the Oxford Parkinson's Disease Centre (OPDC) cohort (Rolinski et al., 2014). These participants were the same as those in our previous study (Szewczyk-Krolikowski et al., 2014a). Prior to recruitment into the imaging arm of the study, all participants underwent extensive assessment, including a structured general medical interview, detailed characterisation of motor and non-motor features, and cognitive assessment. Full description of the assessment is available elsewhere (Szewczyk-Krolikowski et al., 2014a; Szewczyk-Krolikowski et al., 2014b). Only patients that met the UK PD Society Brain Bank Criteria for clinically probable idiopathic Parkinson's disease (Hughes et al., 1992), as assessed by the study neurologist, were included in the PD group. Moreover, in order to select a clinically homogenous group and minimise the effect of movement artefact, only the participants with minimal tremor were selected. PD subjects were scanned in a clinically defined “off-state”, a minimum of 12 h after the withdrawal of their dopaminergic medications. Twenty-eight of the patients were also scanned in the “on-state” 60–90 min after taking their own dopaminergic medication. The patients scanned in the clinically defined “off-state” will herein be referred to as the PD group. The healthy control group consisted of subjects with no family history of parkinsonism, recruited largely from the spouses and friends of the PD participants. Healthy controls were not receiving any medications known to affect the dopaminergic system. Both groups only included subjects classified as cognitively healthy, as defined by a Mini-Mental State Examination (MMSE) >26 and no subjective complaint of memory problems.
A further thirty-one patients with clinically probable Alzheimer's disease were recruited from the Oxford Project to Investigate Memory and Ageing and from the Memory Assessment Clinic at the John Radcliffe Hospital in Oxford, United Kingdom (Zamboni et al., 2013). Patients with AD met both the DSM-IV for dementia and the National Institute of Neurological and Communicative Disease and Stroke/Alzheimer's Disease and Related Disorders Association criteria for probable AD dementia and had never taken cholinesterase inhibitors.
The study was undertaken with the understanding and written consent of each subject, with the approval of the local NHS ethics committee, and in compliance with national legislation and the Declaration of Helsinki.
2.2. Neuroimaging data acquisition
Scanning was performed at the Oxford Centre for Clinical Magnetic Resonance Research (OCMR) using a 3 T Trio Siemens MRI scanner (Erlangen, Germany) equipped with a 12-channel head coil.
For each subject, T1-weighted images were obtained using a 3D Magnetisation Prepared-Rapid Acquisition Gradient Echo (MP-RAGE) sequence (192 axial slices, flip angle 8°, 1 × 1 × 1 mm3 voxel size, TE/TR/TI = 4.7 ms/2040 ms/900 ms). Acquisition time for the MP-RAGE was 6 min.
Functional images were acquired using gradient echo planar imaging (EPI) (TR = 2000 ms, TE = 28 ms, flip angle = 89°, resolution = 3 × 3 × 3.5 mm). Thirty-four axial slices were acquired per volume, covering both hemispheres with incomplete coverage of the cerebellum; 180 repetitions were acquired in 6 min. Participants were instructed to remain still and awake with their eyes open.
Field maps were also acquired to reduce EPI distortion due to magnetic field inhomogeneity (TR = 488 ms, TE = 5.19 and 7.65 ms).
2.3. Brain volume measurements
Brain tissue volume, normalised for subject head size, was estimated with SIENAX (Smith et al., 2002). Tissue-type segmentation with partial volume estimation was carried out (Zhang et al., 2001) in order to calculate grey matter volumes. Volumes of the subcortical structures were estimated using FMRIB's Integrated Registration and Segmentation Tool (FIRST) (Patenaude et al., 2011). The volume of each subcortical structure was adjusted for individual head size differences via multiplication by the volumetric scaling factor derived from SIENAX.
2.4. Analysis of resting-state functional magnetic resonance imaging
Resting state analysis was performed using probabilistic independent component analysis (ICA) as implemented in the Multivariate Exploratory Linear Optimised Decomposition into Independent Component FSL tool (MELODIC) (Beckmann and Smith, 2004), part of the FSL software package (Woolrich et al., 2009). Individual pre-statistical processing consisted of motion correction, brain extraction, unwarping using fieldmap data, spatial smoothing using Gaussian kernel of FWHM of 6 mm, and high-pass temporal filtering of 150 s. To account for the effect of motion, non-neural physiology, scanner artefacts and other confounds, we employed a previously described ICA-based de-noising approach. Briefly, after performing subject-level ICA with automated dimensionality estimation, the FIX tool was used to automatically classify the obtained components into signal or noise (Salimi-Khorshidi et al., 2014). The contribution of noise was then regressed out from the data, based on the unique variance related to the noise components and motion confounds from the preprocessed data sets (Griffanti et al., 2014).
Once preprocessed, data were linearly registered to the corresponding structural image using FLIRT (Jenkinson et al., 2002), optimised using Boundary-Based Registration, and registered to Montreal Neurological Institute (MNI) space using non-linear registration.
In order to allow direct comparison across the three cohorts, a resting state template, including the basal ganglia network (BGN) and 21 residual noise components, generated from 80 healthy elderly subjects was used (Szewczyk-Krolikowski et al., 2014a) (Fig. 1). The 21 residual noise components that were included were not fully removed by FIX and were identified as residual noise based on the identification of standard noise components (Beckmann, 2012) and location of signal peaks in non-grey matter areas (e.g. white matter, CSF, skull).
Fig. 1.
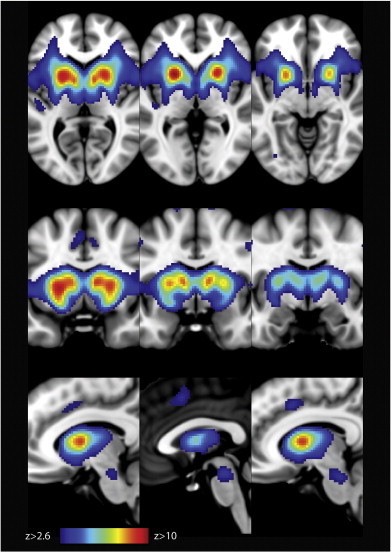
An unbiased template of the resting state basal ganglia network (BGN) generated from 80 healthy controls (Szewczyk-Krolikowski et al., 2014a). The spatial map is thresholded at z > 2.6.
The dual regression approach (Filippini, 2009) was used to identify individual temporal dynamics and the associated spatial maps of the BGN. In the first step of dual regression, the template including the BGN and 21 noise components maps was used in a general linear model (GLM) fit (as spatial regressors) against the separate fMRI data sets previously cleaned with FIX, the output being the corresponding temporal dynamics for each component and subject. Secondly, these time-courses were used in a second GLM fit (as temporal regressors) against the cleaned fMRI data sets to estimate subject-specific spatial maps. Finally, the BGN maps were collected across subjects and tested voxel-wise for statistically significant differences between groups using non-parametric permutation testing with randomise (v. 2.1). The statistical analysis was confined to the basal ganglia as defined by the Harvard-Oxford Subcortical Atlas (Mazziotta, 2001), in order to test intra-basal ganglia functional connectivity. Results were corrected for age, sex and total grey matter volume, and defined as significant at p < 0.05 fully corrected for multiple comparisons using the Threshold-Free Cluster Enhancement (TFCE) approach (Smith and Nichols, 2009).
2.5. Subcortical regions of interest
Subcortical masks were created from the Harvard-Oxford Subcortical Atlas (Mazziotta, 2001). The generated masks were used to extract mean parameter estimates (P.E.), representing the connectivity of a given voxels with the timecourse of the whole network, from subject-specific BGN spatial maps, from the following ROIs: caudate, pallidum and the posterior and anterior putamen, bilaterally. The boundary between the anterior and posterior putamen was taken to be the posterior aspect of the fornix on the axial plane.
2.6. Statistical analysis
All statistical analyses in this study, other than the statistical analyses included in the MRI analysis tools, were performed using Statistical Package for the Social Sciences version 22.0 (SPSS, Chicago, IL, USA). Demographic, clinical and volumetric MRI continuous data were statistically compared between the groups using analysis of variance (ANOVA); the Bonferroni method was used to correct for multiple comparisons. The Pearson χ2 test was to compare ordinal variables. A principal component analysis (PCA)-based dimension reduction method was used to combine values extracted from the ROIs of all subjects into a single factor. The alpha was set at 0.05.
3. Results
3.1. Participants
Mean disease duration for patients with PD (n = 32) was 25.0 (13.9) months. There were no significant differences in age, sex, MMSE, total grey matter or subcortical volumes between healthy controls and subjects with PD (Table 1). Subjects with AD were older and had reduced whole-brain grey matter volume and the volume of the putamen.
Table 1.
Comparisons of demographic and anatomical characteristics.
| Healthy controls (HC) | Subjects with Alzheimer's disease (AD) | Subjects with Parkinson's disease (PD) | Group comparisons | |
|---|---|---|---|---|
| Demographic characteristics | ||||
| n | 19 | 31 | 32 | − |
| Age, years | 60.6 (7.7) | 74.5 (6.5) | 62.1 (11.9) | AD−HCa, AD−PDa |
| Gender, F:M | 8:11 | 15:16 | 14:18 | ns |
| Disease duration, months | − | − | 25.0 (13.9) | − |
| Mean LEDD, mg | − | − | 332 (226) | − |
| UPDRS III (OFF) | − | − | 27.0 (12.6) | − |
| MMSE | 29.4 (1.4) | 20.7 (5.7) | 28.4 (1.6) | AD−HCa, AD−PDa |
| Anatomical characteristics | ||||
| Corrected total grey matter volume, cm3 | 705.2 (47.1) | 640.6 (38.1) | 697.5 (47.9) | AD−HCa, AD−PDa |
| Corrected volume of the caudate, cm3 | 4.4 (0.6) | 4.6 (0.5) | 4.5 (0.4) | ns |
| Corrected volume of the pallidum, cm3 | 2.3 (0.3) | 2.2 (0.5) | 2.3 (0.4) | ns |
| Corrected volume of the putamen, cm3 | 6.0 (0.6) | 5.2 (0.7) | 5.9 (0.8) | AD−HCa, AD−PDa |
F, female; M, male; MMSE, Mini-Mental State Examination; ns, non-significant.
Post hoc test significant at p < .0005.
3.2. Resting state fMRI analysis
Details of mean absolute head motion and the proportion components identified as noise by FIX are shown in Supplementary Table 1. No subjects had to be excluded on the basis of excessive head motion. On average, patients with AD had more head motion, and had a marginally larger proportion of components identified as noise, when compared to subjects with PD but not healthy controls. The mean connectivity maps for each group are shown in Supplementary Fig. 1.
Supplementary Fig. 1.
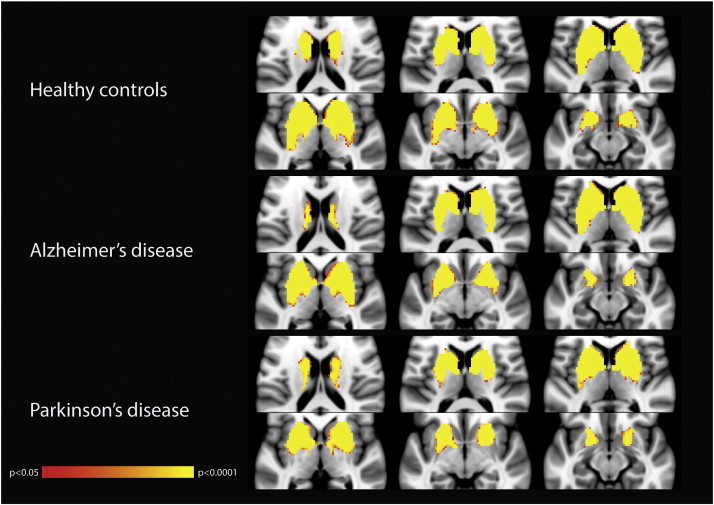
Group-level map of the BGN for each study group. Images are displayed in radiological convention (right is left). Clusters are thresholded at p > 0.05 after FWE correction.
3.2.2. Voxel-wise analysis
Voxel-wise comparisons restricted to the basal ganglia demonstrated widespread decrease in connectivity within the network in subjects with PD when compared to healthy controls, subjects with AD, and healthy controls and patients with AD, combined (Fig. 2). Reduced connectivity was observed in the caudate, pallidum and the putamen, bilaterally. No differences within the basal ganglia network were found between the HC and AD groups.
Fig. 2.
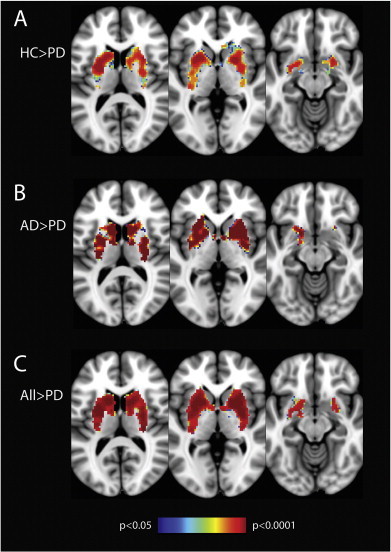
Voxel-wise analysis confined to the basal ganglia showing decreased connectivity in PD patients compared to a) healthy controls; b) patients with Alzheimer's disease; and c) patients with Alzheimer's disease and healthy controls, combined. Results show significantly reduced connectivity in PD in all regions of the basal ganglia. In image c, voxels showing reduced connectivity make up 68.9%, 99.0% 98.3% and 99.7% of the total volume of the caudate, pallidum, anterior putamen and the posterior putamen, respectively.Images are displayed in radiological convention (right is left). Clusters are thresholded at p > 0.05 after FWE correction.
3.2.3. Region of interest analysis
As demonstrated in the voxel-wise analysis, measures of functional connectivity within the regions of interest were markedly altered in the Parkinson's disease group (Table 2 and Fig. 3). Mean parameter estimates (P.E.) were significantly lower in all of the subcortical regions, with the greatest decrease in P.E., compared to the healthy control group, observed in the posterior putamen (p < 0.005). Although the mean P.E. in the caudate of subjects with AD was lower than that of healthy controls, this difference did not reach statistical significance (95% confidence interval −45.7–8.1).
Table 2.
Mean parameter estimates extracted from regions of interest within the basal ganglia.
| Healthy controls (HC) | Subjects with Alzheimer's disease (AD) | Subjects with Parkinson's disease (PD) | Group comparisons | |
|---|---|---|---|---|
| Caudate | 27.6 (15.6) | 22.6 (12.0) | 16.0 (7.0) | AD−PDa, HC−PDa |
| Pallidum | 17.0 (9.7) | 17.2 (10.6) | 10.0 (6.3) | AD−PCb, HC−PDb |
| Anterior putamen | 36.5 (14.4) | 35.5 (14.4) | 22.7 (7.4) | AD−PDc, HC−PDc |
| Posterior putamen | 21.8 (11.0) | 19.6 (11.1) | 10.0 (7.9) | AD−PDa, HC−PDa |
Post hoc test significant at p < .005.
Post hoc test significant at p < .05.
Post hoc test significant at p < .0005.
Fig. 3.
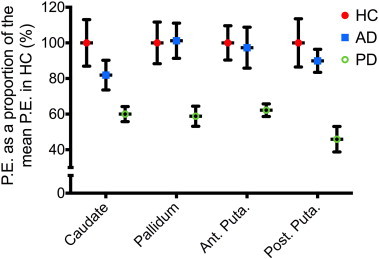
Regions of interest analysis. Average of the mean P.E. extracted bilaterally from the regions of interest, expressed as a proportion of the mean P.E. for that region in healthy controls (mean ± standard error of the mean). Results demonstrate significantly reduced P.E. in all regions in PD, compared to healthy controls and patients with Alzheimer's disease. HC, healthy controls; AD, Alzheimer's disease; PD, Parkinson's disease; P.E., parameter estimates; ant. Puta, anterior putamen; post. Puta, posterior putamen.
3.3. The diagnostic utility of resting state connectivity
In order to ascertain the diagnostic utility of resting state connectivity analyses, and represent basal ganglia activity as a whole, the mean parameter estimates across the four regions of interest were coalesced into a single component score using principal component analysis (PCA)-based dimensionality reduction. The component accounted for 68.3% of the total variance in the data.
As was the case for the individual regions of interest, the mean PCA component score was significantly lower in Parkinson's disease than that in healthy subjects and subjects with Alzheimer's disease (Fig. 4a). The mean component score did not correlate with disease severity (UPDRS III motor score) or disease duration. The receiver operating characteristic (ROC) area under the curve (AUC) was 0.81 (95% C.I. 0.71–0.90), when comparing the PD group to the group including both HC and AD (Fig. 4b). The mean component score was a better discriminator than when the individual mean parameter estimates from the four regions of interest were used. The mean component score for PD patients scanned in the clinically defined “on-state” was significantly higher than those in the “off-state” (p < 0.0001). There was no statistically significant difference between PD patients taking dopaminergic medication, patients with Alzheimer's disease and healthy controls (p = 0.4).
Fig. 4.
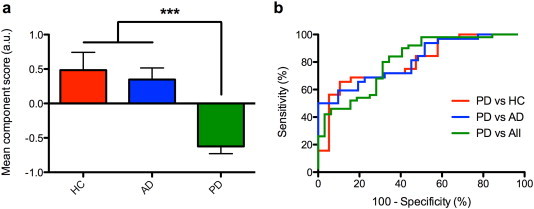
The diagnostic utility of resting state connectivity. a) Mean component scores were calculated using a data-driven principal component analysis-based dimensionality reduction method by combining the mean parameter estimates from each of the regions of interest. Results demonstrate a significantly lower score in patients with PD, when compared to patients with Alzheimer's disease and healthy controls. ***p < 0.0001. b) Individual component scores were used to generate receiver operating characteristic (ROC) curves. Area under the curve was 0.80 (95% C.I. 0.68–0.93), 0.81 (95% C.I. 0.71–0.92) and 0.81 (95% C.I. 0.71–0.90) for the PD vs HC, PD vs AD and PD vs All comparisons, respectively. HC, healthy controls; AD, Alzheimer's disease; PD, Parkinson's disease; All, group comprised of healthy controls and patients with Alzheimer's disease.
5. Discussion
Using resting state fMRI we have previously shown connectivity differences in patients with PD relative to controls. Using a refined methodology, here we reproduce this finding and show that aberrant connectivity within the basal ganglia network is not a widespread feature of neurodegeneration, being absent in AD. Moreover, by extracting mean parameter estimates from a priori defined regions of interest within the basal ganglia, we have shown that resting-connectivity of the basal ganglia may have a potential role as a diagnostic biomarker for PD. Hence, by moving away from a single study-specific design and by including disease controls, we contribute to the translational pipeline for the development of reliable and clinically useful imaging biomarkers.
In line with previous task based (Monchi et al., 2007; Wu et al., 2010) and resting state studies (Hacker et al., 2012; Wu et al., 2012; Szewczyk-Krolikowski et al., 2014a), we have comprehensively shown reduced connectivity within the basal ganglia network in PD subjects, including the caudate, putamen and pallidum, when compared to healthy controls. Importantly, we have also shown that the reduction in resting state connectivity is apparent in the PD group not only when compared to a healthy aged population, but also to patients with another diffuse neurodegenerative condition, in this case, Alzheimer's disease, which is typically associated with changes within the default mode network (DMN) (Greicius et al., 2004). At face value, this may seem somewhat surprising given the evidence for basal ganglia involvement in AD from pathophysiological (Ikonomovic et al., 2008) and imaging studies (de Jong et al., 2008; Madsen et al., 2010). Indeed, we have shown reduced total grey matter volume, as well as the volume of the putamen, in patients with AD, when compared to those with PD. Despite this, dopamine and homovanillic acid levels seem not to be altered in AD (Langlais et al., 1993), suggesting that overall function is preserved. This may explain why there are no statistically significant differences in resting state connectivity between patient with AD and healthy controls. Therefore, resting state connectivity seems to reflect basal ganglia function independently from non-specific neurodegeneration.
As can be seen from the voxel-wise analyses (Fig. 2), the involvement of the basal ganglia in PD is not uniform, with the caudate relatively spared. The difference in mean PE's is particularly striking between the caudate and posterior putamen (Fig. 3). This is in agreement with previous post-mortem (Goldstein et al., 2011; Kish et al., 1988; Wilson et al., 1996) and radiotracer imaging (Morrish et al., 1998; Nurmi et al., 2001) studies showing a heterogeneous pattern of basal ganglia involvement in PD, with the greatest loss of dopaminergic function in the posterior putamen, and caudate the least affected. Moreover, a recent seed-based resting state connectivity study (Hacker et al., 2012) showed a graded pattern of striatal functional connectivity with the brainstem of patient with PD and healthy controls. The authors speculated that this gradient represents the underlying susceptibility to dopaminergic dysfunction in PD.
When combined into a single component score using a data-driven dimensionality reduction technique, reduced connectivity scores within the basal ganglia separated patients with PD from the other participants with a diagnostic sensitivity of 81%, similar to the 85% diagnostic accuracy using the method previously described by our group (Szewczyk-Krolikowski et al., 2014a). The method used herein may, however, have a number of advantages. Firstly, parameter estimates were extracted from whole regions of interest selected a priori on the basis that they are known to play a key role in the pathophysiology of Parkinson's disease. This is in contrast to the previous method where parameter estimates were extracted using a mask of voxels in the PD group that showed reduced connectivity when compared to a healthy control group. As this mask was created from a relatively small number of participants, the results obtained using it may not be transferrable to other patient groups and MRI scanners. Clearly, both methods of obtaining measures of basal ganglia function must be validated on a completely separate group of PD patients and healthy controls. Secondly, by focussing on regions of interest, this method allows us to study the function of individual constituents of the basal ganglia. The pattern of decreased connectivity resembles that obtained using radiotracer imaging and has the potential to further our understanding of the pathophysiology of Parkinson's disease.
Further testing of larger independent study groups is necessary to validate our results. Moreover, in order to reduce imaging artefacts and conceivable confounding effects on the basal ganglia network, the generalisability of our findings may have been limited by excluding subjects with tremor-dominant disease. Whilst previous studies have not found any difference in basal ganglia connectivity in patients with and without tremor (Helmich et al., 2010), and tremor does not appear to be correlated with basal ganglia dysfunction (Benamer et al., 2003; Eidelberg et al., 1995; Isaias et al., 2007), further studies are necessary to confirm that the results of this study are transferrable to the tremor-dominant PD group. Lastly, the diagnostic accuracy of 81% using the method described herein is less than the diagnostic accuracy of a clinical assessment carried out by an experienced clinician (Hughes et al., 1992). Current work is concentrating on the integration of multiple brain networks to improve the sensitivity and specificity for PD. Moreover, further studies are required to ascertain whether this method is sensitive enough to pick up basal ganglia dysfunction in prodromal PD, for it to have a role as a potential imaging biomarker.
6. Conclusion
In conclusion, our results indicate that resting-state functional MRI can be used to demonstrate the aberrant functional connectivity within the basal ganglia of patients with early Parkinson's disease. These changes are not seen in Alzheimer's disease, suggesting that they are representative of true basal ganglia dysfunction, and not just generalised neurodegeneration. Although further validation is necessary, extracting measures of functional connectivity from a priori regions of interest within the basal ganglia shows promise as a diagnostic biomarker of PD.
Author's contributions
Michal Rolinski: Literature review, experimental design, data acquisition, image data analysis, result interpretation, manuscript drafting and revision.
Ludovica Griffanti: Experimental design, image data analysis, manuscript drafting and revision.
Konrad Szewczyk-Krolikowski: Data acquisition, manuscript drafting and revision.
Ricarda A.L. Menke: Data acquisition, manuscript drafting and revision.
Gordon K. Wilcock: Data acquisition, manuscript drafting and revision.
Nicola Filippini: Image data analysis, data acquisition, manuscript drafting and revision.
Giovanna Zamboni: Data acquisition, manuscript drafting and revision.
Michele T.M. Hu: Experimental design, result interpretation, manuscript drafting and revision.
Clare E. Mackay: Experimental design, result interpretation, manuscript drafting and revision.
Conflicts of interest
Authors report no conflicts of interest.
Funding
This study was funded by the Monument Trust Discovery Award from Parkinson's UK and supported by the National Institute for Health Research (NIHR) Oxford Biomedical Research Centre based at Oxford University Hospitals NHS Trust and University of Oxford and the Dementias and Neurodegenerative Diseases Research Network (DeNDRoN). The views expressed are those of the author(s) and not necessarily those of the NHS, the NIHR or the Department of Health.
The following are the supplementary data related to this article.
Details of preprocessing.
Acknowledgements
The authors would like to thank the editors and the anonymous reviewers for their useful comments, and all participants that have taken part in this study.
References
- Abbott R.D., Petrovitch H., White L.R., Masaki K.H., Tanner C.M., Curb J.D., Grandinetti A., Blanchette P.L., Popper J.S., Ross G.W. Frequency of bowel movements and the future risk of Parkinson's disease. Neurology. 2001;57(3):456–462. doi: 10.1212/WNL.57.3.456. 11502913 [DOI] [PubMed] [Google Scholar]
- Balthazar M.L., de Campos B.M., Franco A.R., Damasceno B.P., Cendes F. Whole cortical and default mode network mean functional connectivity as potential biomarkers for mild Alzheimer's disease. Psychiatry Res. 2014;221(1):37–42. doi: 10.1016/j.pscychresns.2013.10.010. 24268581 [DOI] [PubMed] [Google Scholar]
- Beckmann C.F. Modelling with independent components. Neuroimage. 2012;62(2):891–901. doi: 10.1016/j.neuroimage.2012.02.020. 22369997 [DOI] [PubMed] [Google Scholar]
- Beckmann C.F., Smith S.M. Probabilistic independent component analysis for functional magnetic resonance imaging. I. E.E.E. Transactions Med. Imaging. 2004;23(2):137–152. doi: 10.1109/TMI.2003.822821. 14964560 [DOI] [PubMed] [Google Scholar]
- Benamer H.T., Oertel W.H., Patterson J., Hadley D.M., Pogarell O., Höffken H., Gerstner A., Grosset D.G. Prospective study of presynaptic dopaminergic imaging in patients with mild parkinsonism and tremor disorders: part 1. Baseline and 3-month observations. Mov. Disord. 2003;18(9):977–984. doi: 10.1002/mds.10482. 14502664 [DOI] [PubMed] [Google Scholar]
- de Jong L.W., van der Hiele K., Veer I.M., Houwing J.J., Westendorp R.G., Bollen E.L., de Bruin P.W., Middelkoop H.A., van Buchem M.A., van der Grond J. Strongly reduced volumes of putamen and thalamus in Alzheimer's disease: an MRI study. Brain. 2008;131(12):3277–3285. doi: 10.1093/brain/awn278. 19022861 [DOI] [PMC free article] [PubMed] [Google Scholar]
- Dopper E.G., Rombouts S.A., Jiskoot L.C., den Heijer T., de Graaf J.R., de Koning I., Hammerschlag A.R., Seelaar H., Seeley W.W., Veer I.M., van Buchem M.A., Rizzu P., van Swieten J.C. Structural and functional brain connectivity in presymptomatic familial frontotemporal dementia. Neurology. 2014;83(2):e19–e26. doi: 10.1212/WNL.0000000000000583. 25002573 [DOI] [PubMed] [Google Scholar]
- Eidelberg D., Moeller J.R., Dhawan V., Sidtis J.J., Ginos J.Z., Strother S.C., Cedarbaum J., Greene P., Fahn S., Rottenberg D.A. The metabolic anatomy of Parkinson's disease: complementary [18F]fluorodeoxyglucose and [18F]fluorodopa positron emission tomographic studies. Mov. Disord. 1990;5(3):203–213. doi: 10.1002/mds.870050304. 2117706 [DOI] [PubMed] [Google Scholar]
- Eidelberg D., Moeller J.R., Ishikawa T., Dhawan V., Spetsieris P., Chaly T., Robeson W., Dahl J.R., Margouleff D. Assessment of disease severity in parkinsonism with fluorine-18-fluorodeoxyglucose and PET. J. Nucl. Med. 1995;36(3):378–383. 7884498 [PubMed] [Google Scholar]
- Fearnley J.M., Lees A.J. Ageing and Parkinson's disease: substantia nigra regional selectivity. Brain. 1991;114(5):2283–2301. doi: 10.1093/brain/114.5.2283. 1933245 [DOI] [PubMed] [Google Scholar]
- Filippini N. Distinct patterns of brain activity in young carriers of the APOE-epsilon4 allele. Proc. Natl. Acad. Sci. U S A. 2009;106(17):7209–7214. doi: 10.1073/pnas.0811879106. [DOI] [PMC free article] [PubMed] [Google Scholar]
- Goldstein D.S., Sullivan P., Holmes C., Kopin I.J., Basile M.J., Mash D.C. Catechols in post-mortem brain of patients with Parkinson disease. Eur. J. Neurol. 2011;18(5):703–710. doi: 10.1111/j.1468-1331.2010.03246.x. 21073636 [DOI] [PMC free article] [PubMed] [Google Scholar]
- Greicius M.D., Srivastava G., Reiss A.L., Menon V. Default-mode network activity distinguishes Alzheimer's disease from healthy aging: evidence from functional MRI. Proc. Natl. Acad. Sci. U. S. A. 2004;101(13):4637–4642. doi: 10.1073/pnas.0308627101. 15070770 [DOI] [PMC free article] [PubMed] [Google Scholar]
- Griffanti L., Salimi-Khorshidi G., Beckmann C.F., Auerbach E.J., Douaud G., Sexton C.E., Zsoldos E., Ebmeier K.P., Filippini N., Mackay C.E., Moeller S., Xu J., Yacoub E., Baselli G., Ugurbil K., Miller K.L., Smith S.M. ICA-based artefact removal and accelerated fMRI acquisition for improved resting state network imaging. Neuroimage. 2014;95:232–247. doi: 10.1016/j.neuroimage.2014.03.034. 24657355 [DOI] [PMC free article] [PubMed] [Google Scholar]
- Hacker C.D., Perlmutter J.S., Criswell S.R., Ances B.M., Snyder A.Z. Resting state functional connectivity of the striatum in Parkinson's disease. Brain. 2012;135(12):3699–3711. doi: 10.1093/brain/aws281. 23195207 [DOI] [PMC free article] [PubMed] [Google Scholar]
- Helmich R.C., Derikx L.C., Bakker M., Scheeringa R., Bloem B.R., Toni I. Spatial remapping of cortico-striatal connectivity in Parkinson's disease. Cereb. Cortex. 2010;20(5):1175–1186. doi: 10.1093/cercor/bhp178. 19710357 [DOI] [PubMed] [Google Scholar]
- Hughes A.J., Daniel S.E., Kilford L., Lees A.J. Accuracy of clinical diagnosis of idiopathic Parkinson's disease: a clinico-pathological study of 100 cases. J. Neurol. Neurosurg. Psychiatry. 1992;55(3):181–184. doi: 10.1136/jnnp.55.3.181. 1564476 [DOI] [PMC free article] [PubMed] [Google Scholar]
- Ikonomovic M.D., Klunk W.E., Abrahamson E.E., Mathis C.A., Price J.C., Tsopelas N.D., Lopresti B.J., Ziolko S., Bi W., Paljug W.R., Debnath M.L., Hope C.E., Isanski B.A., Hamilton R.L., DeKosky S.T. Post-mortem correlates of in vivo PiB-PET amyloid imaging in a typical case of Alzheimer's disease. Brain. 2008;131(6):1630–1645. doi: 10.1093/brain/awn016. 18339640 [DOI] [PMC free article] [PubMed] [Google Scholar]
- Isaias I.U., Benti R., Cilia R., Canesi M., Marotta G., Gerundini P., Pezzoli G., Antonini A. [123I]FP-CIT striatal binding in early Parkinson's disease patients with tremor vs. akinetic-rigid onset. Neuroreport. 2007;18(14):1499–1502. doi: 10.1097/WNR.0b013e3282ef69f9. 17712282 [DOI] [PubMed] [Google Scholar]
- Jankovic J. Parkinson's disease: clinical features and diagnosis. J. Neurol. Neurosurg. Psychiatry. 2008;79(4):368–376. doi: 10.1136/jnnp.2007.131045. 18344392 [DOI] [PubMed] [Google Scholar]
- Jenkinson M., Bannister P., Brady M., Smith S. Improved optimization for the robust and accurate linear registration and motion correction of brain images. Neuroimage. 2002;17(2):825–841. doi: 10.1006/nimg.2002.1132. 12377157 [DOI] [PubMed] [Google Scholar]
- Kish S.J., Shannak K., Hornykiewicz O. Uneven pattern of dopamine loss in the striatum of patients with idiopathic Parkinson's disease. Pathophysiologic and clinical implications. N. Engl. J. Med. 1988;318(14):876–880. doi: 10.1056/NEJM198804073181402. 3352672 [DOI] [PubMed] [Google Scholar]
- Laird A.R., Fox P.M., Eickhoff S.B., Turner J.A., Ray K.L., McKay D.R., Glahn D.C., Beckmann C.F., Smith S.M., Fox P.T. Behavioral interpretations of intrinsic connectivity networks. J. Cogn. Neurosci. 2011;23(12):4022–4037. doi: 10.1162/jocn_a_00077. 21671731 [DOI] [PMC free article] [PubMed] [Google Scholar]
- Langlais P.J., Thal L., Hansen L., Galasko D., Alford M., Masliah E. Neurotransmitters in basal ganglia and cortex of Alzheimer's disease with and without Lewy bodies. Neurology. 1993;43(10):1927–1934. doi: 10.1212/WNL.43.10.1927. 8105420 [DOI] [PubMed] [Google Scholar]
- Luo C., Li Q., Xia Y., Lei X., Xue K., Yao Z., Lai Y., Martínez-Montes E., Liao W., Zhou D., Valdes-Sosa P.A., Gong Q., Yao D. Resting state basal ganglia network in idiopathic generalized epilepsy. Hum. Brain Mapp. 2012;33(6):1279–1294. doi: 10.1002/hbm.21286. 21520351 [DOI] [PMC free article] [PubMed] [Google Scholar]
- Madsen S.K., Ho A.J., Hua X., Saharan P.S., Toga A.W., Jack C.R., Weiner M.W., Thompson P.M., Alzheimer's Disease Neuroimaging Initiative 3D maps localize caudate nucleus atrophy in 400 Alzheimer's disease, mild cognitive impairment, and healthy elderly subjects. Neurobiol. Aging. 2010;31:1312–1325. doi: 10.1016/j.neurobiolaging.2010.05.002. [DOI] [PMC free article] [PubMed] [Google Scholar]
- Mazziotta J. A probabilistic atlas and reference system for the human brain: International Consortium for Brain Mapping (ICBM) Philos. Trans. R. Soc. Lond. B Biol. Sci. 2001;356(1412):1293–1322. doi: 10.1098/rstb.2001.0915. [DOI] [PMC free article] [PubMed] [Google Scholar]
- Monchi O., Petrides M., Mejia-Constain B., Strafella A.P. Cortical activity in Parkinson's disease during executive processing depends on striatal involvement. Brain. 2007;130(1):233–244. doi: 10.1093/brain/awl326. 17121746 [DOI] [PMC free article] [PubMed] [Google Scholar]
- Morrish P.K., Rakshi J.S., Bailey D.L., Sawle G.V., Brooks D.J. Measuring the rate of progression and estimating the preclinical period of Parkinson's disease with [18F]dopa PET. J. Neurol. Neurosurg. Psychiatry. 1998;64(3):314–319. doi: 10.1136/jnnp.64.3.314. 9527140 [DOI] [PMC free article] [PubMed] [Google Scholar]
- Nurmi E., Ruottinen H.M., Bergman J., Haaparanta M., Solin O., Sonninen P., Rinne J.O. Rate of progression in Parkinson's disease: a 6-[18F]fluoro-l-dopa PET study. Mov. Disord. 2001;16(4):608–615. doi: 10.1002/mds.1139. 11481683 [DOI] [PubMed] [Google Scholar]
- Patenaude B., Smith S.M., Kennedy D.N., Jenkinson M. A Bayesian model of shape and appearance for subcortical brain segmentation. Neuroimage. 2011;56(3):907–922. doi: 10.1016/j.neuroimage.2011.02.046. 21352927 [DOI] [PMC free article] [PubMed] [Google Scholar]
- Pievani M., Filippini N., van den Heuvel M.P., Cappa S.F., Frisoni G.B. Brain connectivity in neurodegenerative diseases — from phenotype to proteinopathy. Nat. Rev. Neurol. 2014;10(11):620–633. doi: 10.1038/nrneurol.2014.178. 25287597 [DOI] [PubMed] [Google Scholar]
- Robinson S., Basso G., Soldati N., Sailer U., Jovicich J., Bruzzone L., Kryspin-Exner I., Bauer H., Moser E. A resting state network in the motor control circuit of the basal ganglia. B.M.C. Neurosci. 2009;10:137. doi: 10.1186/1471-2202-10-137. 19930640 [DOI] [PMC free article] [PubMed] [Google Scholar]
- Rolinski M., Szewczyk-Krolikowski K., Tomlinson P.R., Nithi K., Talbot K., Ben-Shlomo Y., Hu M.T. REM sleep behaviour disorder is associated with worse quality of life and other non-motor features in early Parkinson's disease. J. Neurol. Neurosurg. Psychiatry. 2014;85(5):560–566. doi: 10.1136/jnnp-2013-306104. 24187013 [DOI] [PMC free article] [PubMed] [Google Scholar]
- Ross G.W., Petrovitch H., Abbott R.D., Tanner C.M., Popper J., Masaki K., Launer L., White L.R. Association of olfactory dysfunction with risk for future Parkinson's disease. Ann. Neurol. 2008;63(2):167–173. doi: 10.1002/ana.21291. 18067173 [DOI] [PubMed] [Google Scholar]
- Salimi-Khorshidi G., Douaud G., Beckmann C.F., Glasser M.F., Griffanti L., Smith S.M. Automatic denoising of functional MRI data: combining independent component analysis and hierarchical fusion of classifiers. Neuroimage. 2014;90:449–468. doi: 10.1016/j.neuroimage.2013.11.046. 24389422 [DOI] [PMC free article] [PubMed] [Google Scholar]
- Schenck C.H., Boeve B.F., Mahowald M.W. Delayed emergence of a parkinsonian disorder or dementia in 81% of older men initially diagnosed with idiopathic rapid eye movement sleep behavior disorder: a 16-year update on a previously reported series. Sleep Med. 2013;14(8):744–748. doi: 10.1016/j.sleep.2012.10.009. 23347909 [DOI] [PubMed] [Google Scholar]
- Shiba M., Bower J.H., Maraganore D.M., McDonnell S.K., Peterson B.J., Ahlskog J.E., Schaid D.J., Rocca W.A. Anxiety disorders and depressive disorders preceding Parkinson's disease: a case–control study. Mov. Disord. 2000;15(4):669–677. doi: 10.1002/1531-8257(200007)15:4<669::AID-MDS1011>3.0.CO;2-5. 10928577 [DOI] [PubMed] [Google Scholar]
- Smith S.M., Zhang Y., Jenkinson M., Chen J., Matthews P.M., Federico A., De Stefano N. Accurate, robust, and automated longitudinal and cross-sectional brain change analysis. Neuroimage. 2002;17(1):479–489. doi: 10.1006/nimg.2002.1040. 12482100 [DOI] [PubMed] [Google Scholar]
- Smith S.M., Nichols T.E. Threshold-free cluster enhancement: addressing problems of smoothing, threshold dependence and localisation in cluster inference. Neuroimage. 2009;44(1):83–98. doi: 10.1016/j.neuroimage.2008.03.061. [DOI] [PubMed] [Google Scholar]
- Szewczyk-Krolikowski K., Menke R.A., Rolinski M., Duff E., Salimi-Khorshidi G., Filippini N., Zamboni G., Hu M.T., Mackay C.E. Functional connectivity in the basal ganglia network differentiates PD patients from controls. Neurology. 2014;83(3):208–214. doi: 10.1212/WNL.0000000000000592. 24920856 [DOI] [PMC free article] [PubMed] [Google Scholar]
- Szewczyk-Krolikowski K., Tomlinson P., Nithi K., Wade-Martins R., Talbot K., Ben-Shlomo Y., Hu M.T. The influence of age and gender on motor and non-motor features of early Parkinson's disease: initial findings from the Oxford Parkinson Disease Center (OPDC) discovery cohort. Parkinsonism Relat. Disord. 2014;20(1):99–105. doi: 10.1016/j.parkreldis.2013.09.025. 24183678 [DOI] [PubMed] [Google Scholar]
- Wilson J.M., Levey A.I., Rajput A., Ang L., Guttman M., Shannak K., Niznik H.B., Hornykiewicz O., Pifl C., Kish S.J. Differential changes in neurochemical markers of striatal dopamine nerve terminals in idiopathic Parkinson's disease. Neurol. 1996;47(3):718–726. doi: 10.1212/WNL.47.3.718. 8797470 [DOI] [PubMed] [Google Scholar]
- Wolf R.C., Sambataro F., Vasic N., Depping M.S., Thomann P.A., Landwehrmeyer G.B., Süssmuth S.D., Orth M. Abnormal resting-state connectivity of motor and cognitive networks in early manifest Huntington's disease. Psychol. Med. 2014;44(15):3341–3356. doi: 10.1017/S0033291714000579. 25066491 [DOI] [PubMed] [Google Scholar]
- Woolrich M.W., Jbabdi S., Patenaude B., Chappell M., Makni S., Behrens T., Beckmann C., Jenkinson M., Smith S.M. Bayesian analysis of neuroimaging data in FSL. Neuroimage. 2009;45(1 Suppl):S173–S186. doi: 10.1016/j.neuroimage.2008.10.055. 19059349 [DOI] [PubMed] [Google Scholar]
- Wu T., Wang J., Wang C., Hallett M., Zang Y., Wu X., Chan P. Basal ganglia circuits changes in Parkinson's disease patients. Neurosci. Lett. 2012;524(1):55–59. doi: 10.1016/j.neulet.2012.07.012. 22813979 [DOI] [PMC free article] [PubMed] [Google Scholar]
- Wu T., Wang L., Hallett M., Li K., Chan P. Neural correlates of bimanual anti-phase and in-phase movements in Parkinson's disease. Brain. 2010;133(8):2394–2409. doi: 10.1093/brain/awq151. 20566485 [DOI] [PMC free article] [PubMed] [Google Scholar]
- Zamboni G., Wilcock G.K., Douaud G., Drazich E., McCulloch E., Filippini N., Tracey I., Brooks J.C., Smith S.M., Jenkinson M., Mackay C.E. Resting functional connectivity reveals residual functional activity in Alzheimer's disease. Biol. Psychiatry. 2013;74(5):375–383. doi: 10.1016/j.biopsych.2013.04.015. 23726515 [DOI] [PubMed] [Google Scholar]
- Zhang Y., Brady M., Smith S. Segmentation of brain MR images through a hidden Markov random field model and the expectation–maximization algorithm. I. E.E.E. Trans. Med. Imaging. 2001;20(1):45–57. doi: 10.1109/42.906424. 11293691 [DOI] [PubMed] [Google Scholar]
Associated Data
This section collects any data citations, data availability statements, or supplementary materials included in this article.
Supplementary Materials
Details of preprocessing.